
WHO vs. EPA Outdoor Air Quality Standards: What Homeowners Should Know
August 14, 2026

By Michelle Wan, Brand Manager and Air Quality Writer | Reviewed by David Clark, Licensed HVAC Technician | Published: August 14, 2026
WHO vs. EPA Air Quality Standards: What Is the Difference?
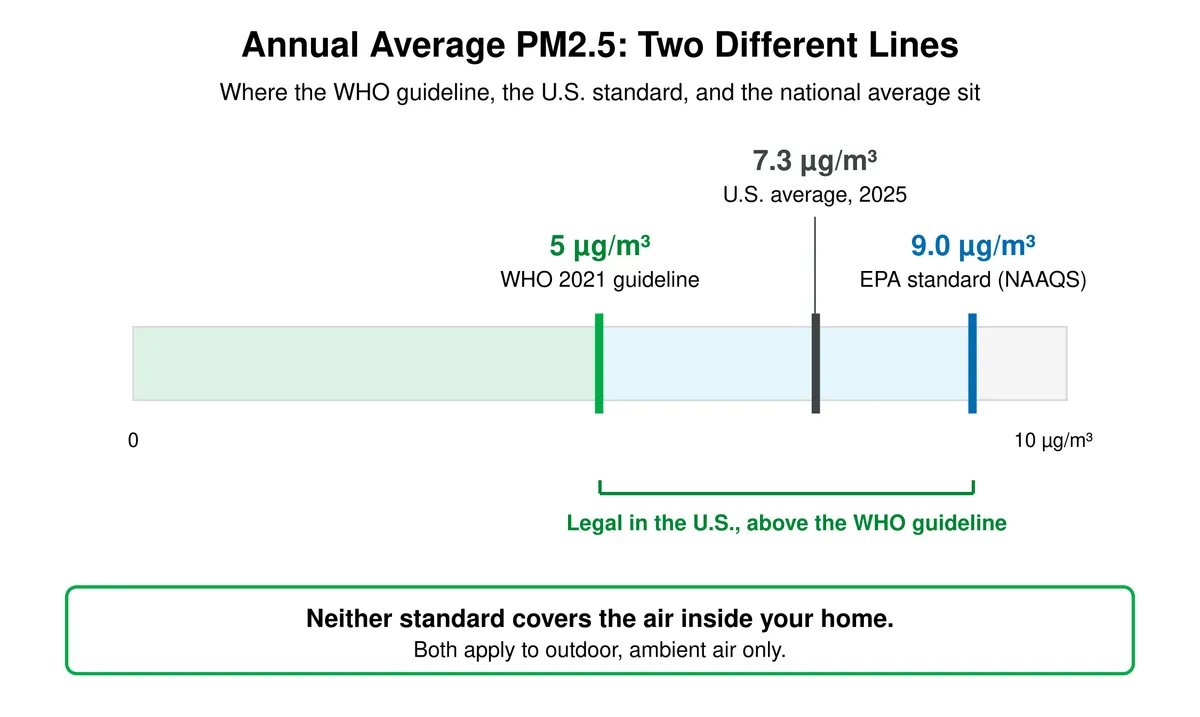
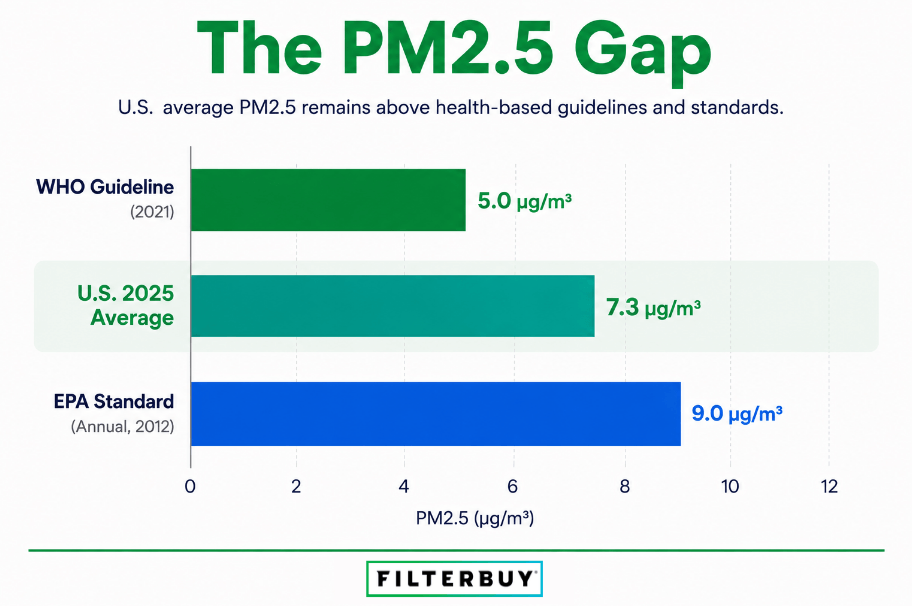
The WHO recommends annual average PM2.5 stay at or below 5 µg/m³. The EPA's enforceable U.S. standard is 9.0 µg/m³, 80 percent higher. WHO issues health-based recommendations with no legal force. The EPA writes regulations that states must meet. So outdoor air can pass legally in the United States and still sit above the level WHO treats as healthy.
WHO 2021 guideline: 5 µg/m³ annual PM2.5, voluntary and health-based.
EPA standard (NAAQS): 9.0 µg/m³ annual PM2.5, legally enforceable.
U.S. national average, 2025: 7.3 µg/m³, sitting between the two.
Both frameworks: outdoor, ambient air only. Neither one covers the air inside your home.
The one number here you can actually set is the one inside your walls. Take the quick quiz below to match your system to the right filter size and MERV rating.
Answer a few quick questions and we will match you to your filter.
TL;DR
The World Health Organization (WHO) and the U.S. Environmental Protection Agency (EPA) both publish outdoor air quality thresholds for pollutants like fine particulate matter (PM2.5) and ozone, but they set different numbers and serve different purposes. The WHO 2021 guideline caps annual average PM2.5 at 5 micrograms per cubic meter (µg/m³), while the EPA’s enforceable U.S. standard sits at 9.0 µg/m³, 80 percent higher. The difference is one of purpose: WHO issues health-based recommendations with no legal force, while the EPA writes regulations states must meet. So air can pass legally in the United States and still sit well above the level WHO considers healthy.
Key Takeaways
WHO’s annual PM2.5 guideline is 5 µg/m³. The EPA’s annual PM2.5 standard is 9.0 µg/m³. The EPA threshold is 80% higher than the WHO guideline.
WHO guidelines are voluntary; EPA standards are enforceable. The EPA’s National Ambient Air Quality Standards (NAAQS) trigger legal consequences for areas that don’t meet them. WHO guidelines carry no penalties.
The average U.S. home sits in the gap. The national annual average PM2.5 concentration was 7.3 µg/m³ in 2025. That is about 19% below the EPA limit but 46% above the WHO guideline.
The ozone gap is roughly 37%. The EPA’s 8-hour ozone standard of 0.070 ppm converts to about 137 µg/m³, compared with WHO’s 8-hour guideline of 100 µg/m³.
Neither organization regulates the air inside your house. Both frameworks apply only to outdoor, ambient air. No federal agency enforces a PM2.5 limit inside a private home.
44% of Americans, 152.3 million people, live in counties with failing grades for ozone or particle pollution, according to the American Lung Association’s State of the Air 2026 report.
What’s The Difference Between WHO And EPA Air Quality Standards?
The WHO publishes global health guidelines; the EPA writes U.S. law. The WHO Global Air Quality Guidelines identify the concentrations at which scientific evidence shows health effects beginning, making them an aspirational target for any country. The EPA’s National Ambient Air Quality Standards are federal regulations issued under the Clean Air Act, and every state must build an enforcement plan to meet them. WHO recommends; the EPA requires. Most of the gap between the two numbers follows from that distinction.
WHO last revised its guidelines in September 2021, halving the annual PM2.5 recommendation from 10 µg/m³ to 5 µg/m³ and cutting the annual nitrogen dioxide guideline by 75%. Both changes reflect roughly 15 years of research showing harm at concentrations previously considered acceptable.
The EPA’s standards move on a different clock. The Clean Air Act requires a review of each standard every five years, and each revision sets off a chain of legal obligations: states submit boundary recommendations, the EPA designates areas as attainment or nonattainment, and nonattainment areas must adopt emission-reduction plans. That machinery is why EPA revisions are slower, more contested, and more frequently litigated than WHO updates.
WHO Vs. EPA: The Numbers Side By Side
These frameworks are hard to compare because WHO publishes in micrograms per cubic meter while the EPA reports ozone and nitrogen dioxide in parts per million or billion. Filterbuy built the table below because we could not find a source that put both on one scale, and without that conversion the gap stays invisible.
WHO vs. EPA thresholds
Sources: WHO Global Air Quality Guidelines (2021); EPA NAAQS Table (updated November 2025). Conversions calculated at 25°C and 1 atmosphere using µg/m³ = ppb × molecular weight ÷ 24.45.
Two caveats apply. Compliance is defined differently on each side: the EPA averages its annual PM2.5 standard over three years and scores the 24-hour standard at the 98th percentile, while WHO works from a 99th percentile. And WHO also publishes interim targets, stepping-stone levels for regions far from the guideline, which are frequently mistaken for the guidelines themselves.
Why Does The EPA Allow More Pollution Than The Who Recommends?
The EPA is not permitted to set air quality standards based on cost. In Whitman v. American Trucking Associations (2001), the U.S. Supreme Court held that the EPA must set NAAQS levels on public health grounds alone, with costs considered only at the implementation stage. The gap between the WHO and EPA numbers is therefore not a case of the U.S. choosing affordability over health.
The difference is which question each one answers. WHO asks where the evidence stops showing harm. The EPA has to find a level that protects public health with an adequate margin of safety and then survives challenge in federal court. The second question reliably produces a higher number. That is the distinction we think homeowners are rarely given, and it is the whole reason a county can pass and a house can still be dusty.
Nobody writes in asking what the WHO guideline is. They write in asking why their county passed and their house is still dusty. Those are two different tests. The federal number tells you whether your county cleared a legal bar. It was never built to tell you what is coming through your return vent.
— Michelle Wan, Brand Manager and Air Quality Writer, Filterbuy
Are U.S. Air Quality Standards Changing In 2026?
The EPA’s 9.0 µg/m³ annual PM2.5 standard is in force and was upheld in court in mid-2026. The EPA announced in March 2025 that it would reconsider the 2024 rule that lowered the standard from 12.0 µg/m³, and in November 2025 asked the D.C. Circuit to vacate its own rule. On June 26, 2026, the court rejected those challenges and upheld 9.0 µg/m³. A federal district court then ordered the EPA on July 17, 2026 to complete overdue attainment designations by February 6, 2027, per the Harvard EELP regulatory tracker.
For a homeowner the point is practical rather than political. The U.S. number has been fought over for two years, while the science behind the WHO guideline has not moved.
What The Gap Means Where You Actually Live
The national average lands between the two thresholds. In 2025 the United States recorded an annual average PM2.5 concentration of 7.3 µg/m³ in 2025, up from 7.1 the year before, according to IQAir’s 2025 World Air Quality Report. That is 19 percent below the EPA limit and 46 percent above the WHO guideline. Our global air quality rankings by country break the same dataset down further.
National averages also smooth over the worst days. The American Lung Association’s State of the Air 2026 found that 152.3 million Americans, 44 percent of the population, live in counties with failing grades for ground-level ozone or particle pollution, and that nearly half of U.S. children live in a county with at least one failing grade. Six California metros land on all three worst-air-quality lists.
The most useful move is to stop thinking in national averages and check your own address. See real-time air quality in your area on the Filterbuy live AQI map, then compare your reading against both thresholds, not just the EPA one.
What “Good” On Your Air Quality App Actually Means
Almost nobody checks their air in micrograms. They check a color, and the same gap is buried inside that scale. The EPA sets the top of the Good range, AQI 50, at 9.0 µg/m³ over 24 hours, the same figure as its annual standard. WHO’s annual guideline is 5. A day your app calls Good can carry nearly twice the PM2.5 WHO treats as healthy long term. If the math behind the color is unfamiliar, how the AQI is calculated walks through the formula.
A single such day is not the problem, since WHO’s 24-hour guideline is 15 µg/m³ and one Good day sits comfortably under it. A year of them is a different matter. Days hovering near the top of Good average out far above the WHO annual line, and the long-term average is what the mortality research tracks.
Green does not mean clean. It means below the U.S. line.
Neither Standard Applies Inside Your Home
Here is the part most comparisons of the two standards leave out: the WHO guidelines and the EPA NAAQS both regulate ambient outdoor air only. There is no enforceable federal PM2.5 limit for the air inside a private residence. No agency measures it, and no one issues your house a grade.
That gap matters because outdoor particles do not stay outdoors. The EPA lists outdoor air pollution among the sources of indoor air problems and describes infiltration, outdoor air flowing in through joints, cracks, and gaps around windows and doors, as a main route air takes into a building. A running HVAC system pulls it in more directly. When outdoor PM2.5 climbs during wildfire season or an inversion, indoor levels tend to follow within hours.
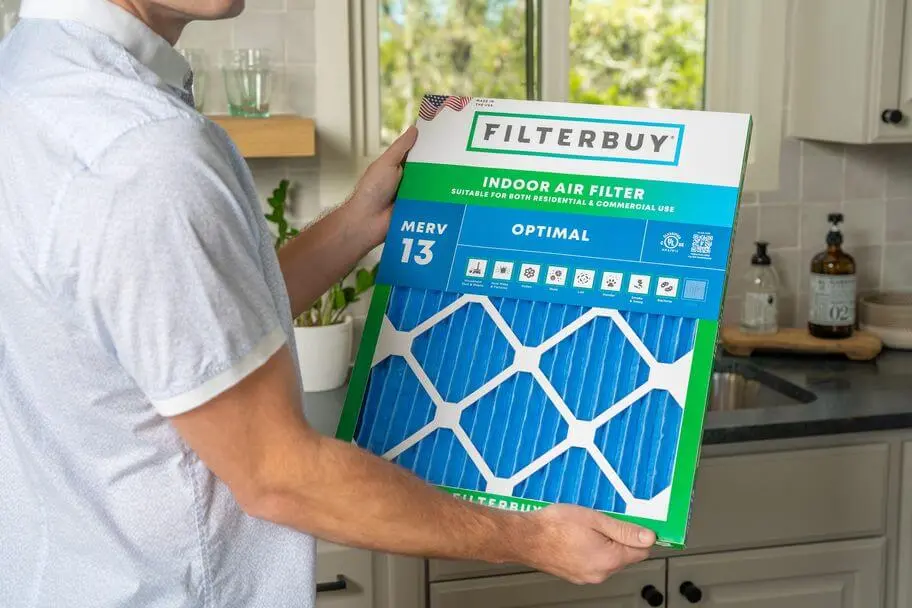
The one number in this comparison you can genuinely control is the one inside your walls. A pleated Filterbuy MERV 13 filter captures a meaningful share of particles in the PM2.5 size range as air cycles through your system. That is why it is the usual recommendation for wildfire-prone regions and for households managing asthma or allergies. Our MERV rating chart compares MERV 8, 11, and 13.
After manufacturing filters in Talladega for over a decade and serving more than two million households, I have stopped reading the outdoor number as a verdict. It is a trigger. The standard decides what is legal outside your walls. What you put in the filter slot decides what is acceptable inside them, and that is the only one of the two you control.
— David Heacock, Founder and CEO, Filterbuy
Supporting Statistics
Three findings that show why the gap matters at your address.
1. EPA projects 99% of U.S. counties will meet the 9.0 µg/m³ standard by 2032.
Passing the federal test is the norm, not an achievement.
So “meets EPA standards” says little about WHO-level air quality.
Source: EPA news release on the final soot standard, February 7, 2024.
2. 75.9 million Americans still fail that standard, across 84 counties in 21 states.
That counts only failures against the more permissive U.S. line.
Measured against WHO’s 5 µg/m³ guideline, the number climbs sharply.
Source: American Lung Association, year-round particle pollution trends, “State of the Air” 2026.
3. Across 60.9 million Medicare beneficiaries, the mortality signal ran stronger below the federal limit than above it.
Below 12 µg/m³, the standard then in force: each additional 10 µg/m³ tracked a 13.6% rise in all-cause mortality.
Across the full exposure range: 7.3%.
Harm does not stop at the regulatory line.
Source: Di et al., Air Pollution and Mortality in the Medicare Population, New England Journal of Medicine, 2017, via PubMed Central.
Frequently Asked Questions
Is the WHO air quality standard stricter than the EPA’s?
Yes. WHO’s 2021 guideline for annual PM2.5 is 5 µg/m³ against the EPA’s 9.0 µg/m³, and WHO’s guidelines are stricter for PM10, ozone, and nitrogen dioxide as well. The largest gap is nitrogen dioxide, where the EPA’s annual limit is roughly ten times the WHO guideline.
What is the WHO PM2.5 standard?
The WHO recommends annual average PM2.5 stay at or below 5 µg/m³ and 24-hour PM2.5 at or below 15 µg/m³. Both figures were set in September 2021, replacing 2005 guidelines of 10 and 25 µg/m³.
Are WHO air quality guidelines legally binding?
No. WHO guidelines are recommendations. Individual countries decide whether and how to adopt them into national law, and no penalties attach to exceeding them.
Does meeting EPA standards mean the air is safe?
It means the air is legally compliant. Because the WHO guideline is stricter, many U.S. counties meet the EPA standard while sitting above the level WHO associates with health effects.
Do air filters help with outdoor air pollution?
An HVAC filter can’t change outdoor air, but it reduces the fine particles that follow it indoors. A MERV 13 pleated filter captures a meaningful share of PM2.5-sized particles. No HVAC filter removes ozone or carbon monoxide.
Your Next Step
You cannot set national air quality policy, but you can set the standard inside your own house, and that one can be stricter than either the WHO’s or the EPA’s.
Check the air quality index for your ZIP code → find your filter size → set up auto-delivery so a clean filter shows up before you’d have thought about it.
Filterbuy has built pleated air filters in the U.S. for over a decade: 600+ standard sizes plus custom cuts, shipped factory-direct. Better Air For All.™