
U.S. City Air Pollution Statistics: Filterbuy's Annual Air Quality Report
August 4, 2026
Written by Michelle Wan, Brand Manager and Air Quality Writer at Filterbuy. Reviewed by David Clark, Licensed HVAC Technician. Published August 4, 2026. Updated August 4, 2026.
U.S. City Air Pollution Statistics: What Your City's Numbers Mean
No single statistic describes a city's air. Three separate measures do, and a city can look clean on one while failing another.
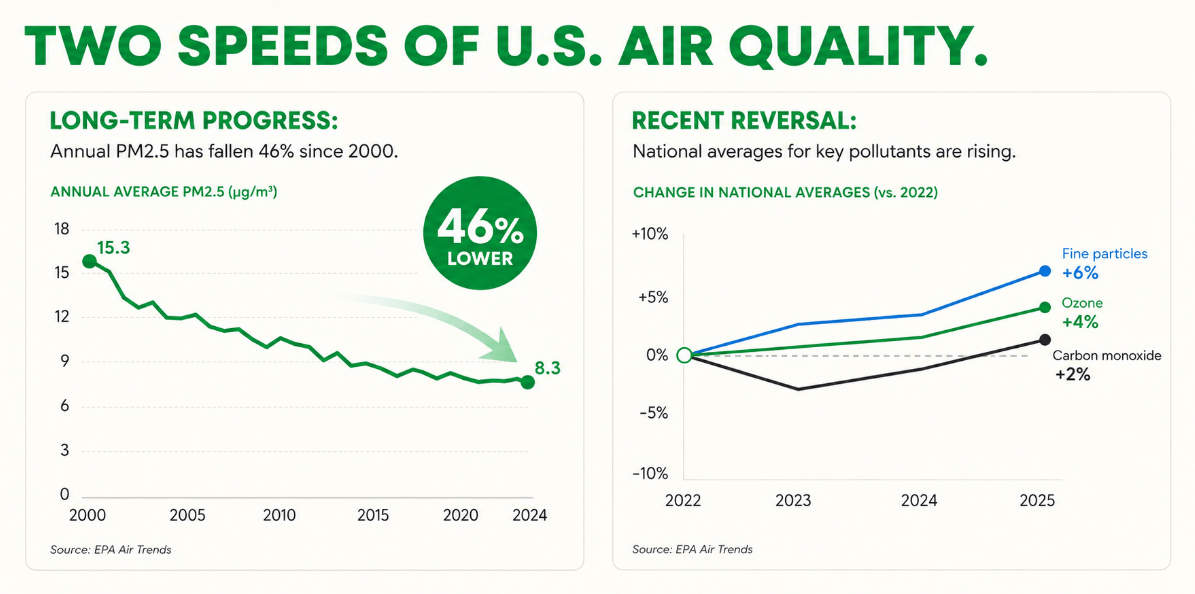
Nationally, EPA monitors show fine particles down 46 percent since 2000, while carbon monoxide, ozone, and fine particle levels have all climbed again since 2022. The number that matters at your address is local, not national.
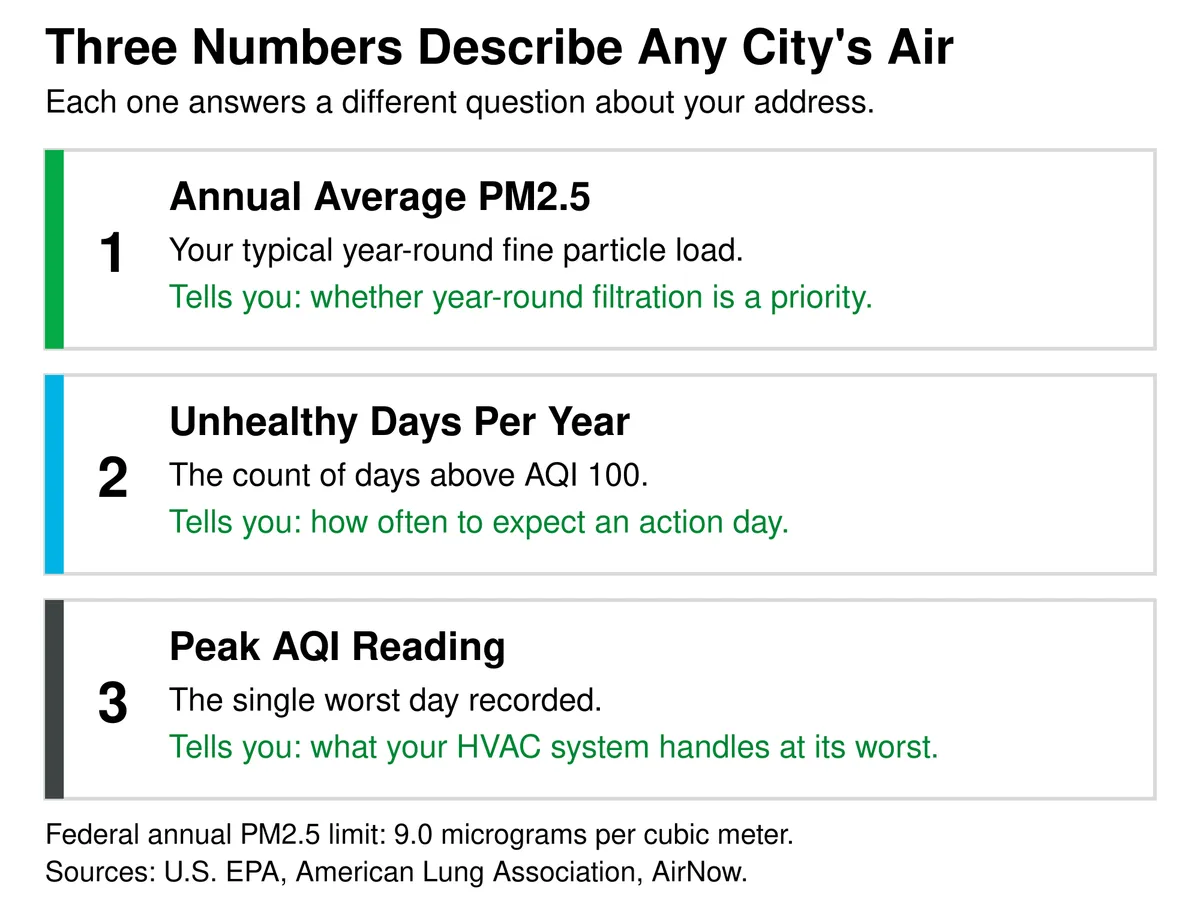
Annual average PM2.5 is your year-round fine particle load, measured against a federal limit of 9.0 micrograms per cubic meter.
Unhealthy days per year counts the days your metro area spends above AQI 100.
Peak AQI reading is the single worst day your HVAC system had to handle.
Your annual average points to the filter to buy, and today's AQI points to when to change it. The quiz below matches you to the rating and size your system takes.
Answer a few quick questions and we'll match you to your filter.
U.S. City Air Pollution Statistics At A Glance
Filterbuy, an American air filter manufacturer, compiles this annual report from the two national datasets that define U.S. city air pollution statistics. The EPA's Our Nation's Air tracks measured concentrations at monitors nationwide, with annual fine particle levels down 46 percent since 2000 and ozone down 24 percent since 1990. The American Lung Association's State of the Air 2026 grades counties instead, placing 152.3 million Americans, 44 percent of the population, in a failing county.
TL;DR
U.S. city air pollution statistics point two directions at once. Long-run EPA monitoring shows steep declines in every regulated pollutant since 1990, while recent readings show carbon monoxide, ozone, and fine particles rising again since 2022 on wildfire smoke, drought, and heat. Filterbuy's read for households is that the numbers that matter are the local annual PM2.5 average and the count of unhealthy days, not a national headline.
Key Takeaways
EPA monitors show annual fine particle concentrations down 46 percent between 2000 and 2024, and ozone down 24 percent since 1990.
Three pollutants reversed course after 2022. Carbon monoxide, ground-level ozone, and fine particle averages all climbed, which the EPA attributes in part to wildfires, drought, and weather.
The American Lung Association counts 152.3 million Americans, including 33.5 million children, in a county that failed at least one air pollution measure in 2026.
Only one metro area, Bangor, Maine, ranked on all three of the association's cleanest cities lists in 2026, down from two the year before.
The federal annual PM2.5 limit is 9.0 micrograms per cubic meter, upheld by the D.C. Circuit on June 26, 2026, and the EPA has not yet issued the required nonattainment designations.
Under the Clean Air Act's exceptional events rule, states can ask the EPA to exclude wildfire and dust days from compliance determinations, so a city's regulatory figure can read cleaner than the air residents breathed.
Our Perspective At Filterbuy
Our vantage is narrow and worth stating plainly. We do not run air monitors and we did not collect the readings below. We manufacture pleated filters at our plant in Talladega, Alabama, ship them to households in every metro area named here, and hear back when the air turns. So we read the same public EPA and American Lung Association data anyone can download, then keep going into the question those datasets never answer: what an annual city average means for the filter in your system.
What The National Air Pollution Numbers Show In 2026
Every regulated outdoor pollutant is measurably cleaner than a generation ago. The EPA measures each against the year its modern record begins, and the direction holds across all seven below.
Source: U.S. EPA, Our Nation's Air, AirTrends summary, status and trends through 2024.
Emissions tell the same story. Combined emissions of the six common pollutants fell 79 percent between 1970 and 2024, while population, vehicle miles, and energy use all grew.
Why City Air Quality Worsened While National Emissions Fell
Long-term declines and recent increases are both true, and they come from different sources. Regulated emissions from vehicles, power plants, and industry keep falling under Clean Air Act programs. Wildfire emissions are not regulated and do not.
The EPA has documented a reversal in three criteria pollutants over the last few reporting years. Carbon monoxide, ozone, and fine particle concentrations all climbed after 2022, driven in part by wildfire smoke, drought, and weather. The National Interagency Fire Center recorded 77,850 wildfires burning 5.1 million acres in 2025, and that smoke does not stop at a state line. The Filterbuy guide to wildfire smoke and the AQI covers what those events do to a daily reading.
The American Lung Association's 2026 report shows the same split. Fine particle levels improved across most of the country while ozone worsened in much of it, hitting several southwestern states hardest. The clearest signal sits on the clean end of the scale. Bangor, Maine, is now the only metro area on all three of the association's cleanest cities lists, down from two a year earlier.
Los Angeles has held the worst ozone ranking in 26 of the report's 27 editions. For the full metro rankings, see our breakdown of the worst air quality cities in the U.S.
The Three Numbers That Describe Any City's Air
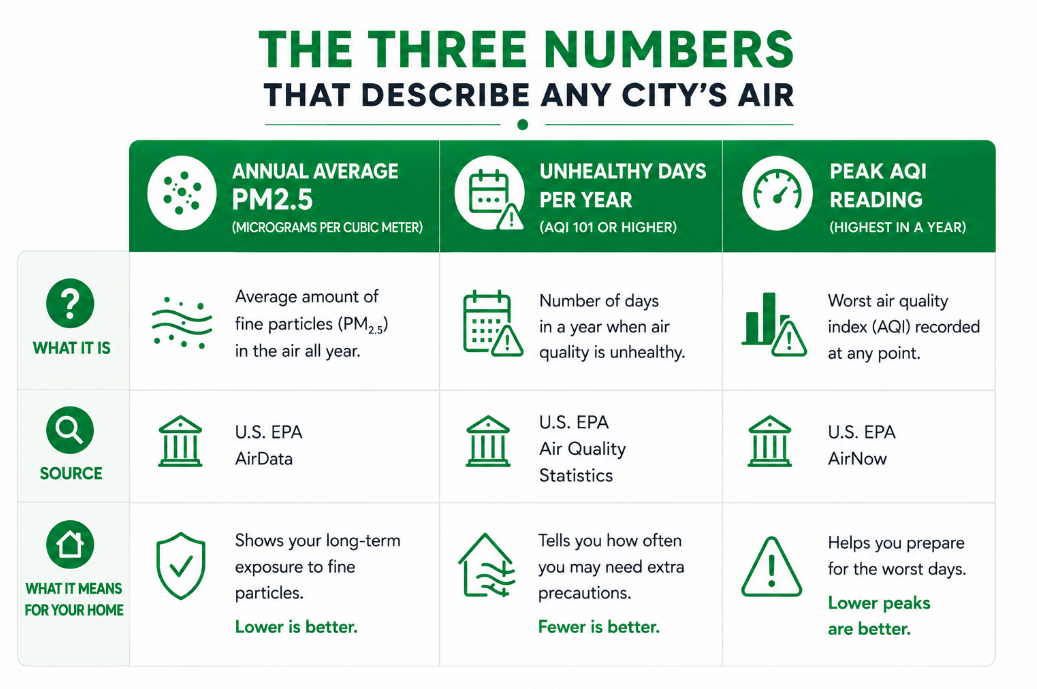
We built the table below because the same confusion keeps surfacing in the questions we field. People ask for their city's air quality number, and no such number exists. Three separate measures describe a city's air, each answering a different household question, and a city can look clean on one while failing another. Start with what counts as a good AQI.
Source: U.S. EPA, Air Quality Statistics by City, and American Lung Association, State of the Air 2026. Framework developed by Filterbuy.
Bakersfield-Delano, California, shows the gap. It has ranked worst for year-round particle pollution seven years running while sitting third for short-term spikes. A city high on the annual measure carries a constant load. A city high only on the spike measure gets episodes that clear.
How To Find Your Own City's Three Numbers
Allow five minutes. The sequence works for any U.S. metro area with a monitor.
Open the EPA's Air Quality Statistics by City workbook, linked above, and find your metro area's annual PM2.5 design value. Compare it against the 9.0 microgram limit.
Pull your metro area's American Lung Association report card using the association's Compare Your Air tool for the count of unhealthy ozone and particle days and the letter grades behind them.
Check AirNow for today's reading and the pollutant driving it.
The first two lookups describe the year you live in. The third describes the afternoon you are standing in. Confuse them and you will buy the wrong filter, or change the right one on the wrong schedule.
The thing I keep running into writing this beat is that city pollution rankings quietly mix measures. A page will set a live AirNow reading beside a three-year design value and present both as a ranking. Those answer completely different questions. If you take one habit from this report, take the habit of checking which number is in front of you before you compare two cities.
— Michelle Wan, Brand Manager and Air Quality Writer, Filterbuy
What The Official Statistics Leave Out
Three rules shape what a city's official numbers include, and no ranking page mentions them.
Wildfire and dust days can come out of the record. Under the Clean Air Act's exceptional events rule, a state may ask the EPA to exclude monitor readings caused by wildfires, high-wind dust, or similar events from compliance determinations. The EPA explains what qualifies as an exceptional event and how the process works. The readings stay in the database. They can still come out of the figure that decides whether a city meets the standard, which means a metro area's regulatory number can read cleaner than the air its residents actually breathed.
Cities without a monitor never appear at all. The rankings cover metro areas with qualifying monitoring data. A city with no monitor in range is simply absent, clean or not.
Every annual figure runs three years behind. The 2026 report covers 2022 through 2024, so a severe 2025 or 2026 smoke season will not surface until a later edition.
None of this makes the official statistics wrong. It makes them a floor rather than a full account of what a household breathed.
Where The Federal PM2.5 Standard Stands Right Now
The federal annual limit for fine particles is 9.0 micrograms per cubic meter. The EPA set that level in February 2024, lowering it from 12.0, and retained the 24-hour limit at 35 micrograms per cubic meter under its particulate matter air quality standards. We break down what the tighter EPA standard means for your home separately.
That standard survived a legal challenge. On June 26, 2026, the U.S. Court of Appeals for the D.C. Circuit upheld the 2024 rule, rejecting a request from the EPA itself to vacate it. The Clean Air Act required the agency to name which areas violate the standard by February 6, 2026. The agency missed that deadline, so no official list of failing areas exists yet.
What A City Average Means For The Air Inside Your House
Outdoor fine particles move indoors. The EPA notes in its particulate matter basics that the largest fine particle is roughly 30 times smaller than a human hair, small enough to ride the air entering a home through gaps, doors, and ventilation. The HVAC filter is the only stage between that air and your lungs, which is the part we watch. To place your own address on the scale, look up the AQI for your ZIP code.
Three points follow. Learn what PM2.5 is and how it differs from ground-level ozone health effects, because a filter addresses particles and not ozone. Check live AQI and wildfire smoke maps rather than an annual figure, which says nothing about today. Confirm which MERV rating your system can handle before upgrading, because a filter the blower cannot pull air through protects nothing.
ASHRAE recommends MERV 13 where a system supports it. Filterbuy manufactures MERV 13 air filters in more than 600 sizes, and you can shop air filters by size to find the one your system takes.
After manufacturing filters for over a decade and serving more than two million households, I can tell you the annual number is not what people feel. What they feel is the week the smoke arrives and the filter they installed in April is already gray. Read your city's annual average to decide what filter to buy, and read today's AQI to decide when to change it.
— David Heacock, Founder and CEO, Filterbuy
Pro Tip
During an extended smoke or smog season, we advise replacing filters every 30 to 45 days rather than the standard 60 to 90. Our guide on how often to change your air filter when AQI is high sets the cadence by event length. A loaded filter stops working once air no longer passes through it.
Essential Resources For U.S. City Air Pollution Data
1. Get The Annual County Grades And City Rankings
The American Lung Association's key findings page carries the population counts, grades, and methodology behind every figure quoted here.
Source: American Lung Association, State of the Air 2026 Key Findings
2. Track National Concentration And Emission Trends
The EPA charts measured concentrations and emissions for all six criteria pollutants back to 1990.
Source: U.S. EPA, Our Nation's Air: Status And Trends Through 2024
3. Learn How The AQI Scale Actually Works
AirNow explains the 0 to 500 scale, the color categories, and which pollutant drives a reading.
Source: AirNow, Air Quality Index Basics
4. Understand What Each Pollutant Does To The Body
The CDC lists the health conditions that ozone and particle pollution worsen.
Source: CDC, Air Pollutants
5. Check Wildfire Activity Driving Particle Spikes
The National Interagency Fire Center publishes current and annual wildfire counts and acreage, the activity behind most particle spikes.
Source: National Interagency Fire Center, Statistics
6. Get Tomorrow's Ozone And Smoke Forecast
The National Weather Service explains how NOAA and the EPA produce the ozone, smoke, and dust forecasts local agencies issue.
Source: National Weather Service, Air Quality Forecast Partnership
Supporting Statistics
1. 88 Percent Of U.S. Households Use Air-Conditioning
Two-thirds cool with central air-conditioning or a central heat pump, so most homes already have the ducted system a filter depends on.
Source: U.S. Energy Information Administration, Residential Energy Consumption Survey
2. About 28 Million Americans Live With Asthma
Ozone and fine particles are documented asthma triggers, putting this group first in line for risk in high-pollution metros.
Source: Asthma And Allergy Foundation Of America, Asthma Facts
3. Short-Term Particle Exposure Can Trigger Cardiac Events
The American Heart Association links brief spikes in fine particle exposure to heart attack, stroke, and arrhythmia, with risk highest among older adults.
Source: American Heart Association, Air Pollution, Heart Disease And Stroke
Frequently Asked Questions
What Is The Average Air Pollution Level In U.S. Cities?
The EPA publishes no single national city average. It reports annual fine particle design values city by city against a federal limit of 9.0 micrograms per cubic meter. California's Central Valley and the Texas border post the highest values. Montana, Wyoming, and Maine post the lowest.
Is Air Quality In The United States Getting Better Or Worse?
Both, depending on the window. Measured against 1990, every regulated pollutant is down sharply, with fine particles off 46 percent since 2000. Measured against 2022, ozone, fine particles, and carbon monoxide have all moved the other way, which the EPA ties to wildfire smoke and weather.
Why Do EPA And American Lung Association Numbers Disagree?
They measure different things from the same monitors. The EPA reports raw concentrations and long-term trends. The American Lung Association turns three years of that data into letter grades and metro rankings. That is how the association can name a failing city the EPA has not designated.
Does A Higher-MERV Furnace Filter Reduce Indoor Fine Particles?
A higher-MERV filter captures a larger share of the fine particles moving through an HVAC system, so a clean, correctly rated Filterbuy filter lowers what circulates indoors. It does not remove ozone, and it works only while the blower runs.
Glossary
AQI: The Air Quality Index, the EPA's 0 to 500 scale for daily outdoor air pollution and its health risk. Readings above 100 are unhealthy, first for sensitive groups, then for everyone.
PM2.5: Fine particulate matter 2.5 micrometers or smaller, able to reach deep lung tissue and the bloodstream. Sources include vehicle exhaust, combustion, and wildfire smoke.
Ozone: Ground-level ozone, formed when sunlight reacts with vehicle and industrial emissions. It irritates lung tissue and is not captured by a mechanical filter.
NAAQS: National Ambient Air Quality Standards, the health-based federal limits the Clean Air Act requires for six outdoor pollutants.
Design Value: The statistic the EPA calculates from three years of monitoring data to judge whether an area meets a standard.
Nonattainment: The EPA's designation for an area whose design value exceeds a national standard, triggering state cleanup obligations.
Exceptional Event: An unusual or natural event, such as a wildfire or high-wind dust storm, whose monitor readings a state may ask the EPA to exclude from compliance determinations.
MERV: Minimum Efficiency Reporting Value, the ASHRAE 1 to 16 scale for how well an HVAC filter captures particles. Higher means finer filtration.