
Cincinnati Real-Time AQI Tracker


Get Alerts For Unhealthy AQI In Your Area
When air quality in your area reaches unhealthy levels, we'll send you a quick alert, along with expert tips on how to reduce your exposure.
What's Actually In Cincinnati Air Today?
What High AQI Means for Your Lungs in Cincinnati
How to Read AQI
The Air Quality Index (AQI) measures how polluted the air is and how it may affect your health.
0–50 (Good): Air quality is satisfactory.
51–100 (Moderate): Acceptable, but some pollutants may pose minor concerns.
101–150 (Unhealthy for Sensitive Groups)
151–200 (Unhealthy)
201–300 (Very Unhealthy)
301+ (Hazardous)
Moderate
Still okay for most, but if you have asthma or allergies, take it easy and avoid long outdoor workouts.
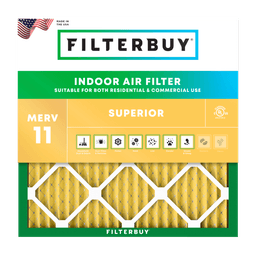
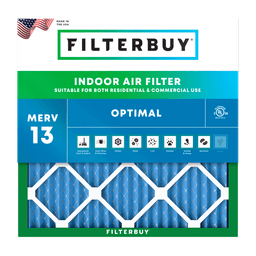
Shop MERV 11 filters→What's the Right Filter for Your AQI Level?



Check Today's Live Real Time Air Quality Index AQI Map in Cincinnati, OH Now
TL;DR
The Filterbuy AQI map above shows Cincinnati's current air quality, drawn from EPA-monitored stations and refreshed through the day. Under 50 is Good; above 100, sensitive groups should scale back. Fine particulate and summer ozone drive most swings, and the river valley traps both. Whatever it says outside, filtration decides what you breathe.
Author's Note
I pull AQI numbers for U.S. cities most mornings, and Cincinnati's took two passes. The region's planning agency has ozone and fine particulate falling several times faster than the national pace, while the American Lung Association still grades Hamilton County an F. Neither is wrong. One measures the trend, the other the days. You breathe the days.
Michelle Wan, Brand Manager & Air Quality Writer, Filterbuy
How to Read Cincinnati's Live AQI Map
Start with the map above. It draws from EPA-monitored stations across Hamilton County and Northern Kentucky, color-coded to the six AQI categories, so the color answers your question before the number does. It also names the pollutant driving the reading, and ozone and fine particulate call for opposite responses indoors.
Key Takeaways
The Mill Creek valley floor and the eastern ridge do not breathe the same air.
Fine particulate (PM2.5) and ground-level ozone set nearly every elevated reading.
In State of the Air 2026, Hamilton County earned an F for ozone and a failing particle grade. Campbell County, Kentucky, passed.
EPA recommends MERV 13 during smoke events, or the highest rating your system supports.
What Each AQI Band Asks You to Do
The U.S. AQI runs 0 to 500 across six categories. Match the color on the map to a row below.
Per EPA AirNow guidance.
Why the Map May Not Match What You Smell on Your Street
Two things cause that gap in Cincinnati. First, timing: EPA reports current AQI as a NowCast, averaging up to 12 previous hours, so during a plume it trails your eyes and nose.
Second, the distance between monitors. On that point Cincinnati has unusually good evidence. A 2026 study in Science of the Total Environment put 12 low-cost monitors across Lower Price Hill and compared them with nearby EPA sites. Eleven read higher, and the neighborhood logged up to six days above AQI 50 the regulatory monitor never saw.
A valley-floor block beside I-75 can run a category worse than the citywide number, so trust the map for the region and your lungs for your porch.
Is Cincinnati's Air Safe to Breathe Today?
It depends on what the live map shows. Below 50 the air is good for everyone. Above 100, people with asthma, COPD or heart disease, plus children and over-65s, should cut outdoor time. Above 150, everyone scales back.
Who Forecasts Cincinnati's Air, and where to Get the Warning First
The Southwest Ohio Air Quality Agency, part of the Hamilton County Department of Environmental Services, forecasts for five southwest Ohio counties and issues the region's alerts. Its recorded AQI line is 513-946-7753. EPA's AirNow handles next-day forecasts, and its free EnviroFlash service warns you before conditions shift.
The pattern is reliable enough to plan around. Ozone builds on hot, stagnant afternoons from May through September. Fine particulate collects overnight and through morning rush hour, then lingers when an inversion caps the valley. Smoke follows neither and can spike in hours.
Cincinnati Air Quality by Neighborhood and ZIP Code
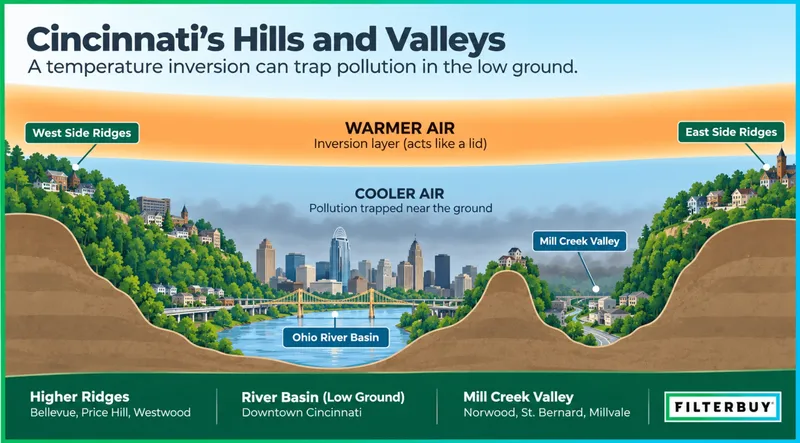
Terrain explains most of Cincinnati's variation. Cincinnati sits on hillsides above a river basin. Traffic emissions and stagnant air settle on the low ground, along the river corridor and up the Mill Creek valley. Ridges ventilate better.
Cincinnati is measuring it. Under the Cincy Air Watch Project, the Health Department has deployed dozens of neighborhood monitors, after health mapping flagged the Mill Creek Valley and the I-75 corridor.
What's Actually in Cincinnati's Air
The AQI reports whichever pollutant scores highest, and here that is nearly always fine particulate or ozone.
Ozone is a summer problem, formed when sunlight cooks vehicle and industrial emissions. The region has a long history with it: EPA only redesignated the Ohio counties to attainment for the 2015 ozone standard in June 2022, and the Kentucky side went to moderate nonattainment months later.
PM2.5 is the year-round problem, from diesel traffic, combustion, upwind power generation and, increasingly, smoke. University of Cincinnati researchers have tracked the traffic piece for two decades through the Cincinnati Childhood Allergy and Air Pollution Study, a birth cohort built around the city's truck routes.
The difference matters once you close the door. Ozone breaks down indoors, so shutting the windows solves it. Fine particulate drifts in around window frames and hangs for hours. Removing it takes filtration. That is where your MERV rating stops being a spec-sheet number.
What the AQI Leaves Out
The AQI covers five pollutants. Pollen and mold are not among them, though the Southwest Ohio Air Quality Agency monitors both for this region.
A green map on an April morning, with oak and grass running, can be accurate and still say nothing about why your eyes are streaming. The same holds in a wet spring, when mold climbs and the index does not.
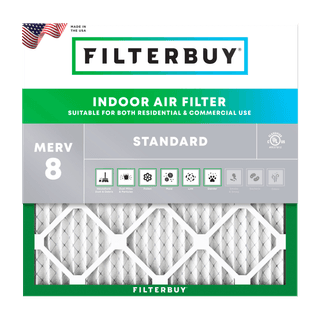
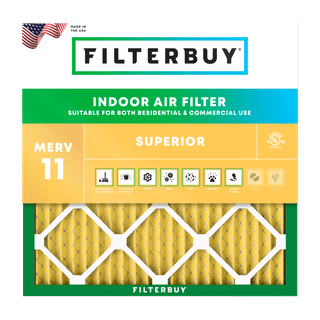
Check pollen separately before deciding the map is wrong. Indoors, MERV 8 handles most pollen grains, but mold spores are finer, which is where Filterbuy MERV 11 earns its place.
How Cincinnati Compares to Other U.S. Metros
State of the Air 2026 ranked the Cincinnati metro 31st worst nationally for short-term particle pollution and among the 25 worst year-round. Compare our Dayton, Columbus and Ohio air quality maps.
Canadian Wildfire Smoke over the Ohio Valley
Smoke is part of a normal Cincinnati summer now. On July 17, 2026, the Southwest Ohio Air Quality Agency issued a regional advisory across Ohio, Kentucky and Indiana as Canadian smoke arrived. Cincinnati landed in Unhealthy for Sensitive Groups while Cleveland hit Hazardous. In June 2023, readings here reached the 180s.
One local quirk worth planning around: the valley holds smoke after the rest of Ohio clears. Cleveland and Columbus can be improving while Cincinnati is still at its worst, two or three days behind. Don't stand down because the statewide news did.
When smoke arrives, the order Filterbuy works through:
Close windows and doors until the plume clears.
Switch the HVAC to recirculate; run the fan continuously.
Run MERV 13, or the highest your system supports.
Add activated carbon if smoke smell gets through, plus bedroom HEPA.
Skip the outdoor workout, since hard breathing pulls particulate deeper.
Filterbuy doesn't make portable air purifiers. On a heavy smoke day a bedroom HEPA unit alongside whole-home filtration is the right answer, and we'd rather say so. Track plumes on our live Ohio smoke map.
What a Cincinnati Air Quality Alert Actually Changes
An alert covers Butler, Clermont, Hamilton and Warren counties in Ohio, Boone, Campbell and Kenton in Kentucky, and Dearborn County, Indiana. Treat it as notice the day will be hard on kids, older adults and anyone with asthma or COPD.
No Central HVAC? What Actually Helps
Plenty of Cincinnati housing predates central air: basin row houses, Over-the-Rhine walk-ups and older Northern Kentucky apartments running on radiators with window units. No ducts, no filter slot, so every MERV recommendation here is useless to you. Filterbuy would rather say that than sell you a filter that won't fit. What helps:
A portable HEPA air cleaner sized to your bedroom, the best money a ductless home can spend.
Keep windows shut during smoke, and set a window AC to recirculate if it can.
Do not seal yourself into a hot apartment. EPA warns that closing up without cooling is dangerous in heat, and Hamilton County opens cooling centers.
Our Take: How Filterbuy Reads Hamilton County's Report Card
Most air quality pages stop at the outdoor number. Filterbuy builds the filters that decide what happens next, so we read the data differently.
Air quality changes at the county line, not the city line. Hamilton County failed year-round particle pollution and earned an F for ozone. Campbell County, Kentucky, minutes across the river, passed with a C. Kenton County had no data at all. Same airshed, three answers, one of them silence.
The valley is the variable. Cold air drains into the basin and sits under a warm lid, over the same ground that carries I-75 and the rail yards. Elevation is part of your exposure here.
Filtration is preparation. A filter ordered the morning the sky turns yellow arrives late.
We’ve built filters in Talladega, Alabama for more than a decade. On the afternoon a smoke plume settles into the valley, the filter protecting your kids is the one that was already in the furnace that morning.
David Heacock, Founder & CEO, Filterbuy
Which Filter Your Cincinnati AQI Level Calls For
EPA recommends MERV 13 during smoke events, or the highest rating your system supports.
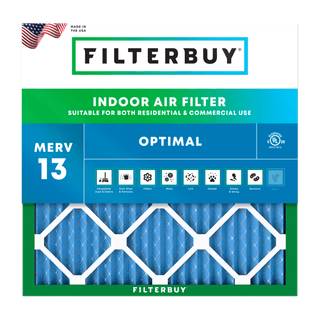
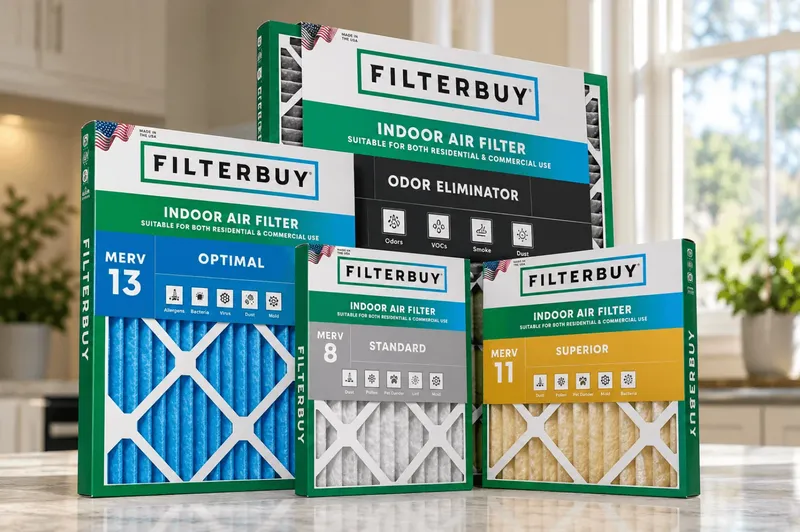
Shop Filterbuy MERV 8, MERV 11 or MERV 13, add the Odor Eliminator carbon filter for smoke odor, or set up auto-delivery.
Before you jump to MERV 13, check the filter slot depth and the age of the blower. A one-inch MERV 13 in a system built for fiberglass raises static pressure. Most homes are fine. Check first.
David Clark, Licensed HVAC Technician
Supporting Statistics
1. Traffic pollution at birth more than doubles the odds of persistent wheezing.
University of Cincinnati researchers followed local children to age seven.
High exposure at birth: 2.31 times the odds (95% CI 1.28–4.15).
Why it matters: the I-75 corridor, measured in local children.
2. Greater Cincinnati is cleaning up faster than the country.
Ozone across the OKI region: down 12.5%, 2010–2023.
Fine particulate: down 33.1%. The national figures were 1.3% and 14.8%.
Why it matters: the progress is real, the bad days still come.
3. A high-efficiency filter cuts indoor PM2.5 by about half.
Roughly 50% with the fan running continuously.
About 24% with a low-efficiency filter.
Why it matters: Auto to On costs nothing.
Frequently Asked Questions
Glossary
AQI (Air Quality Index): EPA's 0-to-500 scale, six categories, Good (0–50) to Hazardous (301+).
PM2.5: Fine particulate 2.5 micrometers or smaller. It usually sets Cincinnati's AQI and is what high-MERV filters catch.
NowCast: The EPA algorithm behind the current reading. It averages up to 12 hours and weights the most recent ones.
Temperature inversion: Warm air sitting above cooler air, trapping pollution near the ground. Common over the river valley on calm nights.