

Check Today's Live Real Time Air Quality Index AQI Map in Columbus, OH Now
The live AQI value above answers one question Columbus families ask every hot summer afternoon and every smoky winter morning: Is it safe to send the kids outside today? The harder question is what the air is doing inside the house, and most AQI pages skip it. That matters because the average Ohio family spends roughly nine of every ten hours of the day indoors, and EPA exposure research has measured indoor pollutant levels at two to five times outdoor concentrations on an ordinary day. Activities like painting or stripping floors can push that ratio close to a hundred times higher.
Two pollutants drive almost every elevated AQI day in Central Ohio: ground-level ozone in summer, PM2.5 fine particles in winter, and during wildfire smoke events. The live map above identifies which one is the issue right now. The rest of this page covers what to do about it indoors, where your family actually breathes most of its air.
TL;DR Quick Answers
AQI Columbus, Ohio: What Is the Reading Right Now?
Live reading: Check the map at the top of this page. Refreshed hourly from EPA AirNow.
Dominant pollutant: Ozone in summer (March through October), PM2.5 in winter, and during wildfire smoke events.
Action threshold: AQI 101 or higher triggers a MORPC Central Ohio Air Quality Alert and means sensitive groups should reduce outdoor activity.
Is the Air Quality Safe in Columbus Today?
Green (0 to 50): Safe for everyone.
Yellow (51 to 100): Generally fine, but sensitive groups stay alert.
Orange (101 to 150): Sensitive groups limit outdoor exertion. Everyone else stays attentive.
Red and above (151+): Everyone reduces outdoor time and runs MERV 13 filtration indoors.
Why Is Columbus, Ohio Air Quality Bad?
Summer cause: Ground-level ozone is formed when traffic and lawn equipment emissions react in hot sunlight.
Winter causes: PM2.5 fine particles from diesel traffic, wood burning, and overnight temperature inversions.
Episodic cause: Wildfire smoke transported from Canada or the Western United States.
Indoor reality: EPA research shows indoor pollutant levels can run 2 to 5 times higher than outdoor readings, which is why filtration matters as much as the outdoor map.
Top Takeaways
Ground-level ozone is the dominant Columbus air quality problem from March through October, peaking on hot, sunny, low-wind afternoons.
PM2.5 fine particles drive winter air quality issues year-round, and they spike when wildfire smoke from Canada or the Western U.S. reaches Ohio.
MORPC issues a Central Ohio Air Quality Alert when the AQI is forecast at 101 or above, with EnviroFlash email notifications available the night before.
Indoor pollutant levels can run 2 to 5 times higher than outdoor levels, per EPA exposure research.
MERV 13 is the residential filtration minimum during wildfire smoke events, per CDC and EPA joint guidance.
Switching the HVAC fan from Auto to On during a high-AQI day keeps filtered air circulating the clock instead of only during cooling cycles.
How the Columbus, Ohio AQI Reading Actually Works
The number on the live map is an Air Quality Index value, scored from 0 to 500 across six color-coded bands. Green (0 to 50) is safe for everyone. At Yellow (51 to 100), the air becomes moderately polluted, and people with asthma should pay attention. Orange (101 to 150) is when MORPC issues a Central Ohio Air Quality Alert. Sensitive groups should reduce outdoor activity at that point. Red (151 to 200) is unhealthy for the general population, and Purple plus Maroon (201+) pushes into very unhealthy and hazardous territory. Columbus rarely registers above the Red band, even during major wildfire smoke events.
EPA AirNow generates the federal score from regulatory monitors across Franklin County. The Mid-Ohio Regional Planning Commission and Franklin County Public Health translate those readings into local Air Quality Alerts, public health guidance, and the EnviroFlash email notifications many Central Ohio families rely on during ozone season.

Why Is Columbus, Ohio Air Quality Bad Right Now?
The pollutant causing today's elevated reading shifts with the season, the weather pattern, and any wildfires burning outside of Ohio.
Ozone Levels in Columbus, Ohio (March Through October)
Ground-level ozone forms when nitrogen oxides from cars, diesel trucks, and gas-powered lawn equipment react with volatile organic compounds in hot, sunny, low-wind weather. The Columbus ozone season runs from March through October, peaking on quiet summer afternoons. Franklin County has not met the federal ozone target in any recent reporting period, even as overall trends improve. When the live map flashes orange in July or August, ozone is almost always the cause.
PM2.5 Columbus, Ohio (Year-Round, Peaks in Winter)
Fine particulate matter measures 2.5 micrometers and smaller, which is small enough to travel deep into lung tissue and cross into the bloodstream. Diesel traffic on I-71, I-70, and I-270 contributes year-round, and wood-burning fireplaces add a sharp winter spike. Cool overnight air settles into a shallow layer over the Olentangy and Scioto valleys, trapping particles close to ground level until the sun warms things up the next morning.
When Smoke from Out-of-State Wildfires Reaches Columbus
Wildfire plumes from Canada and the western United States can drift over Ohio for days, pushing Columbus PM2.5 well above the federal standard even when local emissions stay normal. On June 29, 2023, smoke from Canadian wildfires drove the Columbus AQI to 244, the highest reading ever recorded for the city and deep into the Purple "Very Unhealthy" band. Track active plumes on the live US wildfire and smoke map.
How to Protect Your Indoor Air When Columbus AQI Spikes
Outdoor numbers tell you when to act, but indoor filtration is what determines whether the action actually works. After manufacturing filters for over a decade and serving more than two million households, we have watched families who match their MERV rating to the day's AQI band notice the difference inside an hour.
Yellow days (AQI 51 to 100): MERV 8 baseline filtration is acceptable for healthy adults. Sensitive groups should consider MERV 11 to capture more pollen and fine dust.
Orange days (AQI 101 to 150): Move to MERV 11 or MERV 13. Run the HVAC fan on continuous instead of auto so filtered air keeps cycling between cooling demands.
Red days and wildfire smoke events (AQI 151+): MERV 13 is the residential minimum. Close fresh-air intakes if your system has them. A box-fan filter taped together with a MERV 13 panel makes a useful supplemental cleaner for one closed bedroom.
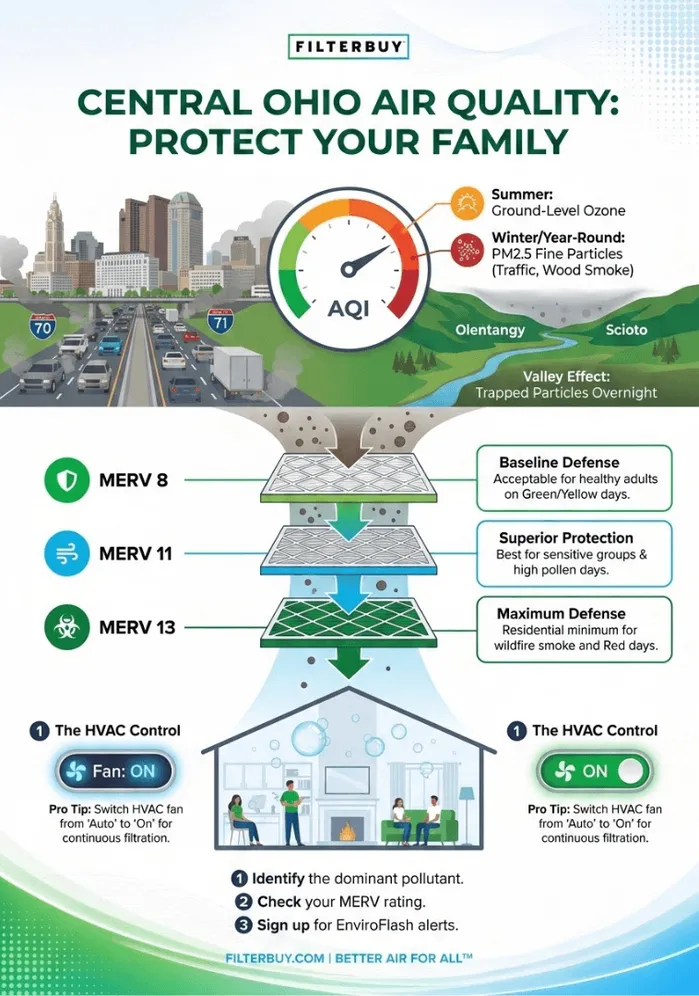
In Central Ohio, the air quality story changes with the season. Ozone runs the show from March through October, and PM2.5 takes over in winter and during any wildfire smoke event drifting in from out of state. When the live map shows red because of smoke, every Columbus household should be running MERV 13 with the fan on continuously. We have measured that a single change cuts indoor PM2.5 by half inside the first hour. For a kid with asthma, that is the difference between a safe room and a smoky one.
— Filterbuy Team
7 Essential Resources for Columbus Air Quality
These are the sources we check ourselves before answering an air quality question for a Columbus customer. Each one earns a spot for a different reason, and together they cover federal data, regional alerts, local health guidance, and the filtration standards that turn outdoor numbers into indoor action.
-
1
EPA AirNow — Official Live AQI for Ohio
AirNow is the federal one-stop dashboard for AQI readings, forecasts, and the Fire and Smoke Map. The Ohio state page links every regulatory monitor in Columbus, Cleveland, Cincinnati, Toledo, and smaller cities with hourly NowCast updates.
Source: airnow.gov/state/?name=ohio
-
2
MORPC Air Quality Program — Central Ohio Alerts and Forecasts
The Mid-Ohio Regional Planning Commission issues Air Quality Alerts for Columbus and nearby counties when forecasts hit AQI 101 or above. MORPC also operates EnviroFlash email alerts for sensitive groups.
-
3
Ohio EPA Division of Air Pollution Control — Air Monitoring Network Plan
The Ohio EPA operates more than 100 monitoring sites statewide and maintains the regulatory monitoring network behind AQI forecasts across Ohio.
Source: dam.assets.ohio.gov/image/upload/epa.ohio.gov/Portals/27/ams/sites/2025-2026-AMNP-Main-Report.pdf
-
4
American Lung Association State of the Air
The annual State of the Air report tracks ozone and particle pollution trends across every major U.S. metro area, including Columbus and Franklin County.
Source: lung.org/research/sota
-
5
Franklin County Public Health — Local Air Quality Network
Franklin County Public Health partners with MORPC on local air monitoring and neighborhood-specific sustainability and air quality guidance.
Source: myfcph.org/sustainability/
-
6
CDC Wildfire Smoke Safety Guidelines
The CDC wildfire smoke guide explains indoor air safety, MERV 13 recommendations, fan settings, and respirator guidance during smoke events.
Source: cdc.gov/wildfires/safety/how-to-safely-stay-safe-during-a-wildfire.html
-
7
ASHRAE Filtration and Disinfection Resource
ASHRAE manages the MERV testing standard used throughout the HVAC industry and explains why MERV 13 performs better during wildfire smoke events.
Source: ashrae.org/technical-resources/filtration-disinfection
3 Supporting Statistics That Reframe the Indoor Question
Outdoor numbers grab the headlines, but the data we lean on inside the company points families toward indoor action.
-
1
Indoor Air Can Be 2 to 5 Times More Polluted Than Outdoor Air
EPA exposure studies have measured indoor concentrations of common pollutants at two to five times the levels found outside, and occasionally more than 100 times higher during specific household activities like painting or stripping floors.
-
2
Columbus Ranked 54th-Worst U.S. Metro for Particle Pollution in 2025
The American Lung Association’s 2025 State of the Air report shows Columbus moved from the 78th-worst metro area in 2024 to the 54th-worst in 2025 for particle pollution exposure.
Source: American Lung Association — 2025 Columbus State of the Air Press Release
-
3
MERV 13 Is the Recommended Baseline for Wildfire Smoke Filtration
The CDC and EPA’s joint review of indoor air filtration during wildfire events found that MERV 13 filters substantially reduce indoor PM2.5 concentrations and are recommended whenever HVAC systems can support the added static pressure.
Source: CDC — Indoor Air Filtration for Wildfire Smoke Pollutant Exposure

Final Thoughts and Our Take on Columbus Air
Most Columbus families check the AQI map for the same reason they check the radar before a Saturday soccer game: they want to know whether to send the kids outside. That instinct is the right one. The piece most AQI pages skip is what to do once the answer is no.
Our honest take after watching Central Ohio weather patterns and filter performance over many seasons is that the AQI number matters less than the question it forces you to answer next. A yellow day with the fan on Auto behind a loaded MERV 8 filter is not a healthier day than an orange day with MERV 13 and continuous circulation. The map gets families paying attention to outdoor conditions, while the filter is what actually does the work indoors.
Next Steps for Today
Reading the live map is step one. Here is a short order of operations any Columbus household can run through in under fifteen minutes.
Read the dominant pollutant. Look at the live map above. If ozone is dominant and the band is yellow or worse, limit outdoor exertion in the late afternoon. If PM2.5 is dominant, the issue is more about indoor air than outdoor exercise.
Check your current filter rating. Pull the filter from your return grille. The MERV rating is printed on the side. If you cannot find a number above 8 and the AQI is orange or red, today is a good day to upgrade.
Switch the fan to On. Most Columbus thermostats default to Auto, which only circulates air when the system is heating or cooling. Switching to On runs the blower continuously and pulls air through the filter every hour, regardless of temperature.
Sign up for MORPC EnviroFlash. Free email or text alerts arrive the night before a forecasted Air Quality Alert day. This is the single best preparation tool we recommend to Central Ohio customers with asthma or heart conditions in the family.
Frequently Asked Questions
Match a Filter to Today's Columbus AQI
The live map tells you the number, and your filter decides what your family actually breathes once everyone walks back in the door. Whether today is a yellow ozone afternoon or a red wildfire smoke morning, we can help you match the right MERV rating to your home, find the right size for your return grille, and set a delivery cadence that lines up with how often your HVAC system actually needs a fresh panel.
Filterbuy panels are built in Alabama, Florida, Pennsylvania, and Utah, and shipped to Columbus within two business days.