
Air Quality in Ohio
Air quality index (AQI⁺) and PM2.5 air pollution in Ohio •


Get Alerts For Unhealthy AQI In Your Area
When air quality in your area reaches unhealthy levels, we'll send you a quick alert, along with expert tips on how to reduce your exposure.
Live Air Quality Ratings in Ohio
Live Most Polluted City Ranking
Real-time most polluted cities in Ohio
Live Cleanest City Ranking
Real-time cleanest cities in Ohio
The Right Air Filter For High AQI Days
When outdoor air quality drops, the EPA recommends upgrading to a MERV 13 filter — or the highest-rated filter your HVAC system can handle — to help capture more of the fine particulate (PM2.5) that comes with poor air quality. MERV 13 is the highest rating most residential systems can run without restricting airflow.
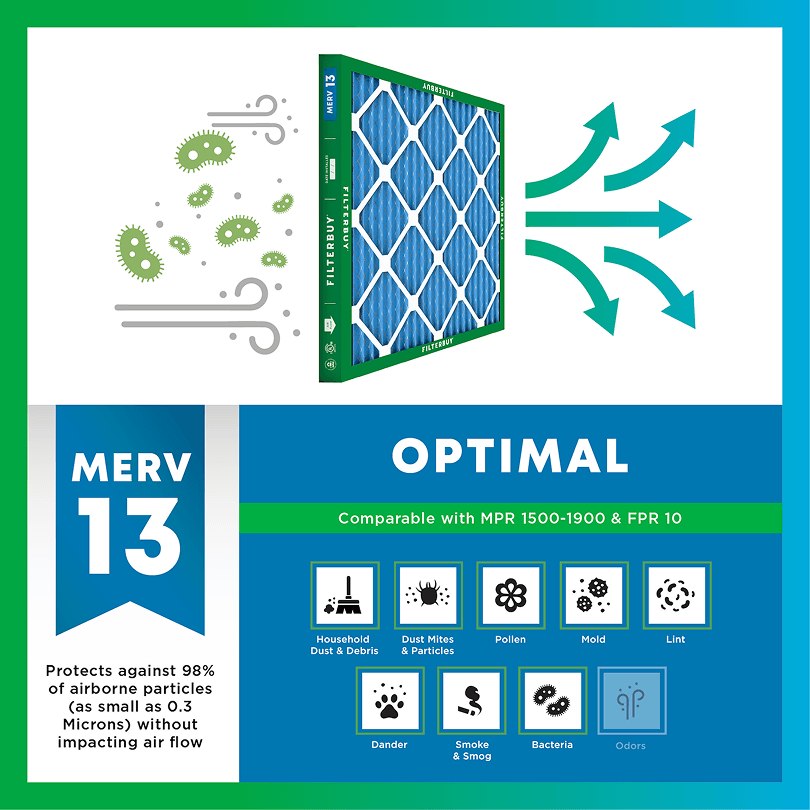
- Captures PM2.5 and other fine particulates
- Filters ash, soot, and smoke particles
- Rated to capture particles as small as 0.3 microns
- Matches the filter rating the EPA suggests during high-AQI and smoke events

AQI FAQs
What is AQI?
AQI stands for Air Quality Index, the EPA's scale for reporting daily air quality. It runs from 0 to 500. The higher the number, the greater the level of air pollution. Values at or below 100 are generally considered satisfactory; values above 100 mean air quality is unhealthy, first for sensitive groups, then for everyone as numbers climb.
What does AQI measure?
The AQI tracks five major pollutants regulated by the Clean Air Act: ground-level ozone, particle pollution (PM2.5 and PM10), carbon monoxide, sulfur dioxide, and nitrogen dioxide. The reported AQI value reflects whichever pollutant is highest at that time — most often ozone or fine particles (PM2.5).
How is AQI calculated?
Monitoring stations measure pollutant concentrations, and the EPA converts each into a standardized 0–500 score using set breakpoints. Each pollutant gets its own sub-index, and the highest sub-index becomes the reported AQI. That's why a single number can represent different pollutants on different days.
What is a good AQI?
An AQI of 0–50 is rated "Good" — air quality poses little or no risk. 51–100 is "Moderate," acceptable for most people though unusually sensitive individuals may want to limit prolonged outdoor exertion. Anything at or below 100 is generally considered satisfactory air quality.
What does an AQI of 100 (or 150) mean?
100 is the dividing line: at or below it, air quality is satisfactory for the general public. From 101–150, air is "Unhealthy for Sensitive Groups" — people with respiratory conditions, older adults, and children. From 151–200, it's "Unhealthy" and everyone may begin to feel effects.
Why is the AQI bad today?
Short-term AQI spikes usually come from wildfire smoke, temperature inversions that trap pollutants near the ground, high-ozone weather (hot, sunny, stagnant days), or heavy traffic and industrial activity. Check a real-time source like the map on this page to see which pollutant is driving today's reading in your area.
What AQI is bad for running or exercise?
Many runners follow the EPA category lines: below 50, no adjustment needed; 51–100, unusually sensitive people may shorten intense workouts; above 100, sensitive groups are advised to reduce prolonged or heavy outdoor exertion; above 150, that advice extends to everyone. Exercise increases how much air you breathe in, which is why thresholds matter more during workouts.
What AQI is safe to open windows?
A common rule of thumb is to keep windows open when the AQI is under 100 and close them when it climbs above, especially during wildfire smoke events when fine particles are elevated. When windows are closed, running your HVAC system with a fresh filter helps capture particles circulating indoors.
Should I wear a mask based on AQI?
Public health agencies generally suggest considering a well-fitted N95-style respirator outdoors when the AQI exceeds 150, particularly during smoke events. Cloth and surgical masks don't filter fine particles effectively. Follow guidance from your local health department, which may adjust recommendations during severe episodes.

Check Today's Live Real Time Air Quality Index AQI Map in Ohio Now
By Michelle Wan, Brand Manager & Air Quality Writer · Reviewed by David Clark, Licensed HVAC Technician · Published July 17, 2026 · Updated July 17, 2026
TL;DR
Ohio's air quality index right now is on Filterbuy's live Ohio AQI map above. Enter your ZIP code to see your county's live AQI, the pollutant driving it, and today's forecast. Statewide, Ohio's air is usually Good or Moderate, but Ohio still records unhealthy days: the American Lung Association's 2026 "State of the Air" report gave Franklin County an F for short-term particle pollution. On days when Ohio's AQI climbs past 100, the most effective thing most homeowners can do is close the windows and run their HVAC system continuously with a MERV 13 filter.
Key Takeaways
Filterbuy's Ohio AQI map above is live. It pulls from the EPA's AirNow monitoring network and updates hourly.
An AQI above 100 is "Unhealthy for Sensitive Groups," the threshold at which Ohio's local air agencies issue Air Quality Alerts.
Ohio has two air seasons. Ground-level ozone drives the AQI from roughly March through October; fine particle pollution (PM2.5) can drive it any month of the year.
Cleveland's air was redesignated to "attainment" for ozone by the EPA on June 29, 2026. A real milestone, and still not a promise about today. Attainment is a three-year average; the AQI is right now.
The EPA reports that running your HVAC fan continuously with a high-efficiency filter can cut indoor PM2.5 by about 50%, compared with about 24% for a typical low-efficiency filter.
Your AQI forecast comes from a local agency, not one statewide office. Which agency depends on your county.
What's the Air Quality in Ohio Right Now?
Ohio's current air quality index is displayed on Filterbuy's live map at the top of this page. Enter your ZIP code to get your county's real-time AQI, the pollutant behind the number, and the forecast for tomorrow. The Air Quality Index is the EPA's 0-to-500 scale for daily air pollution: the higher the number, the more pollution in the air and the greater the health concern. Most days in Ohio land in the Good (0–50) or Moderate (51–100) range.
One pattern we've watched for years, across more than two million households: the AQI spikes hours before anybody indoors smells a thing. That gap is the whole reason to check a map instead of trusting your nose.
The map draws on the U.S. EPA's AirNow network, which is fed by monitors operated by Ohio EPA's Division of Air Pollution Control and Ohio's local air agencies. Ohio EPA notes that these hourly readings are raw data. They are accurate enough to plan your afternoon around, but not official until they pass a quality-assurance review. Looking beyond the state line? Check the live AQI map for the entire USA.
A note on who is telling you this. Filterbuy is not a weather service. We are a family-owned filter manufacturer that has been building air filters in the United States since 2013, and we built this map for a plainly self-interested reason: the AQI question and the filter question turn out to be the same question. What is in the air outside decides what your system has to pull out of the air inside. We have a rule here: we don't make claims we can't back. So everything below is sourced, and where Ohio's data runs out, we say so.
What Ohio's AQI Numbers and Colors Actually Mean
The AQI is not a pollution measurement. It's a translation. The EPA converts a pollutant concentration into a 0–500 health scale, and the number you see is whichever pollutant scores worst that hour. These are the ranges and colors Filterbuy's map reports against, and they are the EPA's, not ours. If you want the full background on how the Air Quality Index is calculated, that guide walks through the math and the five pollutants behind it.
Source: U.S. EPA. The PM2.5 breakpoints for AQI 50, 100 and 150 are 9.0, 35.4 and 55.4 µg/m³. The EPA rebuilt the breakpoints above AQI 200 in its 2024 particulate matter rule. Confirm current values before publishing.
The PM2.5 breakpoints changed recently. When the EPA lowered the annual PM2.5 standard from 12.0 to 9.0 µg/m³ in 2024, it also moved the AQI's Good/Moderate line down to 9.0 µg/m³ and rebuilt the upper breakpoints around newer health evidence. The 100 and 150 thresholds stayed at 35.4 and 55.4 µg/m³. In plain terms: a PM2.5 reading that would have scored "Good" a few years ago may now read "Moderate." That standard survived a legal challenge. The D.C. Circuit upheld the 9.0 µg/m³ limit on June 26, 2026.
Ozone works on a separate scale. The federal ozone standard is 70 parts per billion, which is exactly an AQI of 100. As the Southwest Ohio Air Quality Agency explains, 71 ppb produces an AQI of 101, and that single point is the line between "acceptable" and "Unhealthy for Sensitive Groups."
Related: what each AQI color means · PM2.5, the fine particles behind most spikes
Why "In Attainment" Doesn't Mean "Safe Today"
Ohio's air can be legally in attainment and still hand you an unhealthy afternoon. Those are two different measurements. Attainment grades three years of history with the worst days excluded. The AQI grades the hour you are standing in. The EPA redesignated the Cleveland area on June 29, 2026, and Franklin County still carries an F for short-term particle pollution. Both are true at once, and that is why a live map beats an annual report card. This is the part of Ohio's air story almost nobody explains, and it's the one we'd most want a neighbor in Columbus to hear.
On June 29, 2026, the EPA redesignated the Cleveland area to attainment for the 2015 ozone standard. The area covers seven counties: Cuyahoga, Geauga, Lake, Lorain, Medina, Portage and Summit. That's a genuine win, and Northeast Ohio earned it: the EPA credits the region with cutting nitrogen oxide emissions roughly 42% and volatile organic compounds roughly 25% since 2018. Ohio EPA's maintenance plan is designed to hold the area in attainment through 2038.
Now the fine print. Cleveland's ozone design value for 2023–2025 was 0.070 ppm, precisely at the limit, not comfortably under it. And it only got there after EPA concurred, in January 2026, with Ohio EPA's request to exclude wildfire-smoke-influenced days from the calculation as "exceptional events". Ohio’s county-by-county attainment status is published in the EPA’s Green Book.
That's a legitimate, long-standing regulatory practice. Regulators don't hold a state accountable for smoke blown in from Canadian wildfires. But it draws a line worth understanding:
Attainment is a three-year average with the worst days removed. The AQI is this hour, with nothing removed. Your lungs don’t get an exceptional-events exemption.
The American Lung Association's 2026 "State of the Air" report, which grades 2022–2024 data, makes the same point from the other direction. It found 1,275,579 Ohio children living with unhealthy levels of air pollution. The Columbus-Marion-Zanesville metro ranked 34th worst in the nation for short-term particle pollution, with Franklin County averaging 4.8 unhealthy days a year and earning an F, worse than the prior year's 46th-place ranking. Cleveland-Akron-Canton ranked 39th worst and Cincinnati-Wilmington 31st worst on the same measure. Christina Yoka, Cleveland's Chief of Air Pollution Outreach, attributed much of that year's shift to the 2023 wildfires.
So Ohio can be legally in attainment and still hand you an orange day. Both things are true. The map tells you which day you're having.
After manufacturing filters for over a decade and serving more than two million households, here’s what Ohio taught us: a clean report card and a clean afternoon aren’t the same thing. Attainment averages three years and sets the smoke days aside. Nobody’s lungs get that option. That’s why this page opens with a live map instead of a grade.
The Filterbuy Team
We’ve made filters in the United States since 2013, and we have a rule here: we don’t make claims we can’t back. So here is the honest read on Ohio. The designation improved this summer, and that is real progress that real people worked years for. It is also not a forecast. Attainment describes three years that already finished. The map above describes right now, which is the only part your Tuesday afternoon cares about.
Michelle Wan, Brand Manager & Air Quality Writer, Filterbuy
What's Actually in Ohio's Air, and When
Ohio runs on two air seasons, and knowing which one you're in tells you what your AQI number is really made of.
Ozone season: roughly March 1 – October 31. Ground-level ozone isn't emitted directly. It's cooked. Nitrogen oxides and VOCs from tailpipes, smokestacks and industrial boilers react in sunlight, which is why ozone peaks on hot, sunny, still summer afternoons, and why Ohio's local agencies issue most alerts in July and August. The Regional Air Pollution Control Agency in Dayton notes that most of its ozone monitors only operate during that official March-to-October window. The EPA likens breathing ozone to a sunburn on your lungs.
PM2.5: year-round. Fine particle pollution is the one that doesn't take winters off. It comes from wildfires, wood stoves, coal-fired power plants and diesel engines. At 2.5 microns and smaller, it is small enough to reach deep into the lungs and cross into the bloodstream. In Ohio, PM2.5 is the pollutant most likely to spike suddenly and dramatically, because Ohio sits downwind. The 2023 Canadian wildfire smoke that pushed Ohio cities into red and purple territory wasn't an Ohio emissions problem. It was a weather-pattern problem.
The practical upshot: an orange day in July is probably ozone, and an orange day in January is almost certainly particles. Ozone is a stay-inside-and-wait problem. Particles are a filter problem, because particles get into your house.
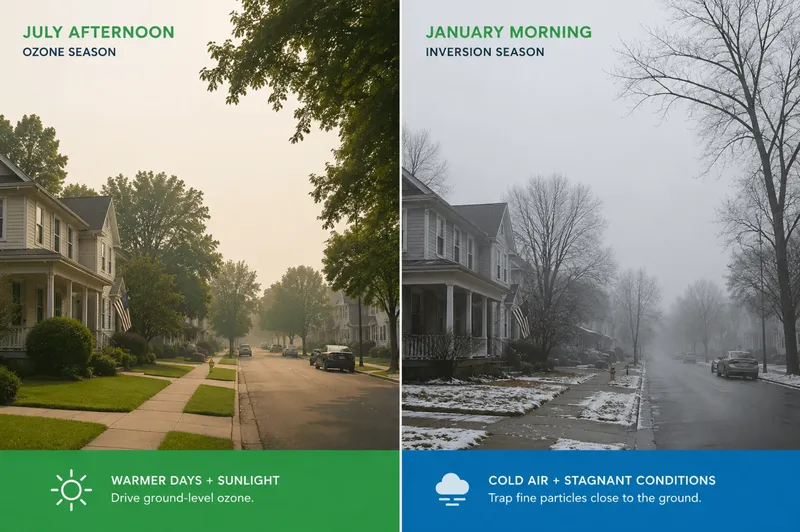
Same Number, Two Different Days: The Ohio Pollutant Check
An AQI of 105 in July and an AQI of 105 in January are not the same day in Ohio, and they do not call for the same response. July's 105 is almost certainly ozone, a gas your air filter cannot catch. January's 105 is almost certainly fine particles, which is precisely what a filter is built for. Same number. Different problem. So before you act on the color, read the pollutant underneath it. Every AQI map, including Filterbuy's, names it.
Ozone is a gas and particle filters do not remove it; PM2.5 is particulate and they do. Sources: U.S. EPA and Ohio EPA.
This is the part we wish more people knew, and it is the reason we keep saying "check the pollutant" instead of "check the AQI." A filter is the right tool for roughly half of Ohio’s bad-air days and the wrong tool for the other half. We would rather tell you which half you are in than sell you a filter for a smog day.
Who Forecasts Your AQI in Ohio?
Ohio doesn't have one air quality office. It has Ohio EPA's Division of Air Pollution Control plus a network of local air agencies that contract with the state, which means the forecast you see and the alert you get depend on your county.
In Northeast Ohio the forecast comes from NOACA, which issues the region’s Air Quality Advisories, and they are relayed to the public by the National Weather Service in Cleveland.
Ohio has no single air quality office. Local air agencies contract with Ohio EPA to forecast the AQI and issue alerts in their regions.
Two things worth doing with this:
Sign up for EnviroFlash. It's the EPA's free alert service, used by Ohio's agencies. You pick your location and it emails or texts you when your AQI is forecast to go unhealthy. No map-checking required.
Know your trigger. Ohio's agencies issue an Air Quality Alert when the forecast hits an AQI of 101. If you have a kid with asthma, that's your cue, not the weather report's.
What This Map Can't Tell You
Filterbuy built this map, so we would rather be the ones telling you where it runs out. Four limits worth knowing, because a number you trust wrongly is worse than no number at all.
It reports the worst pollutant, not the total. The AQI is a maximum, not a sum. If ozone scores 88 and PM2.5 scores 85, your map reads 88, not 173. You are breathing both. The index reports the winner of that race and stays quiet about the rest, which is why the pollutant name next to the number matters as much as the number.
A blank county is missing data, not clean air. Ohio EPA runs over 100 monitoring sites reporting more than 265 parameters, one of the bigger networks in the country. But its network plan says the plain part out loud: most sites sit in urban areas where the majority of the population lives. Of Ohio's PM2.5 sites, four sit in counties outside a metro area. Of its ozone sites, five do. The American Lung Association puts it the same way: no monitor in your county means no reading for your county. Between monitors, the shade over your township is a modelled estimate rather than a measurement.
In winter, most of Ohio stops watching for ozone. Ohio runs 48 ozone monitoring sites from March 1 through October 31. Three stay on year-round: the NCore sites at Cleveland, Cincinnati and Preble County. That is federal rule, not negligence, because ozone is a warm-season problem. It also means a January ozone number is thin by design, which is another way of saying winter is a particle story.
The number is provisional. Ohio EPA publishes these hourly readings as raw data and does not treat them as official until they pass a quality-assurance review. Good enough to plan your afternoon around; not official enough to cite in a permit. The EPA says the same of its own map: contoured areas are approximate, and readings are preliminary and subject to change.
Sources: Ohio EPA, 2024–2025 Annual Air Monitoring Network Plan and the EPA's AirNow interactive map documentation
None of this makes the map less useful. It makes it a prompt rather than a verdict, which is how we would use it ourselves.
What to Do When Ohio's AQI Climbs
Here's the honest version: on a bad air day in Ohio, you can't fix the outdoor air. You can absolutely fix what your family breathes for the 90% of the day they're indoors.
Being a filter manufacturer gives us a narrow view of this, and we would rather be narrow than vague. We can tell you what a MERV 13 does to fine particles moving through a duct, because we have been building and testing that media since 2013. We cannot tell you what this afternoon's ozone will do to your run. Ozone is a gas. It slips past filter media, and anyone selling you a filter as the answer to a smog day is selling you something. Two different problems. Only one of them is ours to solve.
The EPA's guidance for smoky conditions is specific, and it's the best-supported advice on this page:
The U.S. EPA recommends upgrading to a MERV 13 or higher HVAC filter during smoky periods and running the system fan continuously, which it reports may cut indoor PM2.5 by about 50% versus about 24% with a typical low-efficiency filter.
Three EPA-backed specifics:
Upgrade to MERV 13 or higher during smoky periods. Lower-rated filters are built for dust and lint; they let fine particles pass straight through.
Switch the fan from "Auto" to "On." Your filter only works when air moves through it. On "Auto," your system filters nothing between cycles.
The numbers: the EPA reports that running the system fan continuously with a high-efficiency filter may cut indoor PM2.5 by about 50%, versus about 24% with a typical low-efficiency filter running continuously.
That's the whole argument for a good filter, made by the EPA rather than by us. A MERV 13 filter in a system that's running is the highest-leverage move most Ohio homeowners have on a smoke day. If you are weighing ratings, the MERV rating chart breaks down what MERV 8, 11 and 13 each capture.
One caveat, and David Clark, our reviewing HVAC technician, would want it stated plainly: not every system should jump straight to MERV 13. Most modern residential HVAC equipment handles it fine, but if your system is older or your ductwork is undersized, a too-restrictive filter can choke airflow. Check your manual or ask a technician.
We see the other end of this. After a rough air stretch, the filters customers send back arrive darker and heavier than a normal month should explain. That's the clearest sign we know that the outdoor number made it indoors, and it's why we say look at the filter during a smoke week, not after it.
And check the filter more often than you think during a smoke event. Heavy smoke can load a filter in days. For a smoke-specific breakdown, see the best MERV filter for wildfire smoke and how MERV 13 compares with HEPA for residential systems.
Find your filter → We have been making these in the United States since 2013, in over 600 sizes, shipped factory-direct with no middleman markup. Enter your size and get MERV 13 filters before the next smoke stretch, not during it. Odd size? Build a custom filter in a few clicks. Want them to just show up when it's time? Set up auto-delivery and stop thinking about it.
Supporting Statistics
Three findings carry this page. All three are linked, so you can check our work.
1. You Breathe Indoor Air About 90% of the Time.
90% of your time is spent indoors.
Some pollutants run 2 to 5x higher indoors than out.
The map shows what's outside. Your windows, fan and filter decide what gets in.
Cuts both ways. Green day? Open the windows.
Source: U.S. EPA, Report on the Environment: Indoor Air Quality
2. MERV 13 Moves the Number a Long Way. It Doesn't Erase Smoke.
One house. One wildfire event. Two setups:
MERV 13 in the central system: indoor PM2.5 sat at 55% of outdoor (mean I/O ratio 0.55).
MERV 13 plus a portable air cleaner: 22%.
Two caveats, said out loud:
The system cycled. It didn't run nonstop. That's why we say flip the fan to On.
Indoor PM2.5 still peaked at 280 µg/m³. A filter helps. It is not a force field.
3. an Ohio County Can Pass the Annual Standard and Still Hand You Unhealthy Days.
The attainment gap, in the American Lung Association's grading math:
Year-round PM2.5: pass at 9.0 µg/m³. Fail at 9.1.
Short-term spikes: graded separately. Orange 1, red 1.5, purple 2, maroon 2.5.
Two measures. Two grades. One county.
That's how an Ohio county earns a Pass and an F at the same time.
Source: American Lung Association, "State of the Air" 2026 Ohio report card
The 7 Ohio Air Quality Sources We Keep Open All Summer
The map up top tells you Ohio's AQI right now. These seven tell you what's coming, what it means, and who under your roof should care first. We're air-obsessed, so we keep all seven open through ozone season. Every one is free, and every one is a government agency or a national health authority. No aggregators, no guesswork.
1. Tomorrow’s Ohio Forecast, Straight from the People Who Issue It
Ohio EPA's Division of Air Pollution Control posts a daily AQI forecast for Ohio's metro areas, and it's the same one your local agency reads before deciding whether to call an alert. Check it the night before and you'll know whether to move Saturday's game before anyone's packed the car.
Source: Ohio EPA’s Ohio Air Quality Index Forecasts
2. Let the Bad-air Day Come Find You
EnviroFlash is a free EPA service that Ohio's air agencies help run, and it emails or texts you when your air is forecast to turn unhealthy. Set your county once. Then stop refreshing maps at 6 a.m. wondering whether today's the day.
Source: EnviroFlash sign-up
3. See the Smoke Coming Before It Reaches Your Street
Ohio's worst air usually starts a few hundred miles north of Ohio. AirNow's Fire and Smoke Map puts active fires and drifting plumes right next to live PM2.5 readings, so you'll spot a Canadian plume headed for the Ohio Valley while there's still time to shut the windows and look at your filter.
Source: AirNow’s Fire and Smoke Map
4. What an Ohio Air Quality Alert Is Actually Asking You to Do
“Alert issued” isn't advice. AirNow's Action Days guide spells out who should ease off and by how much, and it handles ozone and particle pollution separately, because they aren't the same problem. It's the difference between worrying and knowing.
Source: AirNow’s guide to Action Days
5. Why Your Quiet Rural County Still Posts an Orange Afternoon
No traffic, no smokestacks, orange air anyway? The EPA's ozone primer explains it. Ozone isn't emitted by anything, it's cooked up in sunlight out of other pollutants, and wind carries it a long way from wherever it formed. Clean neighborhood, borrowed problem.
Source: The EPA’s ground-level ozone basics
6. What Ozone Actually Does Once You Breathe It
The EPA keeps this one short and plain: coughing, inflammation, asthma that flares, and damage it compares to a sunburn, except on the inside of your airways. Worth five minutes if anyone at your place is outside all summer.
Source: The EPA on the health effects of ozone pollution
7. Who Under Your Roof Will Feel It First
The American Lung Association's research lays out why kids, older adults, pregnant people, and anyone with asthma or a heart condition take the hit from ozone and fine particles before the rest of us notice a thing. If that's someone you love, start here.
Source: The American Lung Association on the health impact of air pollution
Ohio Air Quality FAQ
Glossary
Air Quality Index (AQI): The U.S. EPA's 0-to-500 scale for reporting daily outdoor air pollution. Higher numbers mean more pollution and greater health concern. The reported AQI reflects whichever pollutant scores worst.
AirNow: The U.S. EPA's national air quality reporting network, which aggregates monitor data from state and local agencies and supplies the readings on this page's map.
Attainment: A Clean Air Act designation meaning an area's air quality meets a federal standard, based on a three-year average of monitoring data. It is not a statement about air quality on any given day.
Design value: The three-year statistic the EPA compares against a federal air standard to decide attainment. Cleveland's 2023–2025 ozone design value was 0.070 ppm.
EnviroFlash: The U.S. EPA's free email and text alert service that notifies subscribers when their local air quality is forecast to reach unhealthy levels.
Exceptional event: Air pollution from a cause outside a state's control, such as wildfire smoke, that the EPA may exclude from regulatory calculations. Ohio EPA used an exceptional-events demonstration to exclude wildfire-influenced days from Cleveland's 2023–2025 ozone data.
Ground-level ozone: A harmful gas formed when nitrogen oxides and volatile organic compounds react in sunlight. The main ingredient in smog and Ohio's primary warm-season pollutant. Distinct from the protective ozone layer high in the atmosphere.
MERV: Minimum Efficiency Reporting Value, the 1-to-16 rating scale for how effectively an HVAC air filter captures airborne particles. Higher numbers capture smaller particles. MERV 13 is the EPA's recommended minimum during smoke events.
NAAQS: National Ambient Air Quality Standards, the health-based outdoor air pollution limits the EPA sets under the Clean Air Act. The annual PM2.5 standard is 9.0 µg/m³; the ozone standard is 70 ppb.
Nonattainment: A Clean Air Act designation meaning an area's monitored air quality does not meet a federal standard, triggering state cleanup planning requirements.
Ohio EPA, Division of Air Pollution Control (DAPC): The Ohio state agency that operates the state's outdoor air monitoring network and oversees the local air agencies that forecast AQI regionally.
PM2.5: Fine particulate matter 2.5 micrometers in diameter or smaller, roughly 30 times thinner than a human hair. Small enough to reach deep into the lungs and enter the bloodstream. The main health threat in wildfire smoke.
State of the Air: The American Lung Association's annual report grading U.S. counties on ozone and particle pollution using EPA monitoring data. The 2026 edition, its 27th, graded 2022–2024 data.
Sources
U.S. EPA. EPA redesignates Cleveland area to "attainment" for ozone (news release, June 2026).
U.S. EPA. Final Reconsideration of the PM NAAQS (annual standard 9.0 µg/m³).
U.S. Court of Appeals, D.C. Circuit. Kentucky et al. v. EPA, No. 24-1050, decided June 26, 2026.
American Lung Association. "State of the Air" 2026, Ohio press release (April 21, 2026).
American Lung Association. "State of the Air" 2026, Ohio report card.
American Lung Association. Cleveland-Akron-Canton, OH metro report card.
Ohio EPA, Division of Air Pollution Control. Air Quality Monitoring.
Ohio EPA. 2024–2025 Annual Air Monitoring Network Plan (filed with U.S. EPA Region 5).
Regional Air Pollution Control Agency (RAPCA), Dayton. Ozone season and AQI forecasting.
Southwest Ohio Air Quality Agency. Air Quality Alert criteria.
National Weather Service Cleveland. Air Quality for Northeast Ohio.
U.S. EPA. Strategies to Reduce Exposure Indoors (Wildfire Smoke course).
Spectrum News 1 Ohio. Coverage of the 2026 State of the Air report (May 4, 2026).