
Dayton Real-Time AQI Tracker


Get Alerts For Unhealthy AQI In Your Area
When air quality in your area reaches unhealthy levels, we'll send you a quick alert, along with expert tips on how to reduce your exposure.
What's Actually In Dayton Air Today?
What High AQI Means for Your Lungs in Dayton
How to Read AQI
The Air Quality Index (AQI) measures how polluted the air is and how it may affect your health.
0–50 (Good): Air quality is satisfactory.
51–100 (Moderate): Acceptable, but some pollutants may pose minor concerns.
101–150 (Unhealthy for Sensitive Groups)
151–200 (Unhealthy)
201–300 (Very Unhealthy)
301+ (Hazardous)
Moderate
Still okay for most, but if you have asthma or allergies, take it easy and avoid long outdoor workouts.
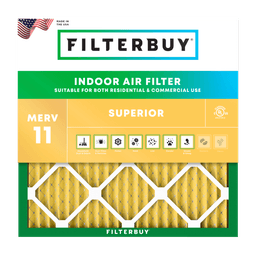
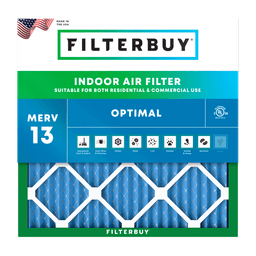
Shop MERV 11 filters→What's the Right Filter for Your AQI Level?
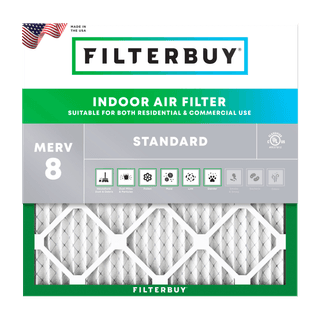
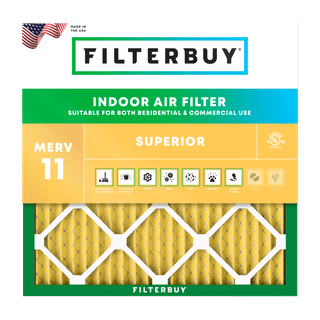
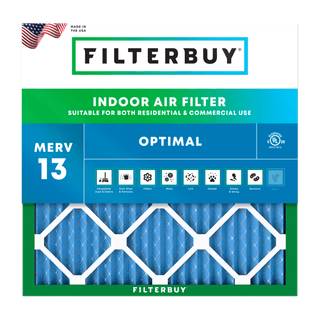


Check Today's Live Real Time Air Quality Index AQI Map in Dayton, OH Now
By Michelle Wan, Brand Manager & Air Quality Writer | Filterbuy · Technically reviewed by David Clark, Licensed HVAC Technician · Published: August 27, 2026 · Last updated: August 27, 2026
Author's Note
I write Filterbuy’s city air quality pages, so most of my mornings are spent in alert logs. Dayton’s stopped me.
In August, Ohio announced that all 88 of its counties had reached attainment, Montgomery included, which is a real milestone. Then I pulled the Miami Valley alert archive and found three alerts in a single week that July, on the 17th, the 19th, and the 20th.
Neither is wrong, since attainment is a three-year average while an alert is a forecast for tomorrow. But read only the headline and you would have put the filter off until fall. That gap, between what passed on paper and what lands on your street, is what this page is built around.
Michelle Wan, Brand Manager & Air Quality Writer, Filterbuy
TL;DR
The Filterbuy AQI map above draws on Regional Air Pollution Control Agency monitors across Montgomery County and the Miami Valley. Dayton reads Good to Moderate most days, with ozone driving the unhealthy ones from March through October and PM2.5 accounting for the rest. Once the index passes 100, sensitive groups should ease up outdoors.
Key Takeaways
Dayton's local air agency is RAPCA, and its AirLine, (937) 223-3222, reports the AQI plus pollen and mold counts.
Alerts come from two agencies: MVRPC issues Dayton Air Quality Alerts with RAPCA across seven counties.
Dayton's air is dramatically better: 159 unhealthy days in 1976 against four in 2018, yet alerts still ran July 17, 19, and 20, 2026.
The AQI reports one pollutant, not a blend, and omits pollen, mold, and odor. Ozone and PM2.5 days can read the same and call for opposite responses.
A filter captures particles, not ozone, so on high-PM2.5 days MERV 13 is the upgrade that matters.
What's Actually in Dayton's Air Today?
Two pollutants drive nearly every bad-air day here, and RAPCA has tracked both since the 1970s.
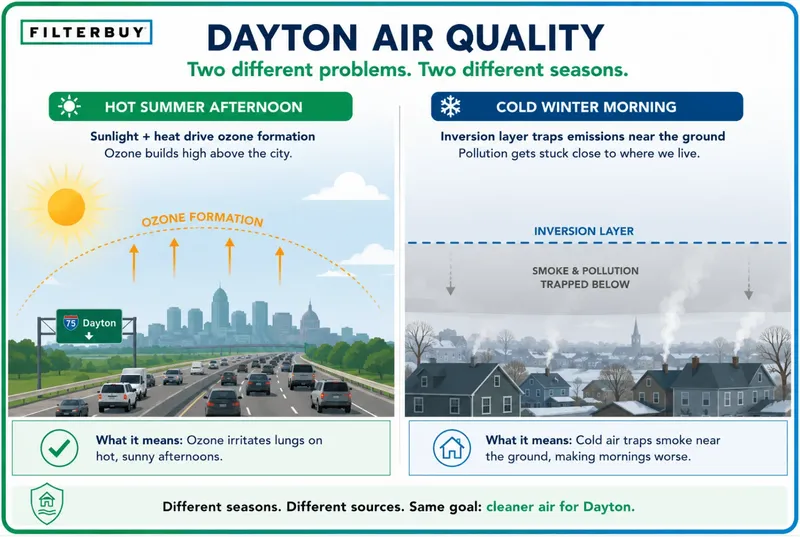
Ozone is a summer problem with a specific recipe: traffic, lawn equipment, and industrial emissions cooking in hot, still sunshine. Dayton sits where I-75 meets I-70 near Dayton International Airport, which keeps that reaction supplied, so ozone builds through the afternoon and breaks by evening.
PM2.5 keeps its own schedule. RAPCA can issue a fine particulate alert in any month, and winter is common, because inversions trap cool air near the ground and hold wood smoke and diesel exhaust in place. Canadian wildfire smoke is the third factor, and you can track smoke across Ohio when plumes are active.
Who Actually Measures Dayton's Air
The monitors behind that number belong to RAPCA, a bureau of Public Health – Dayton & Montgomery County, which covers six counties under authority delegated by Ohio EPA and feeds the EPA Air Quality System that the Filterbuy map draws on.
We read a lot of city AQI pages, and one thing about Dayton shows up on almost none of them: alerts here are a joint call. The Miami Valley Regional Planning Commission (MVRPC) issues them with RAPCA a day ahead, across seven counties, posting at MiamiValleyAir.org.
What Each AQI Level Means in Dayton
The AQI is a health scale rather than a pollution scale, and it answers one question: how much should you change your plans today? EPA’s AQI basics define six categories, and here is what each tends to mean in Dayton, written for the households who actually contact us rather than the ones asking general questions.
0–50, Good. Normal. Go walk the RiverScape loop.
51–100, Moderate. Dayton's most common warm-season reading, and most people feel nothing. With asthma or allergies, this is the band where a long outdoor workout catches up with you by evening.
101–150, Unhealthy for Sensitive Groups. Usually a hot, stagnant ozone afternoon or a particle event drifting in, and the level that triggers an MVRPC alert. Children, adults over 65, and anyone with asthma, COPD, or heart disease should move hard exercise indoors or to early morning. For childhood asthma, the Dayton Asthma Alliance is the local resource.
151–200, Unhealthy. Everyone feels this one, and in Dayton it usually means smoke, so close the windows, run the fan, and skip the workout.
201+. Rare here, and when it happens it is smoke. Stay inside and keep the system running.
The American Lung Association counts 1,275,579 Ohio children breathing unhealthy air, which is why these bands are written around sensitive groups rather than averages. Regional grades sit on the Dayton metro report card.
Four Things This Number Won't Tell You
The AQI covers five pollutants and no others: ozone, particle pollution, carbon monoxide, nitrogen dioxide, and sulfur dioxide. Much of what Dayton households notice sits outside that list, so if the Filterbuy map reads green and your day says otherwise, this is why.
Pollen is not in it. RAPCA runs an automated pollen sensor at Sinclair Community College downtown, with daily counts on the RAPCA site and hourly levels in the PollenWise app. In April and September that number matters more to most Dayton households than the AQI does.
Mold is not in it either. RAPCA's AirLine reports mold counts alongside pollen, which makes it the number to check after a wet spring.
Odor is not in it. If you smell the Stony Hollow Landfill or the Dayton Wastewater Treatment Plant, the AQI will not register it, and RAPCA directs residents to contact the facility directly. Both investigate around the clock.
And "attainment" is not today’s air. Ohio EPA announced on August 4, 2026 that all 88 counties meet federal standards, a first in over two decades. But attainment is a multi-year average against a threshold, while the AQI is this monitor at this hour, which is how three alert days land in a county that just passed.
A green map and a bad day are not a contradiction, just different measurements. You do not breathe the average.
Two Days Can Both Read 85 and Mean Opposite Things
The AQI is not a blend. Per EPA's technical guidance, EPA calculates a separate index for each pollutant and reports only the highest, called the main pollutant, so everything else that day stays invisible. A Dayton 85 driven by ozone and an 85 driven by PM2.5 are the same number and opposite days.
An ozone day peaks in the afternoon and clears by evening, so morning is your window, and no filter helps because ozone is a gas. A PM2.5 day ignores the clock and can sit for days, so close the windows and run the fan, which is where filtration earns its keep.
Both RAPCA and AirNow publish the main pollutant beside the value, so check that rather than the number alone.
One caution about our own map: the PM number is a NowCast averaging the previous several hours, so a moving plume is always partly in the past by the time any map shows it. If it looks or smells smoky and the map says yellow, believe your nose and check the AirNow Fire and Smoke Map.
What a Filter Can and Can't Do About Dayton's Air
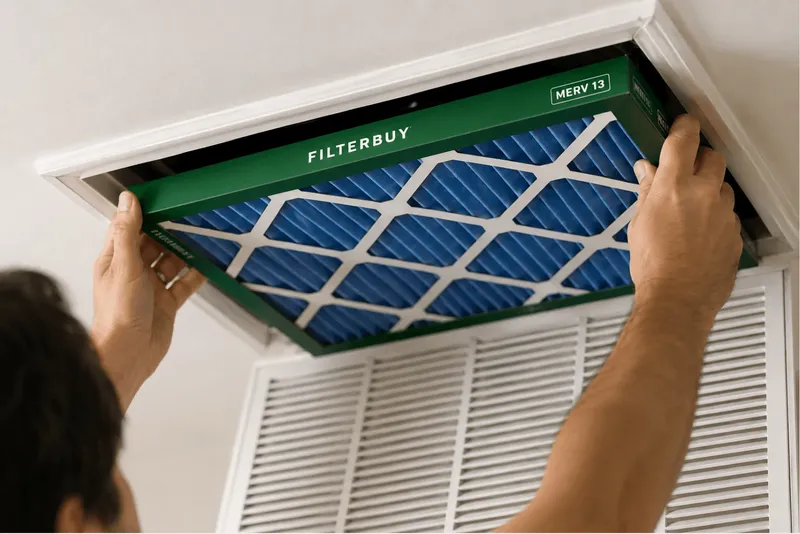
An HVAC filter captures particles, which makes it meaningful against the PM2.5 in wood smoke, diesel exhaust, and wildfire haze, the pollutant behind most of Dayton's unhealthy days. It does nothing for ozone, because MERV rates particle capture only, leaving MERV 13 and MERV 8 equally useless against a gas.
Filterbuy insight: we have built air filters in the United States for over a decade, out of Talladega, Alabama, and shipped them factory-direct to millions of homes, which is exactly why we will tell you a filter is the wrong purchase on an ozone day. Selling one anyway would be easy, and it would also be the last time you believed this page.
An attainment ruling is a verdict on the last three years. It is not a forecast for Saturday. The filter in your furnace does not care what the paperwork says.
David Heacock, Founder and CEO, Filterbuy
Our MERV 13 air filters catch the fine particulate a standard filter passes through, in 600+ sizes. If you are unsure what your system handles, how MERV 8, 11, and 13 compare walks through the tradeoff, and the best MERV filter for wildfire smoke covers smoke season. For pollen, MERV 11 is the step up, and auto-delivery keeps a clean one on hand.
Filterbuy tracks the same way in Columbus, Akron, and nationwide.
Supporting Statistics
Three numbers carry this page: two from the U.S. EPA, one from the agency that measures Dayton's air.
159 to 4: Dayton's Unhealthy Days
The Miami Valley logged 159 days at AQI 101 or higher in 1976. In 2018 it logged four.
Measured by RAPCA across six counties, not one monitor.
Why it matters: Dayton's air is genuinely better, not just differently reported, which makes a high reading an event to plan around rather than a fixed condition.
Source: Miami Valley Regional Planning Commission, Sustainable Air Quality. Data credited to RAPCA.
Two to Five Times: Indoor Versus Outdoor
Americans spend about 90% of their time indoors, where some pollutants run two to five times higher than outdoors.
The most vulnerable spend even more time inside: the very young, older adults, and anyone with heart or lung disease.
The Filterbuy map above measures the other 10%.
Why it matters: closing the windows is the right call on a bad-air day, and it also hands your next eight hours of breathing to your HVAC system.
Source: U.S. EPA, Report on the Environment: Indoor Air Quality. Updated May 27, 2026.
About 50%: What a Filter Actually Removes
A high-efficiency HVAC filter may cut indoor PM2.5 by about 50% when the fan runs continuously.
Three conditions attach:
MERV 13 or higher during smoky periods.
Fan on continuously, which the 50% figure assumes.
Replace when it looks dark, not on a schedule.
Why it matters: we make these filters, so here is the honest version. Fifty percent is real and worth the upgrade, but it is not the 95% you will see online, which describes single-pass lab capture at one particle size rather than the air in your house.
Source: U.S. EPA, Strategies to Reduce Exposure Indoors, Wildfire Smoke and Your Patients' Health.
Dayton Air Quality FAQ
Glossary
AQI (Air Quality Index): EPA's 0 to 500 daily health scale covering five pollutants. Below 50 is Good; above 100 affects sensitive groups.
PM2.5: Fine particles under 2.5 microns, small enough to reach deep lung tissue. The main pollutant in smoke and winter haze.
Ground-Level Ozone: A gas formed when sunlight reacts with vehicle and industrial emissions. Peaks on hot, still afternoons. Not filterable.
RAPCA: Regional Air Pollution Control Agency, Ohio EPA's local agency for the six-county Dayton region.
MVRPC: Miami Valley Regional Planning Commission, which issues Dayton Air Quality Alerts with RAPCA.
Attainment: EPA's designation for whether an area's multi-year average meets a federal standard. A regulatory status, not a forecast.
MERV: Minimum Efficiency Reporting Value. Rates particle capture only, not gases.