
Ohio Live Wildfire Smoke Map
Get Alerts For Wildfires In Your Area
The moment a wildfire starts near you, you'll get an instant alert and simple tips to reduce your smoke exposure.
What's In The Smoke
30xSmaller than a human hair
Fine enough to reach deep into the lungs. A MERV 13 is built to capture it.
How Far It Travels


It Doesn't Stay Local
Smoke rides the wind far downwind — you can get smoky air with no fire nearby.
What To Do During A Smoke Event
Simple steps to reduce indoor exposure.
- Stay In, Close UpShut windows and doors to keep smoke out.
- Set Fan To "On"Keeps air cycling through your filter, not just when heating or cooling.
- Recirculate AirSwitch off fresh-air intake so you're not pulling smoke in.
- Run A MERV 13Built to capture the fine PM2.5 in smoke.
- Add A PurifierExtra filtration for the room you use most.
- Wear an N95 if OutsideFits snug to block fine particles — a cloth mask won't.


The Best Air Filter For Wildfire Smoke
During smoke events, the EPA recommends upgrading to a MERV 13 filter — or the highest-rated filter your system can handle — to help reduce the fine particles smoke brings indoors. MERV 13 is the level most home HVAC systems can run while still capturing PM2.5, the fine particulate that makes up the bulk of wildfire smoke.
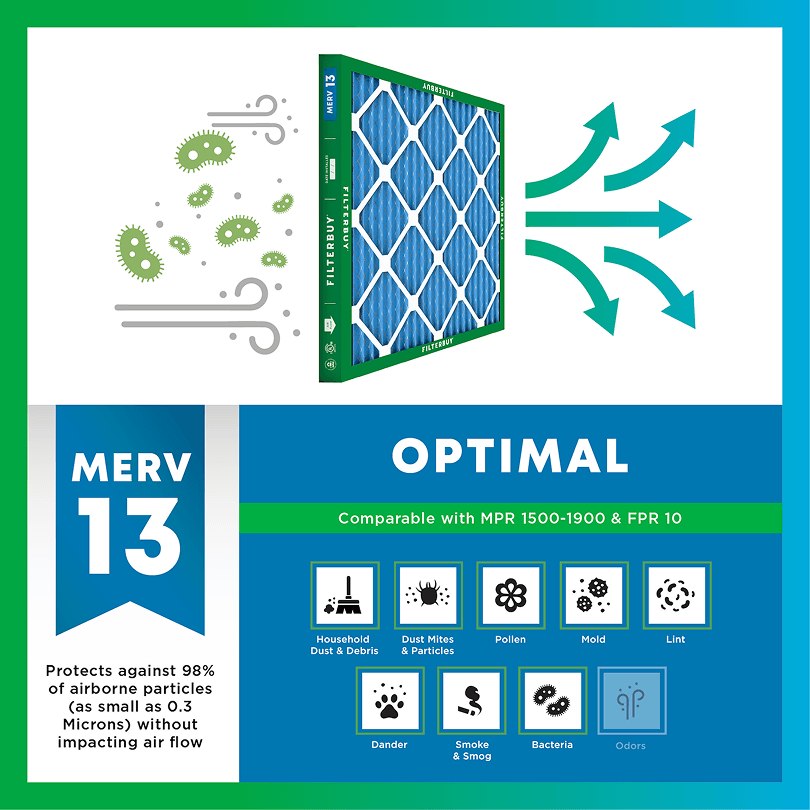
- Captures PM2.5 particles
- Blocks ash, soot, and smoke odor
- Keeps your indoor air safe—even when the outdoor air is dangerous
- Meets the EPA's recommended rating for filtering fine wildfire smoke particles.

Wildfire Smoke FAQs
Facts About Wildfires
Over 70,000 wildfires burn in the U.S. every year.
Wildfire smoke can travel 1,000+ miles, affecting states that aren't even near the blaze.
Exposure to wildfire smoke can worsen asthma, trigger heart issues, and lead to ER visits.
Indoor air can hold more fine particles during wildfire events unless it's properly filtered.
The EPA advises using MERV 13 filters or portable HEPA air cleaners during wildfire smoke events.
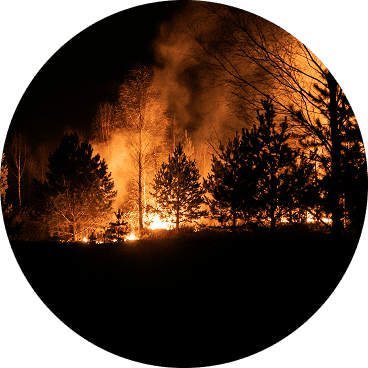
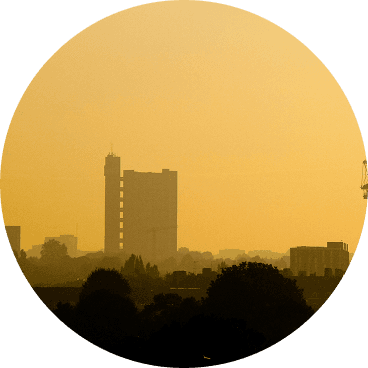
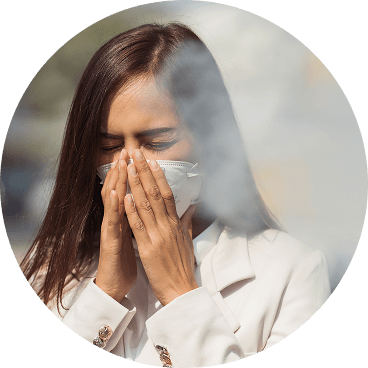
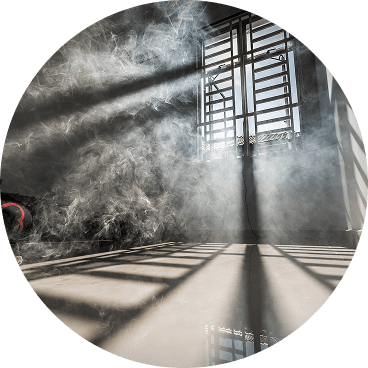
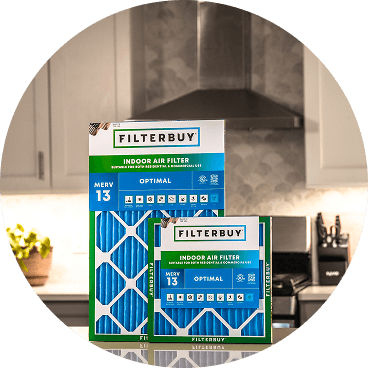
Don't Wait Until The Smoke's Inside.
Use the live wildfire smoke tracker and upgrade your air filters today to protect your lungs and your home.
Shop Filters For Smoke Protection
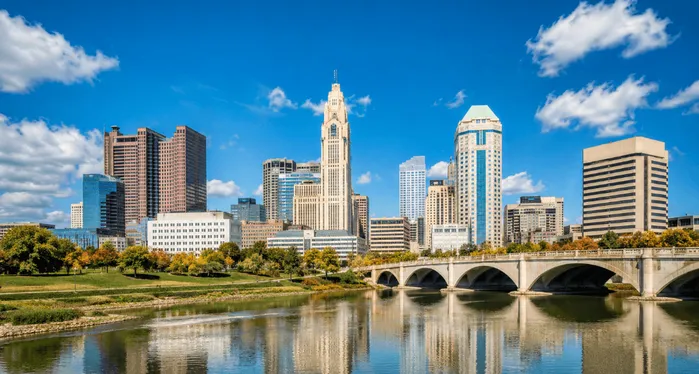
Current Live Wildfire and Smoke Map Ohio Today From Filterbuy.com
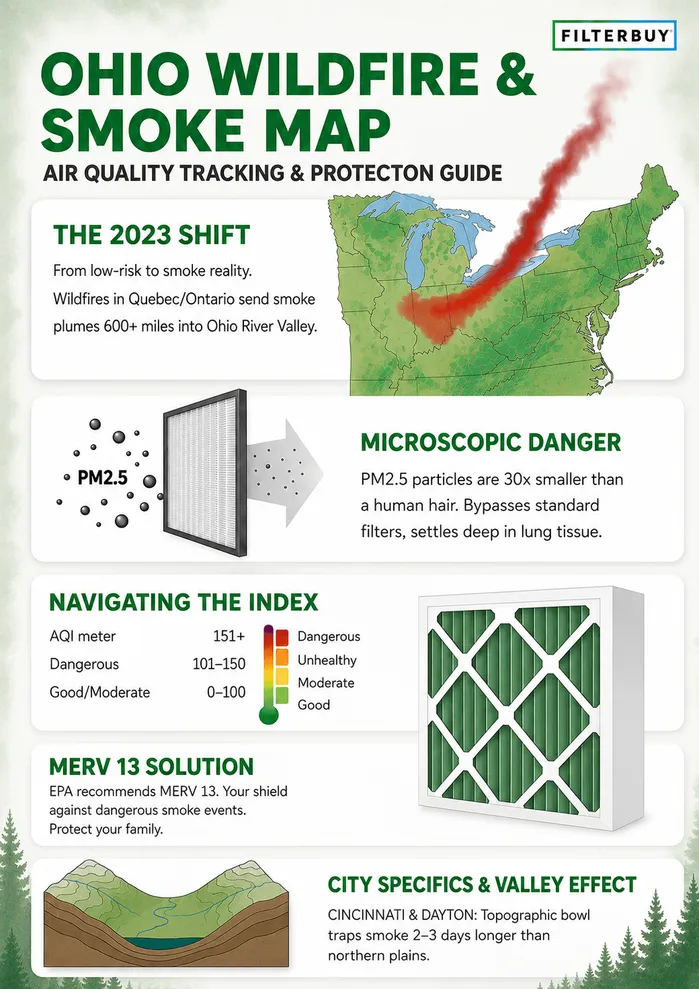
Ask anyone who was in northeast Ohio during the first week of June 2023 what the air smelled like. Most will tell you campfire. None of the smoke had come from anything burning in Ohio. It had traveled more than 600 miles from Quebec, settled over the state, and stayed for days.
After manufacturing filters for over a decade and working with Ohio households through events exactly like that one, we can tell you what comes next. Canadian wildfire smoke will reach Ohio again. We can't predict the date, but we can help you get your home ready before it does. This page is built for exactly that: track the active fires affecting Ohio air right now, watch smoke plumes move across the state, and check current air quality readings for Columbus, Cleveland, Cincinnati, Dayton, and every county in between. The data comes from the U.S. EPA AirNow network, the Ohio Department of Health air quality program, and NOAA satellite-based smoke transport models.
TL;DR Quick Answers
Is the air quality bad in Ohio today?
Check the live AQI map up top for current readings in your county. Anything above 100 means at least some Ohio residents should ease back on outdoor activity.
How does Canadian wildfire smoke reach Ohio?
Boreal forest fires in Quebec, Ontario, and the western Canadian provinces release smoke plumes that ride prevailing winds across the Great Lakes. A stalled low-pressure system can then trap that smoke over Ohio for days at a stretch.
What MERV rating filters wildfire smoke?
The U.S. EPA recommends MERV 13 or higher. MERV 13 catches most of the PM2.5 responsible for wildfire smoke health effects.
How do I check the Ohio AQI in my city?
The live map above shows county-level readings updated continuously. For hour-by-hour breakdowns in Cleveland, Columbus, Cincinnati, and Dayton, pull up AirNow directly.
Top Takeaways
Ohio is well inside the reach of Canadian wildfire smoke, and the 2023 season proved how badly it can hit even at more than 1,500 miles from the fires.
The dangerous particle in smoke is PM2.5, and it walks straight through the MERV 8 filters that most Ohio homes have installed by default.
The U.S. EPA recommends MERV 13 or higher during smoke events because MERV 13 catches the fine particles MERV 8 lets through.
Cleveland, Columbus, Cincinnati, and Dayton each respond to smoke on different timelines based on geography, with the Ohio River Valley cities seeing the longest-lingering effects.
Upgrading your HVAC filter before the next smoke event is the single most useful step an Ohio household can take.
Understanding Ohio's Wildfire Smoke Patterns
Ohio sits more than 1,500 miles from the boreal forests of central and eastern Canada, and for most of the state's history, that distance felt like protection. The 2023 fire season made it clear we don't get to rely on geography anymore. When wildfires across Quebec and Ontario throw up smoke plumes you can see from space, prevailing winds can drag the plume straight down the jet stream and into the Ohio River Valley. The Toledo area logged exceptional PM2.5 events on June 8, June 29, and July 17 of that year, with concentrations so high that Ohio EPA later petitioned the federal government to exclude those days from the state's regulatory air quality calculations.
The pattern repeats because the geography repeats. Canadian fires burn heaviest in spring and summer. A stationary low-pressure system can park over the Great Lakes for days at a time, and once a smoke plume meets that low, it gets pulled south into the Midwest until weather conditions release it. Ohio sits right in the path. We've watched smoke from fires more than 800 miles north of Cleveland settle at street level over the city in under 48 hours.
You can read more about how wildland fires behave on the wildfire Wikipedia overview. For real-time tracking across other states alongside this Ohio view, our parent live wildfire and smoke maps page covers the full continental United States.
Reading the Map and What PM2.5 Means
The colored bands on the map above come from the U.S. Air Quality Index. Green and yellow are the everyday colors, meaning good and moderate. Orange signals that people with asthma, heart conditions, or respiratory sensitivities should ease up on outdoor activity, and red extends that warning to everyone. Purple and maroon are the categories you don't want to see overhead, especially with kids or older adults in the house.
The number driving each color is a PM2.5 measurement, which is the technical term for particles smaller than 2.5 micrometers across. For scale, one human hair is roughly 30 times wider than a PM2.5 particle. That tiny size is what makes wildfire smoke dangerous indoors. Particles small enough to slip through window screens and door gaps are also small enough to pass through standard HVAC filters and end up deep in lung tissue.
The U.S. EPA recommends MERV 13 or higher filtration during smoke events because MERV 13 captures more than 85 percent of particles in the 1 to 3 micrometer range, which covers most of the PM2.5 in wildfire smoke. MERV 8, the rating that ships in most new Ohio homes, captures around 20 percent of those same particles. During a smoke event, that gap between ratings is what determines whether your living room smells like a campfire or feels normal.
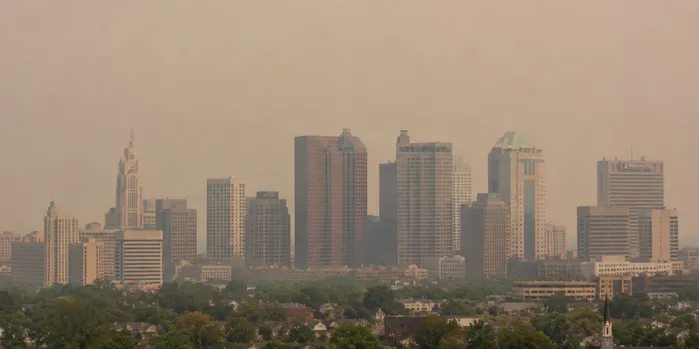
Air Quality in Ohio City
Cleveland and Cuyahoga County consistently land in Ohio's most pollution-impacted bracket. The American Lung Association's 2026 State of the Air report graded the Cleveland metro F for short-term particle pollution, and the 2023 Canadian wildfire season is one of the reasons that grade slipped as far as it did. Lake Erie pulls some moisture out of incoming air, but it doesn't filter PM2.5, so when smoke arrives, it tends to stay.
Columbus typically reads cleaner than the lakeshore on a normal day. That flips during smoke events, because Franklin County's traffic baseline and population density add to whatever the plume brings in. Readings can climb hour by hour as the smoke and the morning commute stack on top of each other.
Cincinnati sits in a topographic bowl that traps air. When a smoke plume drops into the Ohio River Valley, it lingers longer than it does on the open plains north of Columbus. Hamilton County residents tend to feel the worst of it two to three days after smoke first reaches the state, by which point Cleveland and Columbus may already be clearing.
Dayton runs on the same valley geography on a smaller scale. Smoke events affect Montgomery County on roughly the same timeline as Cincinnati, with peaks a little lower because the city's emissions baseline is smaller.
We've worked with families during major smoke events for years, and there's one thing I see again and again. The households that feel safe inside on a bad air quality day didn't get lucky. They upgraded their filter rating before the smoke showed up. A MERV 13 in a system designed to handle it does the quiet work of keeping the particles outside. You don't notice it. That's the whole point.
— Filterbuy Team
Essential Resources
If wildfire smoke is affecting your area, the resources below can help you track air quality conditions, understand potential health risks, and make better decisions about protecting your home and indoor air. Each source offers a different perspective, including real-time smoke maps, public health guidance, wildfire forecasting, and air quality research.
The federal AirNow team's own walkthrough of the Fire and Smoke Map, the AQI dial, and the interactive map layers. This is the same dataset feeding most state-level wildfire smoke trackers, including the map at the top of this page. Worth bookmarking on your phone.
Source: Using AirNow During Wildfires | U.S. EPA AirNow program
The American Academy of Pediatrics' plain-language wildfire guide was written for parents. Covers why kids are more vulnerable to PM2.5 than adults, the early symptoms to watch for, age-appropriate mask sizing, and how to set up a clean room in the house during a smoke event. Useful for any Ohio household with kids at home.
Source: Wildfires: What Parents Need to Know | American Academy of Pediatrics
CDC's step-by-step guide for protecting yourself before, during, and after a smoke event. The clean room instructions are practical enough to actually follow. If you've never set one up, this is the right starting point.
Source: Safety Guidelines: Wildfires and Wildfire Smoke | Centers for Disease Control and Prevention
NOAA's explanation of how satellite data drives the smoke forecast models you see on the map above. Worth reading once if you've ever wondered why some smoke forecasts hit, and others miss. The HRRR-Smoke model is the workhorse behind the curtain.
Source: Wildfire Smoke and Air Quality | NOAA NESDIS
County-by-county air quality grades for every part of Ohio. You can pull up your own county and see how the 2023 wildfire season pushed the short-term particle pollution grade. Useful for current readings and historical context.
Source: State of the Air: Ohio Report Card | American Lung Association
FEMA's plain-language guide to wildfire preparedness for households. Covers what to do before, during, and after a wildfire event: clearing flammable materials within 30 feet of the home, designating a sealed indoor room for smoke days, building an emergency supply kit with N95 masks, and what to wear during outdoor cleanup. Useful for any Ohio household that wants a single federal reference page on wildfire readiness.
Source: Wildfires Preparedness Guide | FEMA Ready.gov
The international air quality recommendations. WHO sets its annual PM2.5 guideline at 5 micrograms per cubic meter, which is significantly stricter than the U.S. annual standard of 9. That gap matters when you're trying to decide what “moderate” actually means for your family.
Source: WHO Global Air Quality Guidelines | World Health Organization
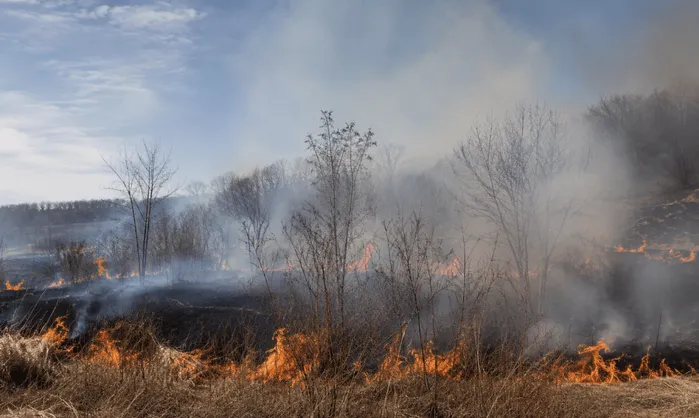
Supporting Statistics
The statistics below help explain why more Ohio households are paying closer attention to wildfire smoke, indoor air quality, and HVAC filtration during smoke season. Together, they show how wildfire smoke exposure is becoming a larger health concern across the Midwest and the United States.
Between 2007 and 2018, wildfire smoke was responsible for more than 25 percent of daily PM2.5 readings at roughly 40 percent of U.S. regulatory air monitors, and that pattern held for more than a month per year on average. The 2023 Canadian fires then pushed Midwest and Northeast readings well past what the regulatory system was built to handle on a routine basis.
Source: Health Effects Attributed to Wildfire Smoke | U.S. Environmental Protection Agency
Research published in Environmental Science and Technology found that people living outside the 5-kilometer radius of an EPA regulatory monitor experienced 36 percent more smoke impact days than people inside that radius. If you live in an Ohio county without dense monitoring coverage, the air you were breathing in 2023 was probably worse than the headline numbers showed.
Source: Wildland Fires Worsened Population Exposure to PM2.5 Pollution | NIH National Library of Medicine
NASA's GEOS atmospheric model recorded the summer 2023 Canadian wildfire season as the most intense on record. Smoke from fires in Alberta and Quebec traveled thousands of miles across North America. NASA's visualization tracks aerosol movement from May 31 through July 7, 2023, the window that hit eastern U.S. air quality hardest, including Ohio.
Source: Long-Range Transport of 2023 Canadian Wildfire Smoke | NASA Scientific Visualization Studio
Final Thoughts and Opinion
For most of the past several decades, Ohio was treated as a low-risk state for wildfire smoke, and that assumption is now outdated. The 2023 season set a new baseline for what a bad Canadian fire year can do across the Ohio River Valley, and climate trends point toward more frequent and more intense boreal fires. The smoke transport pattern that hit Toledo, Cleveland, and Cincinnati hard in 2023 will repeat.
Here's our straight take on this. Waiting for an air quality alert before upgrading your HVAC filter is the wrong sequence, because EPA AirNow issues alerts only after the smoke has already arrived. A MERV 13 installed ahead of the next event is what separates a smoke day you barely notice indoors from one where your house smells like a campfire for three days running. For most residential systems, swapping MERV 8 for MERV 13 costs a few extra dollars per filter and dramatically widens the protection your HVAC system gives you.
Next Steps
Bookmark this map and check it before outdoor activity on any smoke event day.
Pull your current HVAC filter and look for the MERV rating printed on the frame, right next to the size dimensions.
If you're running MERV 8 or below, plan the upgrade to MERV 13 before the next smoke event reaches Ohio.
Check whether your system can handle the higher rating. Most modern Ohio residential systems can. If yours is older, a portable HEPA air cleaner in the rooms you actually use is the right backup.
Sign up for EPA AirNow alerts in your zip code so the next event reaches your phone before it reaches your front porch.
Frequently Asked Questions
Don’t Wait Until Smoke Reaches Your Home
If you're reading this during an active Ohio smoke event, the most useful thing you can do right now is replace the filter in your HVAC system. If the smoke hasn't arrived yet, you've got a window to get ready. Either way, the filter sitting in your system today is what determines what your family breathes for the next 60 to 90 days.