
Peoria Real-Time AQI Tracker


Get Alerts For Unhealthy AQI In Your Area
When air quality in your area reaches unhealthy levels, we'll send you a quick alert, along with expert tips on how to reduce your exposure.
What's Actually In Peoria Air Today?
What High AQI Means for Your Lungs in Peoria
How to Read AQI
The Air Quality Index (AQI) measures how polluted the air is and how it may affect your health.
0–50 (Good): Air quality is satisfactory.
51–100 (Moderate): Acceptable, but some pollutants may pose minor concerns.
101–150 (Unhealthy for Sensitive Groups)
151–200 (Unhealthy)
201–300 (Very Unhealthy)
301+ (Hazardous)
Moderate
Still okay for most, but if you have asthma or allergies, take it easy and avoid long outdoor workouts.
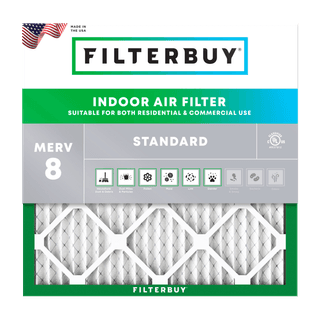
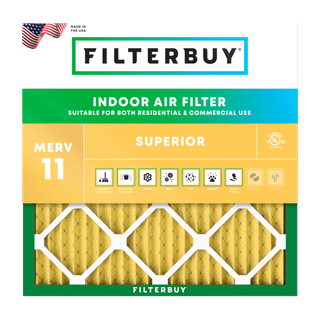
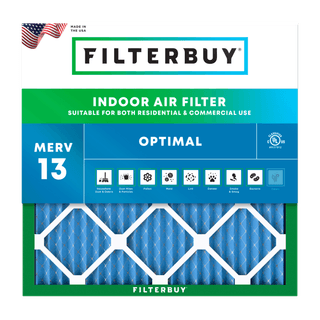
Shop MERV 11 filters→What's the Right Filter for Your AQI Level?


Check Today's Live Real Time Air Quality Index AQI Map in Peoria, AZ Now
By Michelle Wan, Brand Manager and Air Quality Writer. Technically reviewed by David Clark, Licensed HVAC Technician. Published August 4, 2026. Updated August 4, 2026.
Peoria's air quality changes by the hour, and the number that matters sits on the map above your ZIP code. Ozone peaks on hot afternoons spring through early fall, fine particles on still winter evenings and during monsoon dust. Filterbuy manufactures pleated filters in Talladega, Alabama, and built this page to show how to read that number and act on it.
TL;DR
The live air quality index for Peoria, AZ appears on the map at the top of this page, searchable by ZIP code. Peoria sits in Maricopa County, which the EPA designates Moderate nonattainment for ozone. Above 100 warrants caution for sensitive groups, above 150 for every household.
Key Takeaways
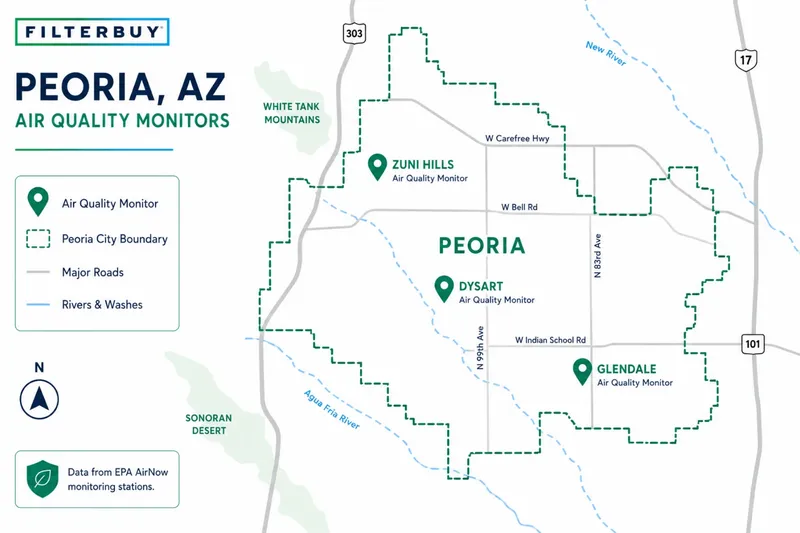
Peoria has no regulatory air monitor at its center. Maricopa County reports it from the Zuni Hills, Dysart, and Glendale sites, so apps disagree.
The standard AQI uses rolling averages, so it can read green in the first minutes of a dust storm. Maricopa County publishes NowCast values instead.
Maricopa County averaged 58.2 unhealthy ozone days per year, an F grade in the 2026 American Lung Association State of the Air report.
A correctly sized MERV 13 filter, seated properly and changed on time, is a household’s most direct control over indoor particles.
What Is The Air Quality In Peoria, AZ Right Now
Read the live AQI above for your ZIP code, then check which pollutant drives it. Readings differ between south Peoria near Olive Avenue and north Peoria near Lake Pleasant Parkway across ZIP codes 85345, 85381, 85382, and 85383, and shift within an hour. ADEQ forecasts county air daily and sends advisories by email and text. Peoria sits inside the Phoenix-Mesa ozone nonattainment area.
Why Your Peoria AQI Reading Can Lag Behind The Air Outside
Your reading lags because the AQI averages readings over time rather than reporting the current minute, using an 8-hour window for ozone and 24 hours for particles. During a haboob up the Agua Fria corridor, PM10 spikes while the AQI still reads green, then stays red long after the dust passes.
Maricopa County publishes NowCast values on its WebMap instead, weighted toward recent hours. Until the map catches up, trust your eyes. If a brown wall approaches, close the windows and switch the HVAC fan to circulate.
I check AQI maps across every market Filterbuy covers, and Peoria taught me to stop trusting a single number. During a haboob the reading can sit green while the dust wall is visible from your driveway.
Michelle Wan, Brand Manager and Air Quality Writer, Filterbuy
The Three Air Monitors That Set Peoria's AQI Reading
Peoria hosts no regulatory monitor at its population center. Filterbuy mapped the Maricopa County monitoring network against the city boundary and found three sites close enough to shape what apps report as Peoria air quality. That is why AirNow, IQAir, and a weather app each show a different number at once. Each interpolates from a different monitor across 138 square miles.
Cross streets and AQS codes per the Maricopa County Air Quality Department.
Low-cost sensors also stop below 0.3 microns, so ultrafine particles smaller than PM2.5 never register.
Peoria's Two Pollution Seasons And What Drives Each One
Filterbuy tracks two air quality problems in Peoria, running on separate calendars and calling for different responses. The Phoenix-Mesa report card grades Maricopa County F on both.
ADEQ issues High Pollution Advisories, MCAQD declares No Burn Days under Ordinance P-26, and the NWS issues Dust Storm Warnings.
On a declared No Burn Day, Maricopa County prohibits wood burning in fireplaces, chimineas, and outdoor fire pits. The restriction is mandatory at Peoria addresses. See the residential burning rules.
What Each AQI Level Means For A Peoria Household
Each AQI band carries a different instruction, from open windows at Good to indoor-only above 200. The band Peoria hits most often is 101 to 150, Unhealthy for Sensitive Groups, reached on roughly 58 ozone days and 9 particle days a year. Readings above 300 are rare here and covered in our guide to the Hazardous AQI range.
Thresholds follow the EPA Air Quality Index scale. MERV 13 is not HEPA.
How To Protect Your Indoor Air When Peoria AQI Climbs
Fine particles come through gaps around doors and windows, making your return filter the real point of control. Skip candles and indoor smoking, and change the filter early, because Peoria dust loads it faster than the calendar suggests. Outside, check which respirator actually helps and follow National Weather Service dust storm driving guidance.
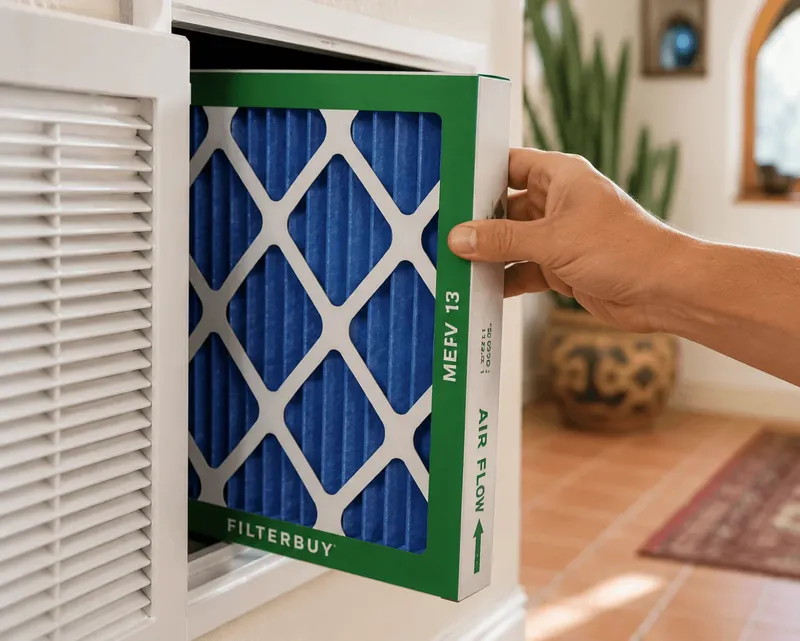
The EPA recommends MERV 13, or the highest rating your system accepts, on smoke and high particulate days. MERV 13 captures much of PM2.5, though it is not HEPA. Read how MERV ratings are measured, and note that older Peoria systems are often better served by MERV 11 pleated filters. One limit applies to every rating. Ozone is a gas, so no MERV filter removes it, and on the roughly 58 unhealthy ozone days a year the lever is shorter outdoor time. Filters earn their keep on dust and smoke days.
Filterbuy makes MERV 13 pleated filters in over 600 sizes. If your return is not a stocked size, build a custom size. The air filter sizes chart lists nominal against actual dimensions.
Peoria residents can compare readings against the Phoenix metro AQI map. Our explainer on what drives a bad air day covers the mechanics.
MERV 13 suits most Peoria homes, but not every one. Plenty of housing out here was built around a fiberglass panel, and if the blower was never sized for that static pressure you feel it as weak airflow, not cleaner air. Check the spec on a clear day in May, not at nine at night with dust on the windows.
David Clark, Licensed HVAC Technician, Technical Reviewer
If You Run A Swamp Cooler, This Advice Changes
A swamp cooler pulls outdoor air inside continuously, so on a high AQI day it works against everything above. These units need windows or vents open, and that air never reaches your return, where a Filterbuy filter sits. The pads are its only filtration.
The EPA advises against running one when outdoor pollution is high unless it carries a high-efficiency filter. On a dust or ozone day, switch to refrigerated AC or shut the cooler down and close its vents. Watch the pads through monsoon, since standing water grows mold that feeds the same air stream. Read the EPA guidance on evaporative coolers before the next high pollution day.
About The Author And Reviewer
Michelle Wan is Filterbuy’s Brand Manager and Air Quality Writer, covering air quality for Filterbuy’s resource library. David Clark, Licensed HVAC Technician, reviewed it.
Expert Perspective From Filterbuy
After manufacturing filters for over a decade and serving more than two million households, we have learned the Peoria families who handle dust season best stocked a spare in May. It costs the same then as at 6 p.m. during a haboob.
David Heacock, Founder and CEO, Filterbuy
Seven Sources Every Peoria Household Should Bookmark
Learn Why Your Current Reading Differs From The Daily Forecast
Three numbers get confused constantly. The daily AQI, the next-day forecast, and the hourly NowCast all measure different things, and the EPA explains which is which. That distinction accounts for most of what looks like disagreement between Peoria air apps.
Source: https://www.airnow.gov/aqi/aqi-basics/using-air-quality-index
See Which Monitor Is Reporting Your Neighborhood’s Air
Maricopa County runs the live WebMap and explains why averaged AQI values lag during fast-moving dust events. This is the closest thing Peoria has to an official local reading.
Source: https://www.maricopa.gov/1643/Air-Quality-Status-and-Monitoring
Get Tomorrow’s Pollution Forecast Before You Plan Outdoor Time
ADEQ meteorologists issue next-day ozone and particulate forecasts for Maricopa County. High Pollution Advisories arrive by email or text once you subscribe.
Source: https://azdeq.gov/forecast
Understand What PM2.5 And PM10 Actually Do In Your Lungs
Particle sizes and their health effects, in plain language. Use it to judge whether a Peoria reading justifies changing your plans.
Source: https://www.epa.gov/pm-pollution/particulate-matter-pm-basics
Check Whether Your Household Falls Into A Sensitive Group
The CDC names who reacts hardest to ozone and particle pollution. Children, adults over 65, and people with asthma, COPD, heart disease, or diabetes all appear on that list. Check it before deciding whose plans change.
Source: https://www.cdc.gov/air-quality/pollutants/index.html
Know What To Do When A Haboob Reaches Your Street
The National Weather Service Phoenix office covers monsoon hazards and the exact dust storm driving procedure. Peoria sits in the path of thunderstorm outflow winds from June through September.
Source: https://www.weather.gov/psr/MonsoonSafety
Track Long-Term Air Quality Trends Across The West Valley
Monitoring data tools and nonattainment boundary maps for Maricopa and western Pinal counties, published by the Maricopa Association of Governments. The trend lines show whether conditions near Peoria are improving.
Source: https://azmag.gov/Programs/Maps-and-Data/Air-Quality
Supporting Statistics
Maricopa County Averages 58 Unhealthy Ozone Days Every Year
The American Lung Association graded Maricopa County F on both pollutants in its 2026 State of the Air report.
58.2 unhealthy ozone days per year, an F grade
8.7 unhealthy short-term particle days per year, an F grade
Phoenix-Mesa ranks 4th worst in the nation for ozone
Source: https://www.lung.org/media/press-releases/fy26-sota-arizona
Dust Storms Drive Measurable Spikes In Arizona Emergency Room Visits
Researchers matched National Weather Service dust storm reports to patient ZIP codes across three states.
33,500 emergency department visits analyzed
Data drawn from Arizona, California, and Utah state health departments
Dust storms linked to visits for asthma, culture-negative pneumonia, and motor vehicle accidents
Source: https://pmc.ncbi.nlm.nih.gov/articles/PMC11822549/
More Than 730,000 Arizonans Live With Asthma
The Arizona Department of Health Services published updated state asthma figures in June 2025.
730,262 children and adults living with asthma in 2023
Adult lifetime prevalence of 15.2 percent in Arizona against 14.3 percent nationally, 2017 through 2021
Maricopa County adult asthma prevalence between 9.0 and 9.4 percent
Source: https://www.azdhs.gov/documents/prevention/chronic-disease/az-asthma-burden-report.pdf
Frequently Asked Questions About Peoria Air Quality
Glossary Of Peoria Air Quality Terms
AQI (Air Quality Index): The EPA’s 0 to 500 scale for outdoor air quality, in six color-coded categories.
NowCast: A weighted calculation emphasizing recent hourly readings, used by Maricopa County to track conditions faster than the averaged AQI.
PM2.5: Fine inhalable particles 2.5 micrometers and smaller, able to reach deep lung tissue and the bloodstream.
PM10: Coarse inhalable particles 10 micrometers and smaller, from road dust, construction, and wind-lifted soil.
Evaporative cooler: A swamp cooler, drawing outdoor air through wet pads and pushing it indoors through open windows or vents.
Haboob: A dust storm from monsoon thunderstorm outflow winds, able to drop visibility to near zero.
High Pollution Advisory (HPA): An ADEQ notice that pollution may exceed the federal standard, triggering a Maricopa County No Burn Day.
Nonattainment area: An EPA designation for a region exceeding a National Ambient Air Quality Standard.
MERV: Minimum Efficiency Reporting Value, the 1 to 16 scale for particle capture.