
PM1 and Ultrafine Particles: The Pollutants Smaller Than PM2.5
July 29, 2026
Author: Michelle Wan, Brand Manager and Air Quality Writer | Technically Reviewed By: David Clark, Licensed HVAC Technician | Published July 29, 2026. Updated July 29, 2026.
PM1 And Ultrafine Particles: What Your Air Filter Is Rated To Catch
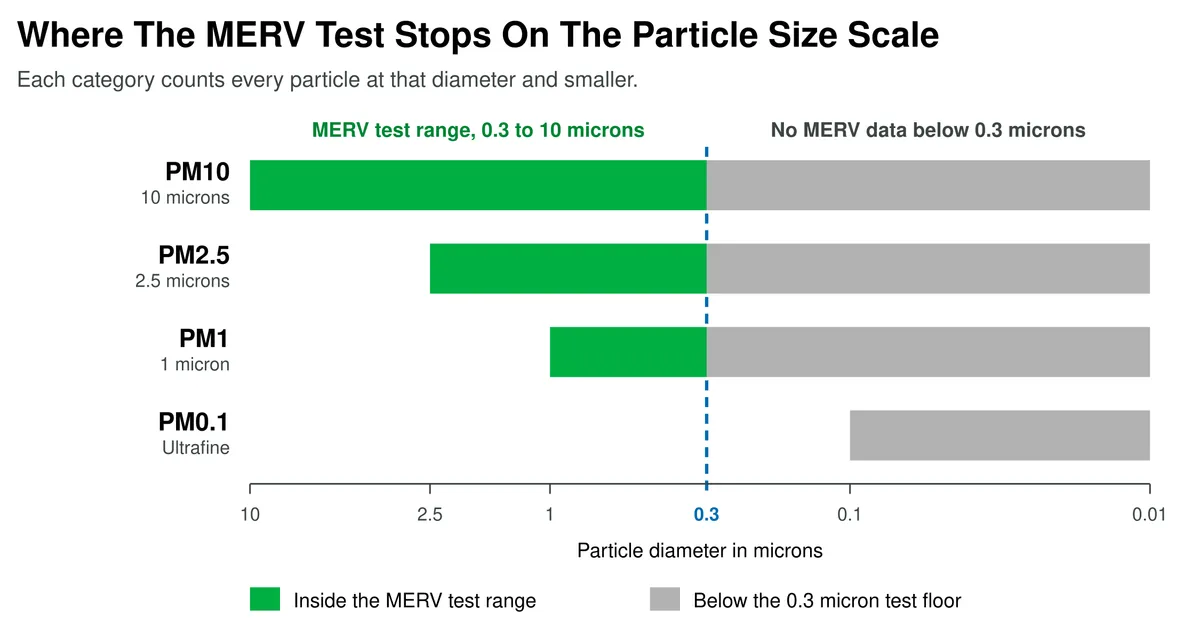
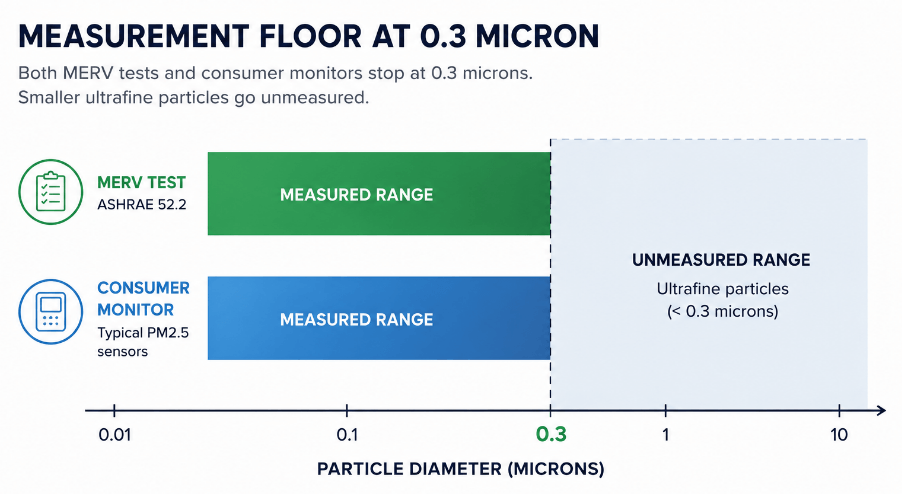
PM1 means particles 1 micron and smaller. Ultrafine, written PM0.1, means 0.1 micron and smaller, one tenth that size. The MERV test that produces the number on your filter measures down to 0.3 microns, so it covers most of the PM1 range and none of the ultrafine range. Ultrafine particles still get filtered. No MERV rating certifies what happens below 0.3 microns.
Here is what each rating is measured to capture in the 0.3 to 1.0 micron band, the part of the MERV test that speaks to PM1.
- MERV 8: larger debris, dust, and dust mites. The standard sets no requirement in the 0.3 to 1.0 micron band.
- MERV 11: finer particles like pet dander and mold spores. First rating with a measured floor in that band, at 20 percent.
- MERV 13: microscopic particles, the highest common residential filtration. Captures at least 50 percent in that band, the EPA recommended minimum.
- Odor Eliminator: activated carbon for odor reduction.
Answer 3 quick questions and we will match you to the rating your system can pull air through.
Know your size already? Shop pleated filters made in Talladega, Alabama, in more than 600 sizes.
TL;DR
Ultrafine particles have their own name because they are their own category. PM1 covers everything at or below 1 micrometer. Ultrafine, written PM0.1, is ten times smaller. Both slip past the coarse filters most homes run.
Key Takeaways
PM1 and ultrafine particles are not synonyms. PM1 means 1 micrometer and smaller, ultrafine means 0.1 and smaller. Neither carries a federal standard or appears in your AQI reading.
The MERV scale stops at 0.3 micrometers. MERV 8 through 10 carry no requirement in the 0.3 to 1.0 micrometer band, and MERV 13 is the first common residential rating required to capture half of it.
Consumer monitors stop at that same 0.3 micron floor, so a PM1 readout is not true PM1.
Smaller does not always mean harder to filter. Below 0.3 micrometers, Brownian motion pushes particles into fibers and efficiency climbs.
You already know to watch PM2.5. Then a monitor mentions PM1, or ultrafine particles, or nanoparticles. A smaller number sounds worse, and in several respects it is. What almost no one explains is that these terms describe different things, and only one relates to the rating on your filter.
What Are PM1 And Ultrafine Particles
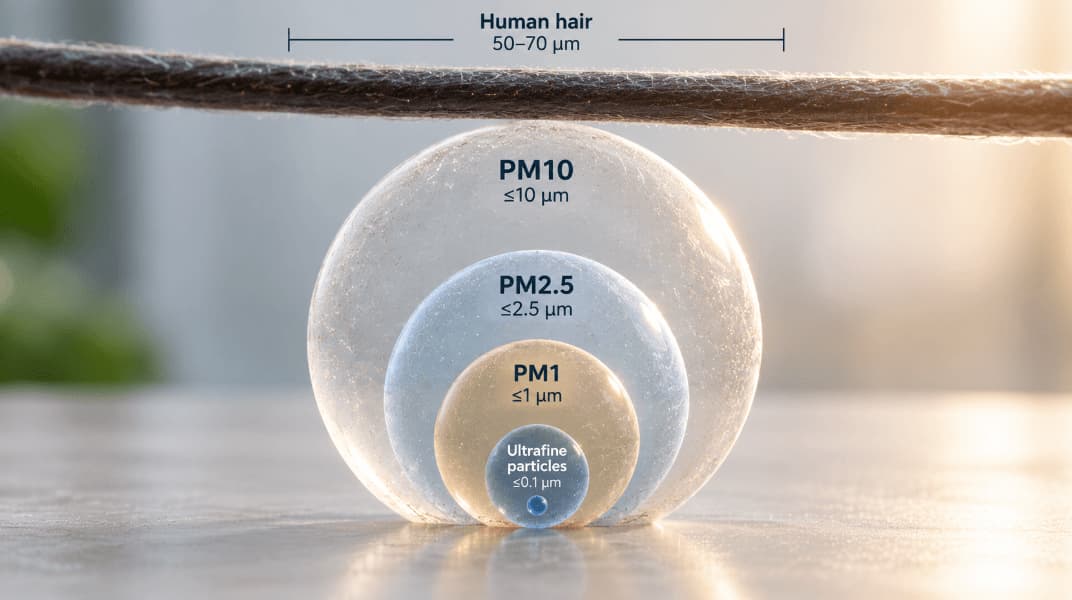
PM1 means airborne particles 1 micrometer in diameter or smaller. Ultrafine particles, abbreviated PM0.1, measure 0.1 micrometers or smaller. Every ultrafine particle is also PM1, but most PM1 is too large to qualify.
Categories nest, each counting everything below. For the middle tier, see what PM2.5 is and how it is measured.
Table 1. Particle Size Hierarchy
Each category counts every particle at that diameter and below, so PM10 readings always run higher than PM2.5 in the same air.
The two behave differently. PM1 moves with the airstream. Ultrafine particles are small enough that air molecules knock them around, a random drift called Brownian motion that makes them behave like a gas.
Why Particles This Small Do More Damage
Smaller particles travel deeper and clear more slowly. Research reviewed by the National Institutes of Health links ultrafine exposure to cardiovascular disease, respiratory illness, diabetes, and neurological effects. Larger particles stop in the nose and upper airway. Anything below roughly 1 micrometer reaches the alveoli, and the American Lung Association reports the smallest cross into the bloodstream from there.
Evidence here is thinner than for PM2.5, since regulators do not monitor these particles. Experimental work suggests higher toxicity per unit mass, while population studies show associations closer to PM2.5. When measured pollutants spike, see hazardous air quality above AQI 301 covers what to do.
Where Ultrafine Particles Come From Inside Your Home
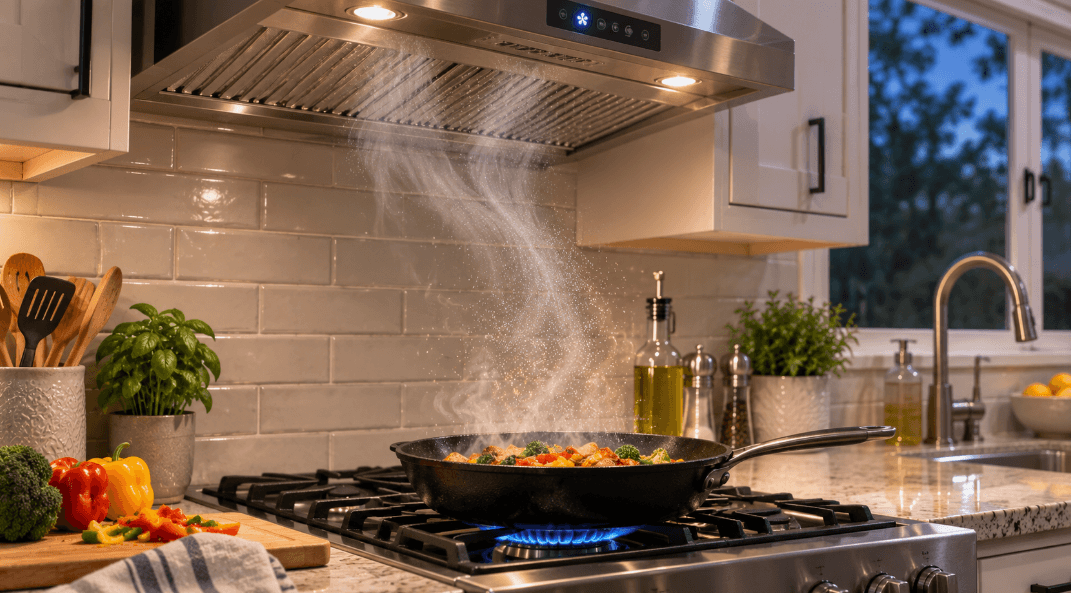
Combustion produces ultrafine particles, and most homes run several sources daily. The California Air Resources Board names gas stoves, wood burning, candles, and tobacco smoke among the major indoor sources. Cooking generates them even on an electric range.
Frying, searing, self-cleaning oven cycles
Wood stoves, fireplaces, backdrafting smoke
Candles, incense, diffusers
Laser and 3D printers
Pine or citrus cleaners reacting with ozone
Traffic exhaust through the building envelope
The EPA notes people spend 90 percent of their time indoors, so indoor concentration decides exposure. Infiltration hits hardest in the metros with the worst particle pollution.
What Your Filter Actually Does About Submicron Particles
The MERV scale rates filters across three size bands. The smallest, E1, spans 0.3 to 1.0 micrometers, covering most of the PM1 range and none of the ultrafine range. A rating says something real about PM1, nothing about PM0.1.
ASHRAE Standard 52.2 defines the test, and the worst measured result sets the rating. For the wider picture of how MERV ratings are assigned, we cover the full scale separately.
Table 2. The MERV E1 Reality Table
Source: ANSI/ASHRAE Standard 52.2. The E1 band spans 0.3–1.0 microns and does not reach the ultrafine range below 0.1 microns.
A MERV 8 filter is not weak in the PM1 range. It is untested there. The standard sets no E1 floor below MERV 11, which is why the EPA advises MERV 13. Filterbuy’s MERV 13 air filters meet that E1 threshold.
What The Rating Does Not Tell You About Month Three
Better heard from a manufacturer than found out yourself. Most pleated residential filters, Filterbuy’s included, use charged synthetic media. That charge works hard in the E1 band, and ASHRAE knows it fades. Appendix J of Standard 52.2 measures how much submicron efficiency a charged filter loses in service. Running it is optional.
So the MERV number on any brand’s box is a clean-filter number, honest about the media at test velocity in a test duct, not a promise about month three in your return. That is the best argument we know for changing filters on schedule rather than waiting until one looks dirty, because the efficiency you lose is invisible long before the media looks dirty.
The Point Where Smaller Stops Meaning Harder
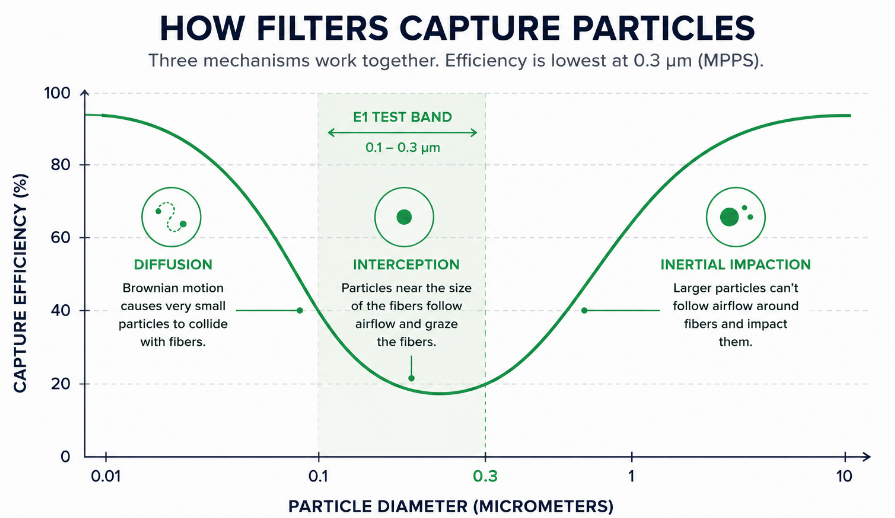
Filtration does not work like a sieve. Media capture particles three ways at once. Impaction catches large ones with too much momentum to curve around a fiber. Interception catches mid-size ones drifting within a fiber radius. Diffusion catches the smallest, driven into fibers by Brownian motion.
Impaction strengthens as particles grow, diffusion as they shrink. Between them lies a valley where both run weak, at roughly 0.3 micrometers, the most penetrating particle size. HEPA tests there for exactly that reason. Weighing a portable unit? We compare HEPA filters in a home HVAC system against furnace-mounted media.
So a filter capturing 0.3 micron particles well generally captures 0.05 micron particles better. Ultrafine particles do get filtered. The MERV test stops before it can tell you so.
Why The PM1 On Your Monitor Is Not Quite PM1
If a monitor sent you looking for this page, that reading deserves a caveat. Consumer monitors use laser scattering, and most bottom out at 0.3 microns, the same floor as the MERV test. The PM1 channel really counts 0.3 to 1.0 micron particles. Useful, but not full PM1 mass, and silent below 0.1 microns.
The test that rates your filter and the sensor on your shelf were built by different industries for different reasons, and they share one blind spot. Anyone selling certainty about ultrafine particles at home is past the edge of what either measures.
After manufacturing filters for over a decade and serving more than two million households, I can tell you the near-highway complaints that reach me are almost always about a smell, and a smell is a gas our pleated media was never built to catch. I would rather tell that homeowner to seal the road-facing wall than sell a rating that cannot touch nitrogen dioxide.
— David Heacock, Founder and CEO, Filterbuy
How To Lower Your Exposure
Source control beats filtration. Filtration handles the rest.
Vent at the source. Run a hood that exhausts outdoors when you cook. CARB flags ductless hoods as ineffective, since they return air to the room.
Raise the MERV rating. Move to MERV 13 if the system allows, back to MERV 11 if airflow suffers. Our guide to which MERV rating fits your system covers the tradeoff. Seat it snugly, since air traveling around a filter undoes the rating.
Run the fan. Filters work only while air moves, and systems run under a quarter of the time. During pollution events check how often to change your filter when the AQI is high.
Add a portable unit for the room you use most, or build a Corsi-Rosenthal box from MERV 13 filters.
For local numbers, see the AQI scale from 0 to 500.
Essential Resources
1. Guide to Air Cleaners in the Home
U.S. Environmental Protection Agency. The federal filter recommendation.
Source: EPA guidance on choosing a filter
2. The Health Effects of Ultrafine Particles
Schraufnagel, 2020, NIH. Behind our health claims.
Source: Research on ultrafine particle health effects
3. ANSI/ASHRAE Addendum d to Standard 52.2-2017
ASHRAE. Defines the E1 band and Appendix J.
Source: Standard behind every MERV rating
4. Particle Pollution
American Lung Association. How the smallest reach the blood.
Source: Lung Association on particle pollution
5. Combustion Pollutants and Indoor Air Quality
California Air Resources Board. Indoor ultrafine sources.
Source: CARB on indoor combustion pollutants
6. Nanotechnology Frequently Asked Questions
CDC NIOSH. Origin of the 0.1 micron threshold.
Source: NIOSH on nanoparticle exposure
7. Air Quality Guide for Particle Pollution
AirNow. What to do at each AQI level.
Source: AirNow action guide
Supporting Statistics
1. In 2020, 61 percent of U.S. households used natural gas. U.S. Energy Information Administration.
Source: EIA data on residential natural gas use
2. People with asthma face greater risk from small particles. Asthma and Allergy Foundation of America.
Source: AAFA on pollution and asthma
3. NIOSH defines ultrafine particles as those below 0.1 micrometers. NIOSH criteria document.
Source: the NIOSH ultrafine particle definition
Frequently Asked Questions
Glossary
PM1. Particulate matter 1 micrometer and smaller. Submicron.
PM0.1. Particulate matter 0.1 micrometers and smaller. Ultrafine.
Micrometer. One millionth of a meter, also called a micron.
MERV. Minimum Efficiency Reporting Value, the 1 to 16 ASHRAE scale.
E1. The smallest MERV test band, 0.3 to 1.0 microns.
MPPS. Most penetrating particle size, near 0.3 microns.
Brownian motion. Random drift of tiny particles hit by air molecules.
Appendix J. Optional ASHRAE test for charged-media efficiency loss.
HEPA. High-Efficiency Particulate Air. 99.97 percent capture at 0.3 microns.