
Global Air Quality Rankings: Countries With The Best And Worst Air
August 5, 2026
By Michelle Wan, Brand Manager and Air Quality Writer, Filterbuy
Technically reviewed by David Clark, Licensed HVAC Technician, for accuracy on filtration and HVAC system compatibility
Published August 4, 2026. Updated August 4, 2026.
Rankings reflect calendar year 2025 data.
Global Air Quality Ranking By Country
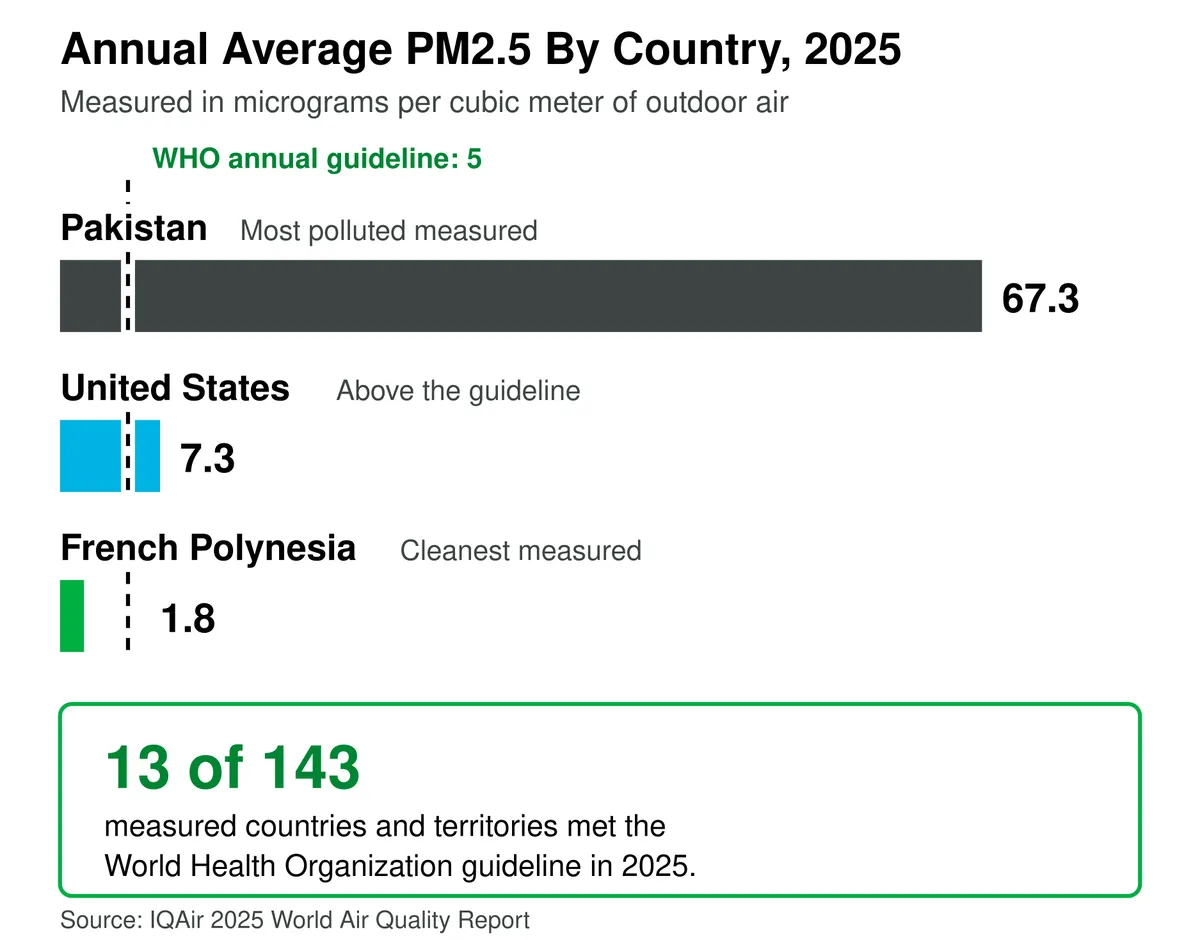
Pakistan recorded the worst national air quality of 2025 at 67.3 micrograms of PM2.5 per cubic meter, and French Polynesia recorded the cleanest at 1.8. Only 13 of the 143 countries and territories measured met the World Health Organization annual guideline of 5, and the United States was not one of them at 7.3.
Cleanest measured: French Polynesia, 1.8 micrograms per cubic meter
Most polluted measured: Pakistan, 67.3 micrograms per cubic meter
United States: 7.3 micrograms per cubic meter, ranked 120 of 143
A country average covers a full year of outdoor air across an entire nation, so it cannot tell you what you are breathing in your living room today. The filter in your heating and cooling system is the part you control.
Answer a few quick questions and we will match you to the right filter for your home.
TL;DR
Thirteen countries and territories met the World Health Organization annual PM2.5 guideline of 5 micrograms per cubic meter in 2025, while 130 of the 143 places measured exceeded it. Pakistan recorded the highest national annual average at 67.3 micrograms per cubic meter, and the United States averaged 7.3. More countries improved than worsened year over year, yet the share of world cities meeting the guideline still fell to 14 percent from 17 percent.
Key Takeaways
French Polynesia recorded the cleanest air of any place measured in 2025, averaging 1.8 micrograms of PM2.5 per cubic meter.
Pakistan, Bangladesh, Tajikistan, Chad, and the Democratic Republic of the Congo ranked as the five most polluted countries of 2025.
India placed sixth, leaving the five most polluted countries for the first time in the report’s eight-year history.
The United States annual average rose to 7.3 micrograms per cubic meter as wildfire smoke pushed regional levels higher.
Five of the six most polluted countries of 2025 recorded cleaner air than in 2024, so a worse rank does not mean worse air.
Global rankings cover only places with working monitors, so polluted countries vanish when monitoring stops.
Where The Global Air Quality Rankings Come From
The global rankings most readers encounter come from the IQAir World Air Quality Report, published annually by the Swiss air quality technology company IQAir. The 2025 edition, released in March 2026, draws on more than 40,000 monitoring stations across 9,446 cities in 143 countries and territories. IQAir ranks each place by annual average PM2.5, the fine particles small enough to reach deep lung tissue, and compares that figure against the World Health Organization guideline of 5 micrograms per cubic meter.
The World Health Organization sets the benchmark. IQAir does the measuring and the ranking. A country described as meeting WHO guidelines was measured against a WHO number, not ranked by WHO. Filterbuy refreshes this page each March, when the next edition publishes.
Which Countries Have The Cleanest Air In The World
Thirteen countries and territories met the WHO annual PM2.5 guideline in 2025. French Polynesia led at 1.8 micrograms per cubic meter, the lowest annual average anywhere in the report. Most qualifying places sit in the Caribbean, the Pacific, or the North Atlantic. Steady ocean air and very little heavy industry keep fine particle levels low across those regions.
Source: IQAir 2025 World Air Quality Report. All thirteen met the WHO annual PM2.5 guideline of 5 µg/m³.
Seven of the thirteen are sovereign countries. The other six are territories or overseas departments, which is why a cleanest-air list includes Bermuda and Réunion alongside Iceland.
Which Countries Have The Worst Air Pollution
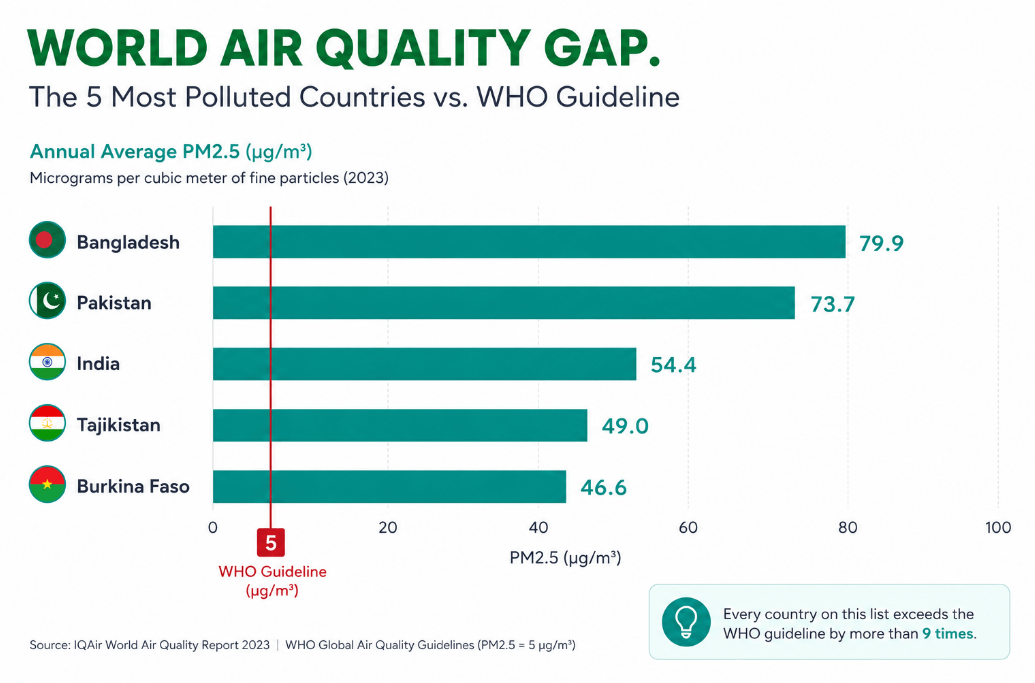
Pakistan recorded the worst national air quality of 2025, with an annual average PM2.5 concentration of 67.3 micrograms per cubic meter. Bangladesh, Tajikistan, Chad, and the Democratic Republic of the Congo completed the bottom five. India placed sixth, dropping out of the five most polluted countries for the first time since the ranking began eight years earlier.
Source: IQAir 2025 World Air Quality Report. Multiples are calculated against the WHO annual PM2.5 guideline of 5 µg/m³.
Which Direction Countries Moved Between 2024 And 2025
Of the 131 countries and territories measured in both years, 75 recorded cleaner air in 2025, 54 recorded dirtier air, and two held steady. More of the world improved than worsened. The share of cities meeting the WHO guideline still fell to 14 percent, because wildfire smoke pushed historically clean regions over the line.
The most polluted list tells the same counterintuitive story. Five of the six worst-ranked countries of 2025 had cleaner air than the year before. Pakistan became the world’s most polluted country while its own annual average dropped 8.7 percent. Chad cut its average by 41.6 percent and still finished fourth. Tajikistan was the only country in the top five that actually worsened, rising 23.8 percent. A rank moves when other countries move, so a rank describes a position, not a direction.
The steepest improvements came from Honduras at 58.6 percent, Panama at 52.5 percent, and El Salvador at 48.6 percent. The steepest increases came from Kazakhstan, Kuwait, and Kyrgyzstan, all above 40 percent.
Two of the thirteen places meeting the guideline recorded among the sharpest increases anywhere. Bermuda rose 52 percent to 3.8 and Grenada rose 46.9 percent to 4.7. Both still cleared the guideline. A place can hold a clean-air ranking while its air is getting worse, and the list will not separate those two cases for you.
Percentages calculated by Filterbuy from the 2024 and 2025 country averages in the IQAir World Air Quality Report, covering the 131 places reported in both years.
What A Country Air Quality Ranking Does Not Show
Here is the part of this report we think almost everyone reads wrong. A country ranking measures places with working air monitors. It does not measure a whole country. Burundi, Turkmenistan, and Togo all ranked among the thirty most polluted countries in 2024, then vanished from the 2025 report because no usable data existed. Their air was never reassessed and found clean. The monitoring simply stopped.
The monitoring picture shifted sharply in 2025. The United States State Department ended its global embassy and consulate air monitoring program in March 2025. The Centre for Research on Energy and Clean Air reported that the shutdown weakened monitoring in 44 countries and left six with no monitoring at all. Many had served as the only trusted public source of air quality data in their cities.
Monitoring density skews the city lists too. The 2025 report carried data from 259 Indian cities against 18 Pakistani cities, so India places far more entries in any global worst-cities list regardless of how the two countries compare on average.
IQAir does not treat this as a footnote either. Global Chief Executive Officer Frank Hammes called air quality “a fragile asset that requires active stewardship to protect public health.”
Where Other Major Countries Rank
Most of the 143 measured countries sit between the extremes. The table below ranks those readers ask about most, with rank 1 the worst measured air. All exceeded the WHO guideline.
A national figure describes a country, not a street. For your own area, use the live air quality index map for the United States, or follow our guide on how to check outdoor air quality today, built on the 0 to 500 Air Quality Index scale, which reports one day rather than a year.
A country average is a year of air compressed into one number, and nobody breathes an average. I pull AQI readings for American cities every morning, and the distance between a national figure and what a family actually breathes on a bad afternoon is where the real story sits. A country can clear the annual guideline and still have weeks when nobody should be outside. Read the ranking for context. Read your own ZIP code for a decision.
— Michelle Wan, Brand Manager and Air Quality Writer, Filterbuy
Where The United States Ranks And Why It Slipped
The United States recorded an annual average PM2.5 concentration of 7.3 micrograms per cubic meter in 2025, above the WHO guideline of 5 and higher than the previous year. Wildfire smoke drove most of that increase. Canada ranked as the most polluted country in Northern America during its second-worst wildfire season on record, and that smoke crossed into the Great Lakes states through the summer.
Seattle stayed the cleanest major American city for a second year at 4.5 micrograms per cubic meter. El Paso became the most polluted at 11.4, a 46 percent jump driven by pre-summer dust storms. Southeast Los Angeles ranked as the most polluted area in the country after wildland-urban interface fires.
The pattern matters more than those numbers. American air quality now moves with fire and dust rather than industrial output, so a clean annual average can hide weeks of hazardous days. Our guide to wildfire smoke and the air quality index covers what to do on those days.
What A National Average Means For The Air Inside Your Home
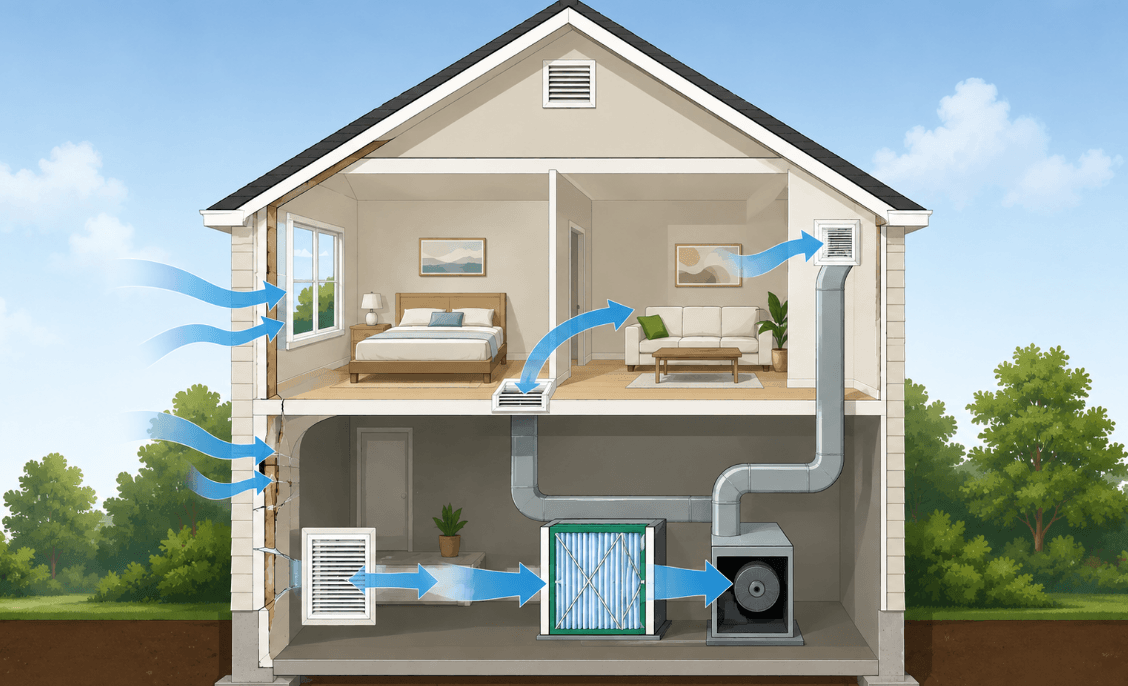
A national average tells you almost nothing about the air in one room. This is the part we spend our days on, because outdoor PM2.5 slips into a house through open windows and gaps in the building envelope, and through the fresh air intake on a heating and cooling system, then hangs there for hours where you cannot see it. The useful question is not where your country ranks. It is how much of that particulate your home removes before you breathe it.
The Centers for Disease Control and Prevention advises running heating and cooling systems on recirculate during smoke events and installing more efficient filters. A higher MERV rating captures a larger share of fine particles on each pass.
That is the part you control, and it is the reason we build what we build. Filterbuy manufactures pleated MERV 13 air filters in Talladega, Alabama, in more than 600 sizes. MERV 13 media captures far more small particles than the fiberglass panels many systems ship with. MERV 13 is not HEPA and does not remove gases. Confirm your system can handle the rating first. Our guides on why MERV 13 has become the baseline for healthier homes and on MERV 13 filter airflow and CFM ratings cover that decision.
Replace filters more often during smoke season than the label suggests, because wildfire particulate loads a filter early.
After manufacturing filters for over a decade and serving more than two million households, we have watched outdoor air events reshape what people expect from filtration. A wildfire two states away changes the air in a living room within a day.
— David Heacock, Founder and Chief Executive Officer, Filterbuy
Essential Resources
Particulate Matter (PM) Basics
The federal primer on what fine particulate is, where it comes from, and why the 2.5 micrometer threshold is the size that matters for health.
Source: United States Environmental Protection Agency
Air Quality Index (AQI) Basics
Explains how the 0 to 500 daily index works and what each color band means, which is the scale behind every local reading this page points you toward.
Source: AirNow
How Wildfire Smoke Affects Your Body
Details what wildfire smoke does inside the body and who faces the highest risk, which is the health context behind the 2025 increases across the United States and Canada.
Source: Centers for Disease Control and Prevention
Particle Pollution And What It Does To Your Lungs
Walks through the short-term and long-term effects of particle pollution on lung and heart function in plain language.
Source: American Lung Association
Measuring Particulate Matter From Space
Shows how satellites estimate ground-level PM2.5 across regions with no monitoring stations, the blind spot this page argues country rankings cannot see.
Source: NASA Goddard Space Flight Center
Protecting Indoor Air Quality During Wildfire Smoke Events
Practical guidance on keeping indoor air cleaner during a smoke event, covering filtration and ventilation steps for a typical home.
Source: National Center for Healthy Housing
Wildfire Statistics In Focus
A congressional briefing on United States wildfire acreage and cost trends, useful background for why American air quality now moves with fire.
Source: Congressional Research Service
Supporting Statistics
1. State of Global Air Report 2025
Air pollution contributed to 7.9 million deaths worldwide in 2023 and ranks as the second leading risk factor for early death.
Source: Health Effects Institute
2. Wildfire Smoke Impacts Respiratory Health More Than Fine Particles From Other Sources
A 10 microgram per cubic meter rise in wildfire-specific PM2.5 raised respiratory hospitalizations by 1.3 to 10 percent, compared with 0.67 to 1.3 percent for PM2.5 from other sources.
Source: Aguilera et al., Nature Communications, hosted by the National Institutes of Health
3. Wildland Fire Summary And Statistics Annual Report 2025
The United States recorded 77,850 wildfires burning 5,131,474 acres in 2025, with the total number of fires significantly above both the five-year and ten-year averages.
Source: National Interagency Fire Center
Frequently Asked Questions
Which Country Has The Cleanest Air In The World?
French Polynesia recorded the lowest annual average PM2.5 of any place measured in 2025, at 1.8 micrograms per cubic meter. Among sovereign countries, Barbados led at 2.6.
Which Country Has The Worst Air Pollution?
Pakistan recorded the highest national annual average PM2.5 concentration in 2025 at 67.3 micrograms per cubic meter, roughly thirteen and a half times the WHO annual guideline.
Why Do Some Countries Disappear From The Rankings?
Countries drop out when their monitoring data becomes unavailable. Three places that sat in the 2024 top thirty are missing from the 2025 edition for exactly that reason.
Can A Home Air Filter Help With Outdoor Air Pollution?
Yes, within limits. A higher-efficiency filter, such as a Filterbuy MERV 13, removes a portion of the fine particles that migrate indoors, and recirculate mode reduces how much outdoor air enters. Filtration does not address gases.
About The Author
Michelle Wan is Filterbuy’s Brand Manager and Air Quality Writer. She works directly with Filterbuy’s manufacturing teams across its Alabama, Florida, Pennsylvania, and Utah plants, so her guidance reflects how filters are built and used in real homes rather than spec sheets alone.
Published by Filterbuy, an American air filtration company manufacturing HVAC filters in the United States for over a decade.
Glossary Of Air Quality Terms
PM2.5. Fine inhalable particles 2.5 micrometers or smaller, the pollutant used to rank countries.
WHO annual PM2.5 guideline. The World Health Organization benchmark for long-term particulate exposure, set at 5 micrograms per cubic meter annually. A recommendation, not an enforceable law.
AQI. Air Quality Index, the United States 0 to 500 daily scale. AQI reports one day. Country rankings report a year.
IQAir. The Swiss company publishing the annual World Air Quality Report, the source of these rankings.
MERV. Minimum Efficiency Reporting Value, the 1 to 20 scale for how effectively a filter captures particles.
HEPA. High Efficiency Particulate Air, requiring capture of 99.97 percent of particles at 0.3 micrometers. MERV 13 is not HEPA.
Territory. A populated area governed by a sovereign state without being one. Six of the thirteen cleanest places are territories.
Monitoring station. A fixed instrument sampling outdoor air. A country without functioning stations cannot appear in a ranking.