
Yonkers Real-Time AQI Tracker


Get Alerts For Unhealthy AQI In Your Area
When air quality in your area reaches unhealthy levels, we'll send you a quick alert, along with expert tips on how to reduce your exposure.
What's Actually In Yonkers Air Today?
What High AQI Means for Your Lungs in Yonkers
How to Read AQI
The Air Quality Index (AQI) measures how polluted the air is and how it may affect your health.
0–50 (Good): Air quality is satisfactory.
51–100 (Moderate): Acceptable, but some pollutants may pose minor concerns.
101–150 (Unhealthy for Sensitive Groups)
151–200 (Unhealthy)
201–300 (Very Unhealthy)
301+ (Hazardous)
Moderate
Still okay for most, but if you have asthma or allergies, take it easy and avoid long outdoor workouts.
Shop MERV 11 filters→What's the Right Filter for Your AQI Level?
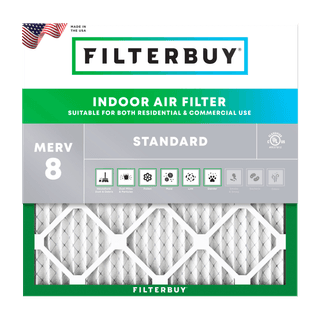
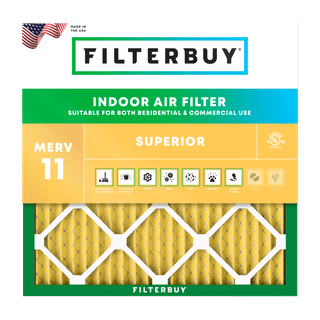
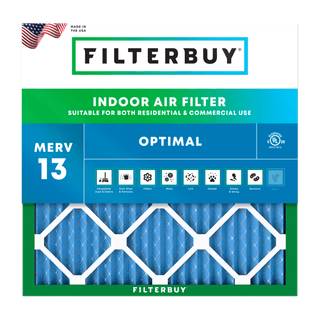
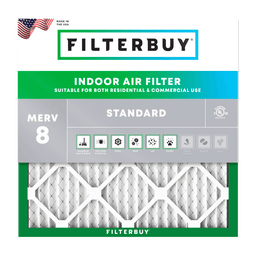
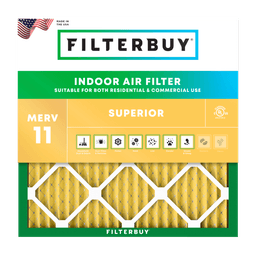
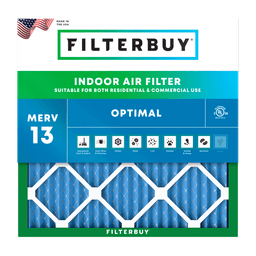

Check Today's Live Real Time Air Quality Index AQI Map in Yonkers, NY Now
What Is the Air Quality in Yonkers Today?
The live map at the top of this page shows the current Air Quality Index for Yonkers, New York, refreshed hourly from EPA AirNow and New York State DEC monitoring data. The AQI runs from 0 to 500 across six color-coded categories. Under 50 is Good, 51 to 100 is Moderate, and 101 to 150 is Unhealthy for Sensitive Groups. At 101 and above, the state issues a health advisory. Check the number, then check the Action Card below to see what it means for your household.
The AQI is the U.S. Environmental Protection Agency's scale for reporting daily air quality: a single number that rolls several pollutants onto one axis so you don't have to know what 35 micrograms per cubic meter feels like. The higher the number, the greater the health concern.
Filterbuy, an American air filter manufacturer that has built filters in the U.S. since 2013, maintains this map. We're not an air quality agency, and we'll point you to the ones that are. What we can tell you is what the number means once it's inside your house, which is the half of the story most AQI pages skip.
In Yonkers, the number is driven by two pollutants most of the year. Fine particulate matter (PM2.5), meaning soot, smoke and combustion particles small enough to reach deep into your lungs and cross into your bloodstream, dominates during wildfire smoke episodes and cold, still winter days. Ground-level ozone takes over on hot, sunny, stagnant afternoons in July and August, when tailpipe and industrial emissions cook in the sunlight.
Here's a Yonkers-specific detail that matters: Westchester County is part of the New York metropolitan area that remains in serious nonattainment of the federal ozone standard. That's not a Yonkers problem. It's a regional one. But it's why a hot August afternoon here can push past 100 with no smoke in the sky at all.
Where Does the Yonkers AQI Number Actually Come From?
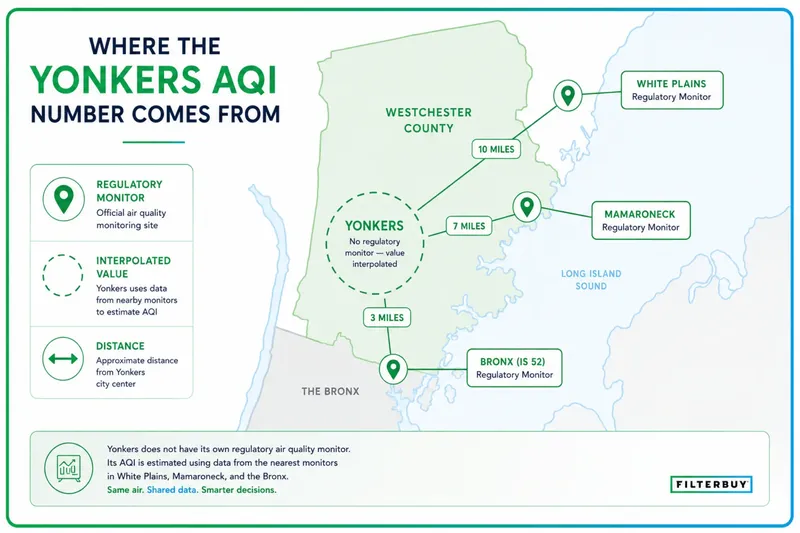
No regulatory air quality monitor sits inside the city of Yonkers. New York State's Westchester County monitoring stations are in White Plains and Mamaroneck, several miles northeast of the city. The AQI displayed for Yonkers, on this map and on every other one, is interpolated from those stations plus monitors in the Bronx and across the NYC metro area. It is a well-founded estimate for the area, not a reading taken on your street.
We'd rather tell you that than let you assume otherwise.
This isn't a flaw in the map. It's how the national AQI network works everywhere. The DEC operates more than 50 monitoring sites statewide with instruments calibrated against NIST and EPA standards, and the data meets strict federal requirements. But 50 sites cannot cover 54,000 square miles. Contoured AQI maps fill the gaps between monitors by interpolation, and AirNow says so plainly: contoured areas are approximate.
Source: New York State Department of Environmental Conservation and U.S. EPA AirNow. AirNow states that contoured map areas are approximate.
Why Your Weather App Shows a Different Yonkers AQI Than This Map
Because they're measuring different things and calling them the same word.
The DEC is explicit about this: the AQI is an 8-hour average for ozone and a 24-hour average for particulate matter, and alternative sources of real-time hourly air pollution data, online and on smartphone weather apps, should not be directly compared to the AQI, because most are short-term measurements rather than averages and may not be accurate.
So when your phone says 61 and this map says 95, neither is necessarily lying. One is reporting a moment; the other is reporting a rolling average. During a fast-moving smoke plume, the gap between them can be enormous. The hourly reading spikes and crashes while the 24-hour average lumbers along behind it. If you want the number that health advisories are based on, use the averaged AQI. If you want to know whether the plume has arrived in the last twenty minutes, watch the hourly.
The Yonkers Air Data Almost Nobody Knows Exists
From September 1, 2022 through August 31, 2023, the New York State DEC and its contractor Aclima drove sensor-equipped vehicles down every publicly accessible road in Mount Vernon, Yonkers and New Rochelle, at least 20 times each, across different seasons, days and hours, as part of the statewide Community Air Monitoring Initiative covering ten disadvantaged communities with high pollution burdens. The result is an annual air pollution estimate for every 100 meters of road.
You can open it right now: the Mount Vernon, Yonkers and New Rochelle story map is free, interactive, and published by the state. There is also a Yonkers fact sheet (PDF) and a map of the study boundary (PDF) if you want to check whether your street was included.
That is block-level Yonkers air data. It's the highest-resolution picture of this city's air that exists, it's public, and no other AQI page for Yonkers mentions it. It won't tell you about today, because it's an annual average from a completed study. But it will tell you something no live map can: which Yonkers you live in.
The Two Yonkers: Why Your Block Isn't the City Average
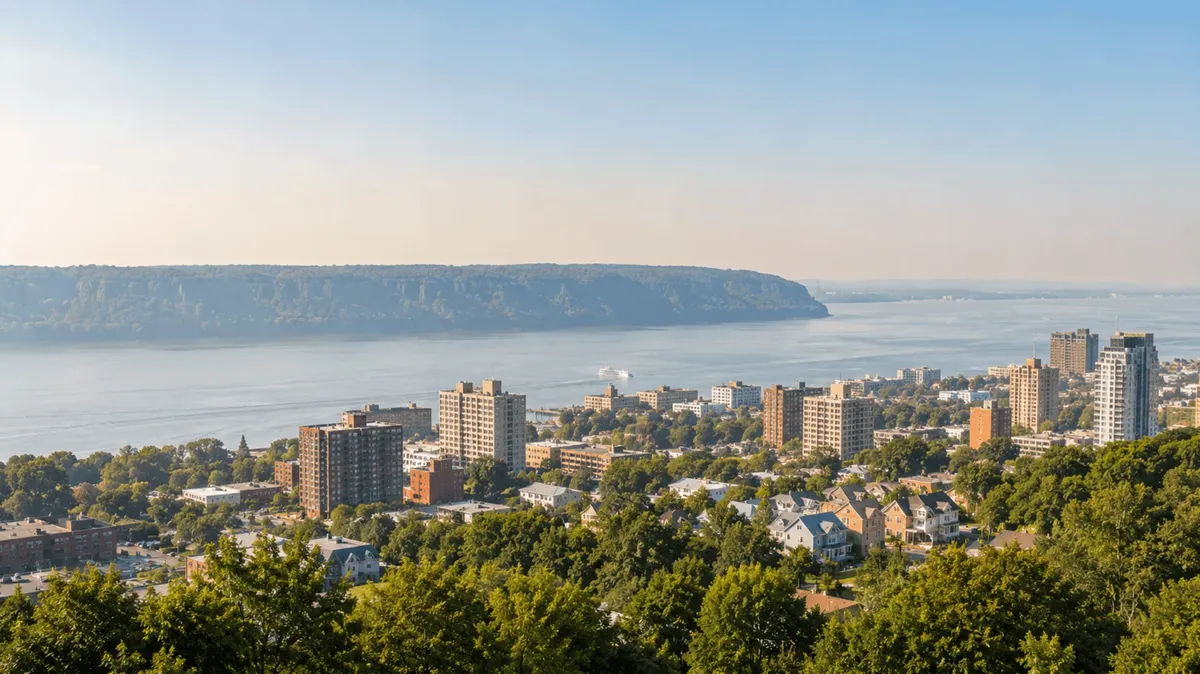
Yonkers is New York's third-largest city and the largest in Westchester County, spread across 20 square miles of hills between the Hudson River and the Bronx River. A single citywide AQI number flattens all of that. New York State's own street-level monitoring found that within Lower Westchester, pollution varies sharply by road. Two Yonkers households can share an AQI reading and not share an exposure.
The state's mobile monitoring study, published in the Journal of the Air & Waste Management Association in 2025, modeled roughly 107,000 road segments across the ten study communities. Two findings apply directly here.
Finding one: the truck corridors carry the soot. The highest black carbon concentrations aligned with the highest truck-volume roads in the New York City metro area, including in the Lower Westchester community. Meanwhile, high-volume roadways with commercial vehicle restrictions, the parkways, showed lower concentrations of both black carbon and PM2.5. In Yonkers, that's the practical difference between living along the Major Deegan (I-87), which carries heavy truck traffic, and living along the Saw Mill River Parkway or Bronx River Parkway, which don't allow commercial vehicles.
Finding two: ozone does the opposite. In Lower Westchester, ozone and nitrogen dioxide correlated negatively (r² = 0.47). Nitrogen dioxide was substantially elevated in highway areas, while the ozone impacts showed up in neighborhoods and residential areas downwind of and away from the highways. Ozone is formed, not emitted. It needs distance and sunlight to cook. So the quiet residential streets that escape the truck exhaust can catch more ozone.
Source: NYSDEC and Aclima street-level monitoring, published in the Journal of the Air & Waste Management Association, 2025.
One piece of good news, honestly reported: across the whole study, only 274 road segments (0.26%) modeled above the EPA's annual PM2.5 standard of 9 µg/m³, and none of them were in the Lower Westchester study area. No segment anywhere modeled below 4 µg/m³. Yonkers' year-round particle levels are not the crisis. Its spikes are.
So There's No Monitor in Yonkers. What Do You Actually Do About It?
This page opened by telling you the AQI here is interpolated, not measured on your street. That's a fair thing to point out and an unfair place to stop. Here's how to narrow the gap.
Treat the AQI as a regional floor, not a local reading. It's reliable for “is the whole area bad today.” It's weakest at “is my block worse than the average.”
Check the Fire and Smoke Map during smoke season, not just the AQI. It layers low-cost neighborhood sensors on top of the regulatory monitors. Those sensors are far denser than the official network, so it's the one place you may find a reading closer to you than White Plains. Trade-off, stated plainly: low-cost sensors are less accurate than regulatory instruments. When a nearby sensor and an official monitor disagree, the monitor is the better number, and the more cautious of the two is the better decision.
Use the state's block-level study for the part that doesn't change. It won't tell you about today. It will tell you whether your street runs hotter than the city average year-round, which the live map will never do.
Round toward caution when the number is borderline. An interpolated 95 in a city with no monitor is not meaningfully different from 105. If someone in your house is in a sensitive group, treat the edges as the worse case.
Trust your own eyes and nose over a borderline number. If the air smells like a campfire and the map says Moderate, the map is describing a 24-hour average, and you are describing right now. Here's why that gap exists.
The honest summary: the number at the top of this page is good enough to plan your day around and not precise enough to referee an argument about your block. Anyone telling you they have a live, monitor-grade reading for a specific Yonkers street is selling you a confidence that doesn't exist.
The Yonkers AQI Action Card: What to Do at Each Level
Find today's number on the map above, then find its row. The health guidance in this table follows the New York State DEC and Department of Health's official recommendations. The in-home column is our addition: the step most guidance skips, because “stay inside” only helps if the air inside is actually better.
Health guidance adapted from the New York State Department of Environmental Conservation and the New York State Department of Health. The in-home column is Filterbuy's addition.
Sensitive groups, as New York State defines them: children and teens, the elderly, pregnant people, people with lung or heart conditions, asthmatics, people who exercise or work outdoors, and people in disadvantaged communities.
When heat and smoke arrive together, the state's advice is to seek indoor spaces with air conditioning or filtration, or go to a cooling center. That combination is the scenario that sends people to the emergency room, and in the lower Hudson Valley, it has become the standard summer pattern rather than the exception.
What a Filter Manufacturer Sees That an Air Quality Map Can't
Filterbuy has built air filters in the United States since 2013, in plants in Alabama, Florida, Pennsylvania, and Utah, and shipped them straight to millions of households. That gives us one narrow, unglamorous view of a smoke event that no monitoring agency has: we can watch a city decide to do something about its air, in close to real time, by watching what it orders.
Here's what Filterbuy saw in June 2023, when Canadian wildfire smoke turned the sky over the Hudson Valley orange: Filterbuy's filter replacement requests across New York surged more than 300%. That number is ours. We published it on our New York wildfire and smoke map, and you won't find it in any government dataset, because no government agency sells filters.
But the number isn't the interesting part. The timing is.
That surge didn't start when the air changed. It started when the sky changed. The PM2.5 arrived over Westchester roughly a day before people could see it, and the orders followed the color, not the particles. By the time a Yonkers family went looking for a filter, they'd already been breathing the thing they were shopping for.
Filterbuy has watched this pattern repeat in every smoke-affected state it ships to. It is the single most consistent thing we know about how households respond to bad air, and it's why this page is built the way it is:
The map is at the top because the number changes before the sky does.
The forecast is tool #1, not an afterthought, because tomorrow's AQI is the one you can still act on.
The filter advice says “before smoke season, not mid-advisory” because we have seen what mid-advisory looks like from the order side, and it looks like people paying for shipping speed they shouldn't have needed.
One thing we're not going to pretend: nobody on this masthead lives in Yonkers. Filterbuy builds filters in Alabama, Florida, Pennsylvania and Utah, and this page was researched, not lived. What we bring isn't local residency. It's a decade of watching what happens inside houses after the AQI climbs, in every city we ship to, plus the willingness to tell you that the number at the top of this page isn't measured on your street.
How to Actually Keep Yonkers Air Out of Your House
Closing the windows is step one. Step two is what your HVAC system does with the air already inside, and that comes down to the filter. When outdoor AQI climbs above 100, run your central system's fan continuously in recirculate mode with a filter rated MERV 13 or higher. That combination is what turns “stay inside” into a real reduction in what you're breathing.
Here's the part most air quality pages skip, and it's the part we know best. Filterbuy has run pressure-drop tests across more than two million filters it manufactured itself, so what follows isn't a guess about how filters behave. It's what we measured.
Air conditioners and central HVAC systems don't clean air by existing. They move it. A system running on Auto only filters during a cooling cycle, which on a mild smoky day might be twenty minutes an hour. Switch the fan to On during an advisory and the system pulls your indoor air through the filter continuously instead of intermittently.
Then the filter has to be capable of catching what's out there. Wildfire smoke and traffic soot are PM2.5: particles under 2.5 micrometers, roughly 4% of the width of a human hair. A basic fiberglass filter is designed to protect the equipment from lint and hair, not to protect your lungs from smoke. It will pass PM2.5 straight through and back into your living room. MERV 13 is the rating where meaningful PM2.5 capture starts, which is why the EPA recommends it during wildfire smoke events. Our guide to what MERV ratings actually capture has the full scale.
One honest caveat, from David Clark, the licensed HVAC technician who reviewed this page: not every system should jump to the highest MERV number available. A filter that's too restrictive for your blower can reduce airflow, strain the system, and in older equipment cause more problems than it solves. We publish our own lab data on how much airflow each MERV level actually costs, so you can check the trade rather than take our word for it. If your system is aging or you've never checked, a quick look at your equipment's specs or a call to your HVAC tech is worth more than a guess. A properly sized MERV 13 in a healthy system is the right target for most Yonkers homes, and pleated construction matters as much as the number on the box.
Three things worth doing before the next plume, not during it:
Check what's in there now. Pull the filter. If you can't remember installing it, that's your answer.
Upgrade before smoke season, not mid-advisory. June through October is Yonkers' overlap of ozone season and Canadian wildfire season. Shop MERV 13 filters if your system takes them, or MERV 11 if it doesn't.
Stop relying on memory. Set up auto-delivery so the right filter arrives on schedule instead of the week after you needed it.
If you want to go further: HEPA versus MERV explains why your HVAC can't take a true HEPA filter, and how to build a Corsi-Rosenthal box covers the cheap DIY air cleaner worth having before the next plume.
If You Don't Have Central Air, Which in Yonkers Is Likely
Most of the advice on this page, and on every other air quality page you'll read today, quietly assumes you own a house with ducts and a return vent. Yonkers isn't that city. Census figures put owner-occupancy here at roughly 46%, so most Yonkers households rent, and the median Yonkers home was built in 1958, decades before central air conditioning was standard. If you heat with radiators and cool with a window unit, “set your HVAC to recirculate” is advice for somebody else's home.
Here's what actually works in an apartment, a two-family, or any of the older housing stock across southwest Yonkers, in the order we'd do it.
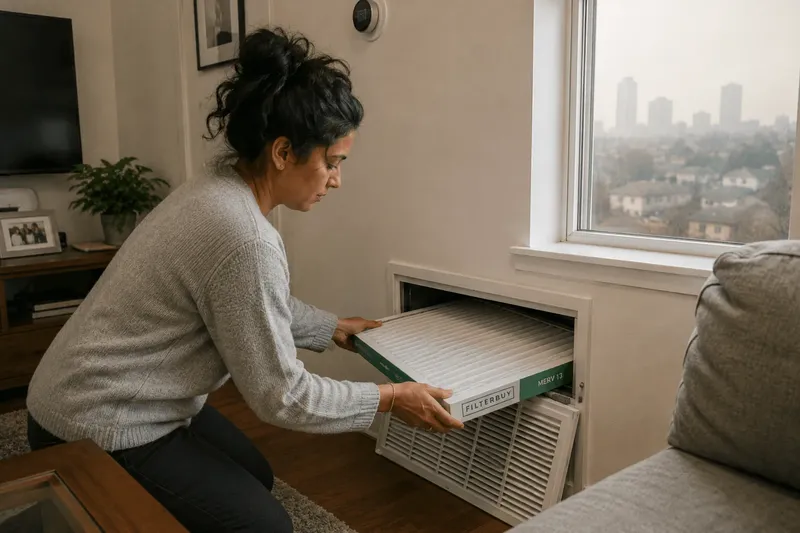
Find the fresh-air lever on your window unit. Most window air conditioners have a small vent, damper, or slider labelled fresh air, vent, or exhaust. Open, it pulls outdoor air in. On a smoke day, that's a straw from the plume to your living room. Close it. It costs nothing and takes ten seconds, and in our experience it's the single most commonly missed step in a home without ducts. Your unit is now recirculating, which is what you wanted.
Pick one room and make it the clean room. You are not going to filter a whole apartment, and you don't need to. Choose where you sleep. Close the door. Run a portable air cleaner sized for that room. Sleeping eight hours in clean air is most of the benefit for a fraction of the effort.
If a purifier isn't in the budget, build the box. A Corsi-Rosenthal box is a box fan and four or five filters taped into a cube. It runs about $60 to $85, it's open-source, there's no proprietary technology in it, and it moves serious air. Filterbuy publishes the build guide because it works, not because it's a product. It uses filters we'd happily sell you and a box fan we don't. Use MERV 13 filters in it. A box built from MERV 8 is a dust box. Smoke goes straight through.
Skip the gadgets that add pollution. No ozone generators. No “ionizers” that produce ozone. On a day when Westchester is already in a Serious ozone nonattainment area, adding more of it indoors is the wrong direction.
Know what you can't fix, and stop feeling bad about it. You can't reduct a rental. You can't reglaze the windows. Renters get a narrower set of levers, and pretending otherwise wastes your afternoon. The four steps above are the ones that don't need a landlord's permission.
If you do have central air, everything in the section above applies, and it's the better system: a properly sized MERV 13 with the fan running continuously turns your whole house into an air cleaner. That's the advantage of ducts. Roughly half of Yonkers has it. The other half deserves an answer too, and almost nobody writes it down.
When Is Yonkers Air Usually at Its Worst?
Yonkers has two distinct bad-air seasons that now overlap. Ozone season runs roughly May through September and peaks on hot, sunny, stagnant afternoons. Wildfire smoke season runs roughly May through October and arrives with no warning from fires hundreds or thousands of miles away. July and August are when both are live at once.
The reference event is June 7, 2023, when smoke from Canadian wildfires pushed New York City's AQI to a hazardous peak. NYC Emergency Management puts that peak at 465, while press reports at the time cited a reading of 484. Either way, the highest ever recorded here. New York City ranked worst in the world for air quality that day. It was not a New York City event: Westchester school districts dismissed students early, and Yonkers, two and a half miles north of Manhattan's northern tip, was under the same plume.
It happened again on July 15, 2026, when New York State expanded an Air Quality Health Advisory for fine particulate matter to cover all regions of the state because of Canadian wildfire smoke, with the NYC region forecast at an AQI of 200 for the following day, and a heat wave running underneath it.
The Numbers Behind Everything on This Page
Don't take our word for it. Three findings from the EPA and New York State back up the guidance above. Two are about Yonkers specifically. All three are free to open and check.
1. Yonkers Sits in a “Serious” Ozone Nonattainment Area
949,113 Westchester residents. Federal deadline: August 3, 2027.
The EPA lists Westchester County, whole county, as nonattainment for the 2015 ozone standard.
It has been listed every year since 2018.
In July 2024 the EPA moved the area from “Moderate” to Serious. New York, New Jersey and Connecticut asked for it, after the area missed its earlier deadline.
Westchester is in on its own merits: it has a monitor in violation of the standard. This isn't guilt by proximity to New York City.
What it means here: that hazy August afternoon isn't your imagination. It's a documented regional failure with a federal clock on it. It's also why a hot, still day can clear 100 with no smoke in the sky.
Source: EPA Green Book, New York nonattainment status by county (current as of April 30, 2026; search the page for Westchester) · Federal Register 89 FR 60314
2. New York Studied 10 Communities for Pollution Burden. Yonkers Made the List.
10 communities. About 5 million New Yorkers.
The state used criteria from the Climate Justice Working Group to find where air pollution falls hardest.
Mount Vernon, Yonkers and New Rochelle were selected.
The state then drove sensor-equipped cars down every public road in those cities for a year.
What it means here: no citywide AQI number will ever tell you this. The state looked at the whole map and picked Yonkers as one of ten worth measuring block by block. That's not a knock on the city. It's why Yonkers residents have better air data than almost anyone in New York, if they know to look.
Source: NYSDEC, 2022-23 Statewide Community Air Monitoring Initiative
3. You Breathe Indoor Air About 90% of the Time
90% indoors. Some pollutants run 2 to 5 times higher than outside.
Those are the EPA's numbers, not ours.
The people most vulnerable to air pollution spend even more time inside: young children, older adults, anyone with heart or lung disease.
What it means here: this is the honest reason a filter company built an outdoor air quality map. The AQI at the top of this page covers the smaller half of your day. Close the windows on a smoky afternoon and you seal yourself in with whatever is already circulating. That's when your return vent starts to matter.
Source: U.S. EPA, Report on the Environment: Indoor Air Quality
Where we're being careful: stats 1 and 2 are local. Stat 3 is national. Nobody has published a Yonkers-specific figure for time spent indoors, and we'd rather give you an accurate national number than a local-sounding one we made up. Every source above is the U.S. EPA or the New York State DEC. No industry studies. No numbers of ours. Nothing you can't open and read yourself.
7 Free Tools We'd Hand Any Yonkers Family
Every tool below is free, none of them are ours, and our team checks most of them before we'd tell anyone in Yonkers whether it's a good day to open the windows. Between them they answer the four things this page can't: what the air does tomorrow, what it does on your street, where the smoke is right now, and whether anyone will tell you before it shows up.
Bookmark them once and you're done. After that it's a ten-second check, same as glancing at the forecast before you decide on a jacket.
Seven, not twenty. Each one does something the others don't, and we cut anything that was just a nicer-looking version of a tool already on the list.
1. Know What Tomorrow Holds Before You Say Yes to the 9 a.m. Game
The NYSDEC Air Quality Index Forecast posts tomorrow's predicted high for the NYC Metro advisory region, which is the one Yonkers sits in, right next to yesterday's actual number. It's the only tool here that tells you what's coming instead of what already showed up, and it's the same forecast that sets off a state health advisory the moment the number is expected to clear 100.
Check it when: you're saying yes or no to a Saturday practice, a long run, or sleeping with the windows open. → New York State's air quality forecast and current observations
2. See What the Air Does on Your Street, Not Just Your City
The NYSDEC Community Air Monitoring story map for Mount Vernon, Yonkers and New Rochelle is the closest look at this city's air that anyone has ever taken. The state drove sensor-equipped cars down every public road in Yonkers at least 20 times between September 1, 2022 and August 31, 2023, then published what they found for every 100 meters of pavement.
Almost nobody in Yonkers knows this exists. It's the first thing we'd open if we lived here.
Check it when: you're weighing a neighborhood, picking a school, mapping a running route, or you just want to know whether the Deegan is doing what you suspect to your block. → Explore the Mount Vernon, Yonkers and New Rochelle story map · Yonkers fact sheet (PDF)
3. Spot the Smoke While It's Still in Canada
The AirNow Fire and Smoke Map, built by the EPA and the U.S. Forest Service, puts active fires, drifting plumes and live PM2.5 readings on one screen and refreshes about every hour. Most of the smoke that reaches Yonkers starts hundreds of miles north, so this map hands you a day or two of warning that no local reading can.
That head start is the whole ballgame. It's the difference between swapping your filter on a calm Tuesday and hunting for one the morning the sky turns orange.
Check it when: the light looks wrong, or Canadian fires are in the news and you want to know if the plume is pointed at the Hudson Valley. → AirNow Fire and Smoke Map
4. Get the Number Straight, With Nobody's Spin on It
EPA AirNow is the federal source that sits underneath nearly every AQI number you'll ever see, including the map at the top of this page. Its AQI Basics guide explains why 100 is the number that changes your plans, and it does it in plain English.
Check it when: you want the federal reading with no interpretation layered on top, or an app is telling you something that doesn't match the sky. → EPA AirNow
5. Watch the Air Change in Real Time When a Plume Rolls In
New York's real-time air monitoring network publishes hourly readings from the state's own equipment, including the Westchester stations at White Plains and Mamaroneck. DEC calls this data preliminary, and it isn't the averaged AQI, but when smoke is moving fast it's the closest thing to watching the air minute by minute.
Here's the honest catch: the official AQI is a 24-hour average for fine particles, so it lags what your nose already knows. This is where you look in that gap.
Check it when: you can smell it but the AQI hasn't caught up yet. Head to nyaqinow.net, or start from DEC's monitoring hub. → DEC's statewide air quality monitoring network
6. Find Out Whether Yonkers Air Is Actually Getting Better
The American Lung Association's “State of the Air” grades every U.S. county that has a monitor, using three years of quality-assured EPA data on ozone and particle pollution. One bad day tells you almost nothing. This tells you the trend, which is the part that should shape what you do about your home.
Check it when: you're weighing a move, or a rough week has you wondering whether it's always been like this. → American Lung Association “State of the Air”
7. Let the Alert Come to You
DEC Delivers is New York State's free email service, and air quality alerts are one of the topics you can pick. There's also a state Air Quality Hotline at 1-800-535-1345 if you'd rather ask a person. Either way, the advisory finds you on the day it matters instead of the evening you happen to remember to look.
Nobody keeps up a new daily habit forever. This is the one that keeps working after you've stopped thinking about it, and it takes about a minute to set up.
Check it when: honestly, do this one today. → Sign up for DEC Delivers email alerts
One local number worth saving: the Westchester County Department of Health handles air quality complaints and permitted emissions in Yonkers. If you think the problem is a specific source near you rather than the regional air, that's your first call, and there's a real person on the other end. → Westchester County Department of Health air quality
What's not on this list, on purpose: anything we sell, any affiliate link, and any app that reports a short-term hourly reading as though it were the AQI. These seven are free, independent, and they don't want anything from you.
Frequently Asked Questions
Sources
NYSDEC: Air Quality Monitoring and real-time data at nyaqinow.net
NYSDEC: 2022–23 Statewide Community Air Monitoring Initiative
U.S. EPA: AirNow and the Fire and Smoke Map
Filterbuy publishes no affiliate links on this page. Filterbuy manufactures air filters in the United States. That's a commercial interest, and we'd rather state it plainly than have you discover it for yourself.
Related: check live conditions across New York State · how New York City's air compares · the live wildfire and smoke map for New York · how to read a wildfire smoke map · what MERV ratings actually capture · why the air smells smoky when you can't see a fire