
Fort Collins Real-Time AQI Tracker


Get Alerts For Unhealthy AQI In Your Area
When air quality in your area reaches unhealthy levels, we'll send you a quick alert, along with expert tips on how to reduce your exposure.
What's Actually In Fort Collins Air Today?
What High AQI Means for Your Lungs in Fort Collins
How to Read AQI
The Air Quality Index (AQI) measures how polluted the air is and how it may affect your health.
0–50 (Good): Air quality is satisfactory.
51–100 (Moderate): Acceptable, but some pollutants may pose minor concerns.
101–150 (Unhealthy for Sensitive Groups)
151–200 (Unhealthy)
201–300 (Very Unhealthy)
301+ (Hazardous)
Moderate
Still okay for most, but if you have asthma or allergies, take it easy and avoid long outdoor workouts.
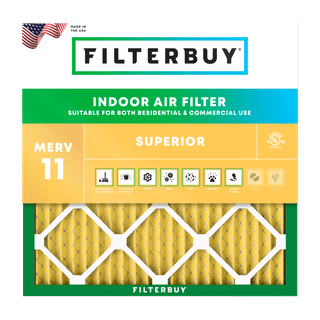
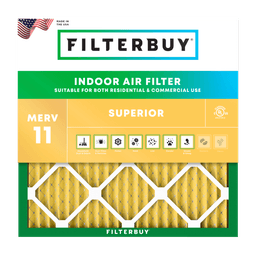
Shop MERV 11 filters→What's the Right Filter for Your AQI Level?



Check Today's Live Real Time Air Quality Index AQI Map in Fort Collins, CO Now
By Michelle Wan · Reviewed by David Clark, Licensed HVAC Technician · Published August 18, 2026 · Updated August 18, 2026
TL;DR
Fort Collins air quality is reported on the EPA's 0–500 Air Quality Index, and the number is usually driven by ground-level ozone in summer and smoke in late summer and winter. Check the live map above, then look at which pollutant is driving the reading, because that determines what actually helps. When the AQI climbs past 100, the air you control most is the air already inside your house.
Key Takeaways
Fort Collins sits inside the Denver Metro/North Front Range ozone nonattainment area, Severe under the 2008 ozone standard and Serious under the 2015 standard.
The Fort Collins-Loveland metro ranked 18th worst in the U.S. for ozone in the American Lung Association's State of the Air 2026 report card, while ranking among the nation's cleanest metros for short-term particle pollution.
Two separate monitors report Fort Collins air quality. Fort Collins-West measures ozone. Fort Collins-CSU Facilities measures PM2.5 and PM10.
The city runs its own monitoring network and visibility webcams, updated every 15 minutes (Fort Collins air quality data), so city readings can differ from EPA numbers.
Air filters capture particles, not gases. A MERV 13 filter helps during smoke events. It does nothing for ozone or radon.
What Is the Air Quality in Fort Collins Today?
The current air quality in Fort Collins appears on the live AQI map above, updated hourly from regulatory monitors in Larimer County. The index runs 0 to 500 across six categories. Above 100, air is unhealthy for sensitive groups: children, older adults, and anyone with asthma or heart disease.
One detail changes how you read that number: the dominant pollutant. June through September, a high AQI almost always means ozone. In wildfire season and winter inversions it means PM2.5, a different problem with a different fix.
What Do the AQI Colors Mean in Fort Collins?
The Fort Collins AQI uses the six color-coded categories the EPA applies nationwide, from green at 0 to maroon above 300. What changes locally is which pollutant drives the color: ozone on hot summer afternoons, fine particles during smoke season and winter inversions.
Category breakpoints per the U.S. Environmental Protection Agency Air Quality Index.
Related reading: what to do when the AQI goes above 100 and what PM2.5 actually is.
Why Does Fort Collins Have Clean Air and an Ozone Problem at the Same Time?
Fort Collins has clean particle pollution and a serious ozone problem, both true on the same day. In the American Lung Association's State of the Air 2026 report, the Fort Collins-Loveland metro ranked 18th worst in the nation for ozone while ranking among the cleanest U.S. metros for short-term particle pollution. That split is the most useful thing to know about local air.
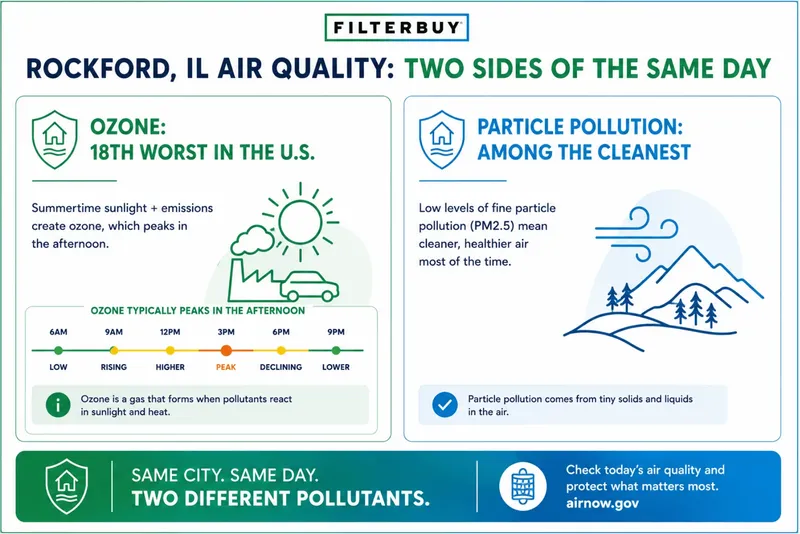
The reason is geography. Afternoon winds push pollution from the urban corridor west into the foothills, where it cooks in sunlight into ozone. The same winds keep everyday particulate levels low outside smoke events.
The Denver Metro/North Front Range recorded a 2022–2024 ozone design value of 81 parts per billion, against a 70 ppb standard. EPA planning documents set attainment deadlines of July 2027 and August 2027.
A "Good" headline can still hide an ozone reading that matters if someone in your house has asthma. Compare Colorado's statewide map and Denver's reading on the same afternoon.
Where Do Fort Collins AQI Numbers Actually Come From?
Fort Collins air quality data comes from two state regulatory monitors and a separate city-run network, which is why two weather apps can show different AQI numbers for the same afternoon. One monitor reports ozone, the other reports particles, and the city blends in non-regulatory sensors.
Monitor addresses per Colorado Department of Public Health and Environment site descriptions.
The city dashboard also runs three visibility webcams refreshing every 15 minutes. Whether the foothills are visible is a fast check on your app. Residents can sign up for alerts.
What Should You Do When Fort Collins Air Quality Is Bad Today?
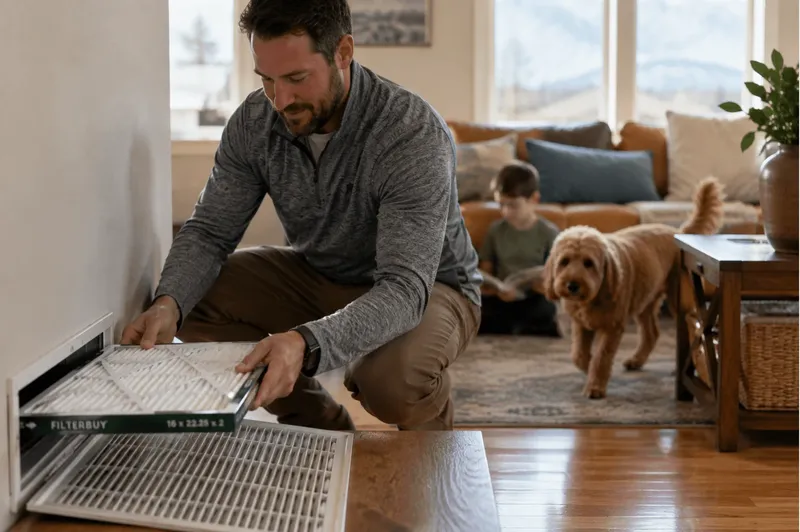
When the Fort Collins AQI passes 100, the fastest thing you control is indoor air. Close the house, run the system fan continuously, and make sure the filter in the return is rated for the pollutant you are facing. Five steps, ten minutes.
Check the dominant pollutant first. Smoke calls for filtration. Ozone calls for timing, since it peaks mid-to-late afternoon; move outdoor exercise to early morning.
Close windows and doors, including overnight during smoke events, when many Fort Collins homes cool passively.
Set your thermostat fan to ON, not AUTO. Continuous circulation pulls household air through your filter far more often than a system running only on a cooling call.
Check your filter. During smoke season a filter loads up in weeks rather than months. If it looks gray, replace it.
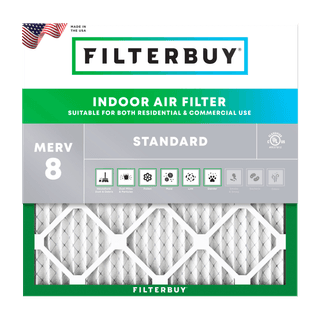
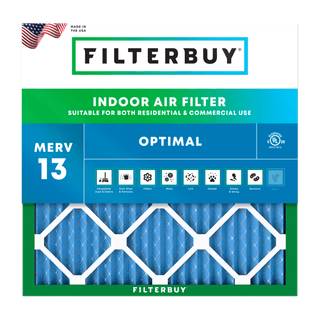
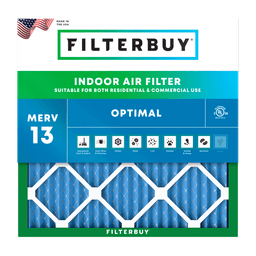
Match the filter to the threat. MERV 13 media is the residential rating built for smoke-sized particles, which MERV 8 does not capture. Filterbuy rates its MERV 13 at 98 percent capture from 0.3 to 10 microns. Check the MERV rating chart first, since higher ratings add airflow resistance.
What filters cannot do: a pleated HVAC filter is a particle filter. It does not remove ozone or radon, which matters in Larimer County, where the average tested radon level is 7.8 pCi/L against a national 1.3. Radon needs testing and mitigation, not filtration; residents can get discounted test kits from the city. Anyone claiming a furnace filter solves radon is selling you something.
When Is Air Quality Worst in Fort Collins?
The worst hours shift with the season. Ozone builds through the afternoon, while inversion particulates settle overnight and clear by midday, so the useful question is what time to go out.
Ozone timing per U.S. EPA guidance; seasonal pattern per CDPHE and City of Fort Collins monitoring.
CDPHE runs Ozone Action Day alerts from June 1. The 2020 Cameron Peak Fire, Colorado's largest at 208,913 acres, pushed Fort Collins to AQI 190.
During fire season the AirNow Fire and Smoke Map is the better tool, since it adds temporary smoke-event sensors. Filterbuy's Odor Eliminator adds activated carbon for the smoke smell that lingers after the particles clear, which pleated media alone cannot address.
What the Fort Collins AQI Does Not Measure
The AQI tracks five regulated pollutants. Three things that make Fort Collins homes feel worse are not among them.
Pollen. Never enters the AQI calculation. A green map in May says nothing about your allergies.
Radon. An indoor soil gas, invisible to every outdoor monitor on the map above.
What you generate indoors. Cooking spikes indoor particles more than most people expect, and so do candles and wood stoves, whatever the outdoor map says.
The map tells you what is arriving from outside, not what is already in the room. That is the part a filter changes.
Supporting Statistics
Three findings from federal and state research sit behind the guidance above: what creates Fort Collins ozone, how much a filter measurably changes indoor air, and why smoke now dominates the national particle picture.
1. Oil and Gas Is the Leading Local Ozone Source Between Boulder and Fort Collins
Motor vehicles and oil and gas operations each contribute 30 to 40 percent of local ozone production on days that exceed the federal health standard.
Vehicles dominate the southern metro corridor; oil and gas dominates north to Fort Collins.
Background ozone already runs 40 to 50 ppb; the standard is 70.
Why it matters here: Fort Collins sits downwind of a precursor load it does not generate.
Source: FRAPPE Source Impact Analysis, NSF NCAR report to CDPHE (2017); summary.
2. A High-Efficiency Filter Plus a Continuous Fan Cuts Indoor PM2.5 by About Half
A high-efficiency HVAC filter may cut indoor PM2.5 by about 50 percent when the system fan runs continuously.
A low-efficiency filter with the fan on still cuts particles about 24 percent.
Windows shut, no filtration: indoor PM2.5 stays at 55 to 60 percent of outdoor.
EPA recommends MERV 13 or higher during smoky periods, thermostat set to ON.
Why it matters here: closing windows is not enough. The filter and fan setting close the gap.
Source: U.S. EPA, Strategies to Reduce Exposure Indoors (updated October 2025), citing Fisk and Chan (2017).
3. Wildland Fires Produce 52 Percent of All PM2.5 Emitted in the United States
EPA's 2020 National Emissions Inventory attributed 52 percent of total U.S. PM2.5 emissions to wildland fires.
Smoke is now the majority of the national particulate load.
Fort Collins earns its clean ranking on ordinary days; Cameron Peak reversed it in hours.
Why it matters here: stock filters before fire season.
Source: U.S. EPA, Wildland Fire Research: Reducing Exposures (updated July 2026).
We have manufactured air filters in the United States for over a decade and shipped to more than two million households. The pattern is the same everywhere: people think about the filter once the air already looks wrong. Fort Collins punishes that instinct twice. Ozone peaks on clear afternoons when nothing looks wrong, and smoke arrives faster than any shipping window. Clean indoor air is a decision you make in June.
Filterbuy Air Quality Team
Frequently Asked Questions
Glossary
AQI (Air Quality Index): The EPA's 0–500 scale for daily air quality, in six color-coded categories.
PM2.5: Fine particles under 2.5 microns. Captured by MERV 13 media.
PM10: Coarser particles under 10 microns, including road dust and pollen fragments.
Ground-level ozone: A gas formed when sunlight reacts with vehicle and oil-and-gas emissions. Fort Collins' dominant summer pollutant. No air filter removes it.
Nonattainment area: A region failing a federal air quality standard, triggering cleanup requirements.
Ozone Action Day: A CDPHE advisory issued when ozone is forecast to reach unhealthy levels.
MERV: Minimum Efficiency Reporting Value, the 1–16 filter efficiency scale. Filterbuy makes MERV 8, 11, and 13, plus a carbon Odor Eliminator.
Radon: A radioactive soil gas measured indoors, not by the AQI. Larimer County is EPA Radon Zone 1.
CDPHE: Colorado Department of Public Health and Environment, which runs the state air monitors.