
Moreno Valley Real-Time AQI Tracker


Get Alerts For Unhealthy AQI In Your Area
When air quality in your area reaches unhealthy levels, we'll send you a quick alert, along with expert tips on how to reduce your exposure.
What's Actually In Moreno Valley Air Today?
What High AQI Means for Your Lungs in Moreno Valley
How to Read AQI
The Air Quality Index (AQI) measures how polluted the air is and how it may affect your health.
0–50 (Good): Air quality is satisfactory.
51–100 (Moderate): Acceptable, but some pollutants may pose minor concerns.
101–150 (Unhealthy for Sensitive Groups)
151–200 (Unhealthy)
201–300 (Very Unhealthy)
301+ (Hazardous)
Moderate
Still okay for most, but if you have asthma or allergies, take it easy and avoid long outdoor workouts.
Shop MERV 11 filters→What's the Right Filter for Your AQI Level?


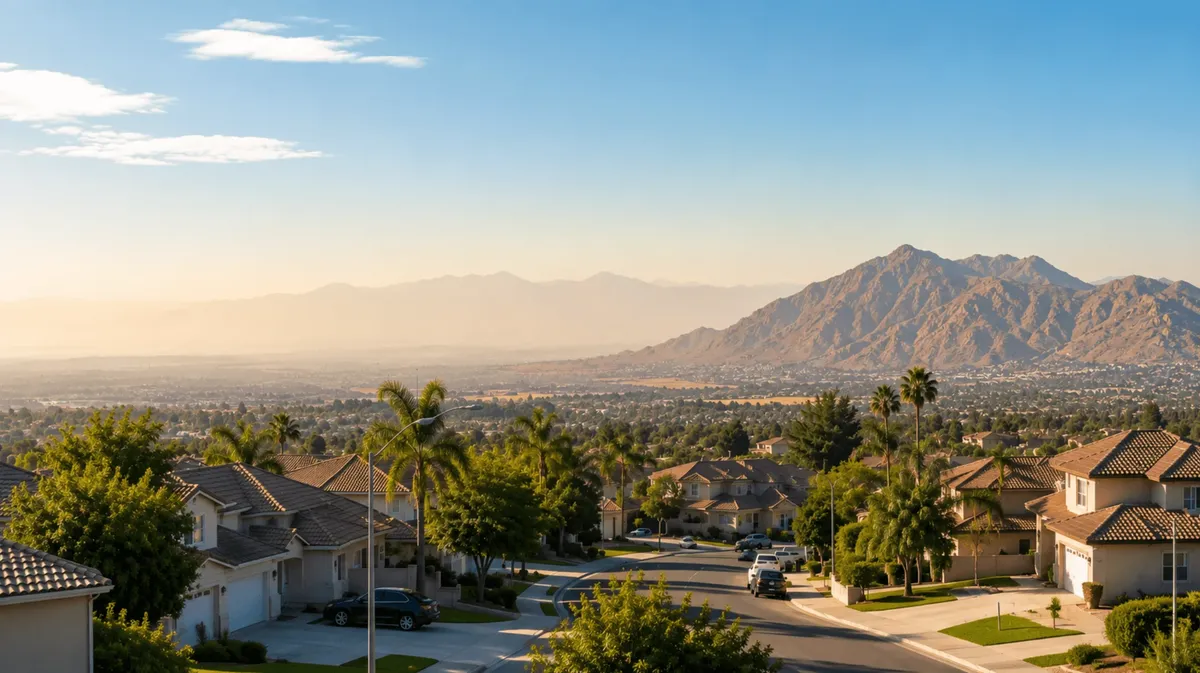
Check Today’s Live Real Time Air Quality Index AQI Map in Moreno Valley, CA Now
Author: Michelle Wan, Brand Manager & Air Quality Writer | Filterbuy | Reviewer: David Clark, Licensed HVAC Technician | Publish Date: July 17, 2026 | Updated Date: July 17, 2026
TL;DR
Moreno Valley’s live AQI is on the map above. Check the number, the color, and, most importantly, which pollutant is driving it. Most of the year that number is a ground-level ozone number, because Moreno Valley sits downwind of the Los Angeles basin at the receiving end of the afternoon sea breeze. During fire season and Santa Ana wind events it flips to a fine-particle (PM2.5) number. Those two require opposite responses at home, and only one of them is something your air filter can do anything about. Filterbuy, a U.S. air filter manufacturer, built this page around that one distinction.
Key Takeaways
Moreno Valley has no air quality monitor of its own. The nearest long-record South Coast AQMD regulatory station is in Rubidoux, roughly 11–12 miles northwest. Every "Moreno Valley AQI" you see is a nearby reading, an interpolated contour, or a low-cost sensor, which is exactly why two apps can show two different numbers for your street.
Moreno Valley’s census tracts rank in the 99th percentile statewide for ozone, but only the 56th–66th percentile for PM2.5, per OEHHA CalEnviroScreen data screened in the City of Moreno Valley’s MoVal 2040 environmental review. Smog is the chronic problem here. Smoke is the acute one.
Riverside County ranked 2nd worst in the nation for ozone pollution in the American Lung Association’s State of the Air 2026 report, with a weighted average of 126.7 unhealthy ozone days a year and failing grades on all three pollution measures.
Air filters capture particles, not gases. A pleated MERV filter will not remove ground-level ozone from your home’s air. It will absolutely help with wildfire smoke, dust, and pollen. Anyone telling you a filter fixes a smog day is selling you something.
The highest-leverage move on a bad-air day is closing the house and moving air through a good filter, not opening the windows to air it out.
I pull AQI numbers for U.S. cities most mornings, and Moreno Valley is the one that taught me to stop trusting the sky. A reading of 160 from ozone and a reading of 160 from wildfire smoke look identical on a screen. Here they usually are not the same thing at all. Late spring into fall, that number is usually smog you cannot see, cooked out of emissions that left Los Angeles hours ago and drifted east to you. Then a fire starts on Gilman Springs Road and the same number means something completely different.
So my rule for this city is narrower than the one I give everyone else. Do not just check the number. Check what made it. It decides whether you close the house or change the filter, and on the wrong day, doing the second one instead of the first is wasted effort.
Michelle Wan, Brand Manager & Air Quality Writer, Filterbuy
What Moreno Valley’s Live AQI Map Is Telling You Right Now
The Air Quality Index (AQI) is the U.S. EPA’s 0–500 scale for how polluted outdoor air is at a given moment, and how that pollution may affect your health. Lower is better. Below 50 is Good and green. Above 100 is Unhealthy for Sensitive Groups and orange, the first line most Moreno Valley families actually feel. The map above reports the highest AQI among the pollutants being measured, so the number you see is a worst-of, not an average.
Filterbuy built the map above so you can answer that in about twenty seconds. Here is how to read it:
1. Find your spot, then check two nearby ones. Air quality is not uniform across Moreno Valley. A block near SR-60 or a warehouse truck route can read differently from a block up against the Box Springs Mountains.
2. Read the color first, the number second. Green and yellow, carry on. Orange and up, make a decision.
3. Check which pollutant is driving it. This is the step everyone skips, and it is the one that determines what you should actually do.
4. Look at the hourly outlook. Moreno Valley ozone typically climbs through the afternoon and eases after sundown. A green 9 a.m. does not promise a green 4 p.m.
5. Recheck on hot, windy, or smoky days. Conditions here can move a full category in a couple of hours.
New to the index? Our guide to what the air quality index (AQI) measures walks through the full scale, and the EPA’s AQI Basics guide, the primary source behind every number on this page, is the first of the seven resources listed further down.
Ozone or Particles? In Moreno Valley, the Pollutant Behind the Number Matters More Than the Number
We built this page around one distinction, and it is the reason it exists. Filterbuy has made pleated air filters in the United States since 2013, and the single most common thing we get wrong-footed by is a homeowner who did everything right for the wrong pollutant. Every other Moreno Valley AQI page will hand you a number. Almost none of them will tell you what the number is made of, and in this city that is the part that changes your afternoon.
Most of Moreno Valley’s unhealthy air days are smog days, not smoke days. Ground-level ozone is a gas that forms when tailpipe and industrial emissions cook in sunlight. Moreno Valley sits about 63 miles east of downtown Los Angeles, and the daytime sea breeze pushes the basin’s emissions inland all afternoon. The Inland Empire is where that reaction finishes. That is why the AQI number here so often peaks between mid-afternoon and early evening on a clear, hot, blue-sky day when nothing looks wrong at all.
The data backs the pattern up in a way most air-quality pages never mention. When the City of Moreno Valley screened its census tracts against OEHHA’s CalEnviroScreen for the MoVal 2040 general plan environmental review, the results split sharply by pollutant.
Source: OEHHA CalEnviroScreen data as screened in the City of Moreno Valley MoVal 2040 General Plan Update, Appendix B: Air Quality Impact Assessment (2024).
Two things follow from that table, and they are the whole point of this page.
First: the AQI number in Moreno Valley is usually an ozone number. Ozone is a gas. It is invisible. It does not smell like a campfire. It irritates the airway lining, and it hits hardest during exertion, which is why an afternoon soccer practice is the exposure that matters, not the drive to work. Riverside County ranked second worst in the entire country for ozone pollution in the American Lung Association’s State of the Air 2026 report, with a weighted average of 126.7 unhealthy ozone days per year and an F on all three measured pollutants. It’s a standing you can check against every other county in the country. Riverside County’s full report card is in the resources section below. The Los Angeles metro area, which includes Riverside and San Bernardino counties, has ranked most ozone-polluted in the nation in 26 of the report’s 27 years.
Second: that diesel PM spread, 6th percentile to 91st percentile inside one city’s limits, is why your neighbor’s app and your app disagree. Diesel exhaust does not distribute evenly. It concentrates along SR-60, along I-215, and around freight and logistics corridors. This is the same principle our team applies everywhere: why the air quality is bad on a given day matters more than the number itself, because an ozone 160 and a wildfire-smoke 160 look identical on a screen and call for different decisions.
Where the "Moreno Valley AQI" Number Actually Comes From
There is no South Coast AQMD regulatory air monitor inside Moreno Valley’s city limits. The city’s own General Plan air quality element describes Moreno Valley as located "in the vicinity of" three district stations: Perris, Riverside-Rubidoux, and Riverside-Magnolia. None of them is in Moreno Valley. And the network has thinned. The MoVal 2040 environmental review notes that Perris station data was only available through 2021 while Rubidoux ran current, and South Coast AQMD’s July 2025 Air Quality Monitoring Network Plan lists Perris among its now-closed monitoring sites.
So when an app shows you "Moreno Valley: AQI 68," here is what is actually behind it. Filterbuy pulled this apart source by source, because a number nobody can trace is a number nobody should act on. You can always cross-check it against the South Coast AQMD current readings by air monitoring subregion, listed in the resources section below.
South Coast AQMD lists the Perris monitoring site among its now-closed sites in the 2025 Annual Air Quality Monitoring Network Plan.
That last row explains a lot of arguments. A backyard particle sensor cannot see ozone. On a 95-degree August afternoon when the ozone AQI is 130, a PM-only sensor can honestly report green.
South Coast AQMD publishes one more caveat themselves: wind-blown ash particles are often too large for air quality instruments to detect, so the AQI map can show green while visible ash is falling. If you smell smoke or see ash on the car, believe your senses over the number.
The Moreno Valley AQI Playbook: What Each Level Actually Means Here
Find your number, do the thing. This is the table the Filterbuy team would hand a neighbor here, and it is built for Moreno Valley specifically. The "what it usually is here" column reflects the local pattern of ozone-dominant days with smoke and dust spikes, and the last column is the honest answer about what your HVAC filter can and cannot do. For the health reasoning behind each band, the CDC guidance in the resources below turns the numbers into plain steps, and we go deeper on what to do once the AQI passes 100.
Health guidance follows the U.S. EPA and AirNow AQI categories. When in doubt, be more careful, not less.
Where Moreno Valley’s Air Pollution Comes From
Four sources explain most of what the map shows you. Moreno Valley sits in the South Coast Air Basin, a 6,600-square-mile bowl held in by the Pacific on one side and the San Gabriel, San Bernardino, and San Jacinto mountains on the other. Low wind speeds and a persistent inversion layer mean the basin holds onto pollution instead of flushing it. Moreno Valley is near the downwind end of that bowl.
1. The Los Angeles basin, delivered by the afternoon sea breeze. This is the big one, and it is not local at all. Emissions generated 40 to 60 miles west cook in sunlight as the onshore flow carries them inland. Moreno Valley receives the finished product. It is why ozone here peaks in the afternoon rather than at rush hour.
2. Freeways and freight. SR-60 runs east-west through the northern part of the city. I-215 runs north-south near the western limits. The MoVal 2040 emissions inventory found mobile sources are the largest contributor to citywide emissions for every criteria pollutant except VOCs. Eastern Moreno Valley is also home to the approved World Logistics Center, a logistics campus of up to 40.6 million square feet on roughly 2,610 acres south of SR-60, projected in its environmental review to generate on the order of 14,000 daily truck trips, and the subject of years of CEQA litigation that produced settlements with South Coast AQMD, Riverside County, and a coalition of environmental groups.
3. Wildfire and drift smoke. This is not hypothetical here. The Springs Fire ignited on Gilman Springs Road in Moreno Valley on April 3, 2026, burned 4,176 acres and forced evacuations in neighborhoods including Moreno Valley Ranch, closed Lake Perris State Recreation Area, and prompted Cal Fire and Riverside County Fire to issue a drift smoke advisory for communities across Riverside County. In June 2026, the Shore Fire near Calimesa burned roughly 3,000 acres and used Valley View High School in Moreno Valley as its evacuation shelter. Smoke does not need the fire to be in your neighborhood. It can travel hundreds of miles from the flames. During an active fire, the AirNow Fire and Smoke Map and South Coast AQMD’s wildfire smoke tips are the two pages to keep open.
4. Wind and dust. Santa Ana and other wind events lift dust off open ground, construction, and the Badlands. Moreno Valley sits in the Inland Empire forecast zone covered by the National Weather Service San Diego office, which names the city in wind advisories regularly. Coarse particles spike. Sometimes the index catches it, sometimes it does not.
Which Moreno Valley Are You In?
This page keeps telling you your block is the variable, so here’s how to find your block. Diesel exhaust doesn’t spread evenly, and Moreno Valley is big enough that the north end and the east end aren’t living with the same air. We went looking for a neighborhood-level map of this and couldn’t find one. Not from the district, not from the city, not from any of the apps. So Filterbuy built the next best thing out of what is documented: where the freeways run, where the logistics campus sits, and where the terrain is. As far as we can tell, this table doesn’t exist anywhere else.
These are proximity patterns, not measurements. Moreno Valley tracts run from the 6th to the 91st percentile statewide for diesel PM, so look up your own census tract in the CalEnviroScreen tool linked earlier on this page.
Be honest about what this table is. It is a reasoning tool, not a measurement. It will get you to the right question in about ten seconds, which is more than the AQI number alone will do. If you want the actual figure for your address, the CalEnviroScreen tool linked earlier scores every census tract in the state, and Moreno Valley’s span the range almost end to end.
The Moreno Valley Air Year
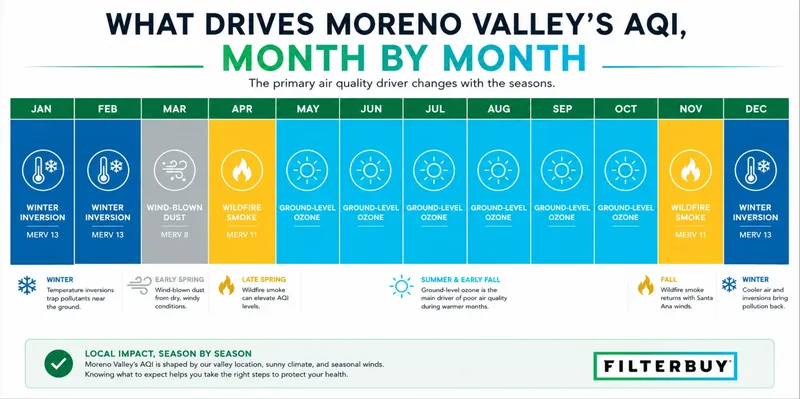
Moreno Valley’s air problem changes character by season. Knowing which season you’re in tells you what the number is likely to mean before you even look. This is the calendar Filterbuy keeps for the city, and it’s the reason our advice here changes in May and changes back in October.
And the Same Day, Hour by Hour
Knowing the season tells you what to expect. Knowing the clock tells you when to move. Ozone is not a background level that sits still. It is manufactured overhead during daylight hours and it falls apart after dark, which makes a Moreno Valley summer day unusually predictable once you know the shape of it.
This is the warm-season ozone pattern, not a promise. Wildfire smoke ignores the clock entirely and can spike at any hour, so verify against the live map at the top of this page.
The practical version: in ozone season, the cleanest air in Moreno Valley is before 9 a.m., and the dirtiest is the exact window most kids are outside. If you change one thing after reading this page, move the workout or the practice to the morning. It costs nothing and it is the single largest exposure reduction available to a healthy adult here.
When an Air Filter Helps in Moreno Valley, and When It Does Not
We’ve been making pleated air filters in the United States since 2013, and we sell them on this very page. So take this seriously precisely because it’s coming from us: an HVAC air filter will not remove ground-level ozone from your home’s air. Ozone is the pollutant behind most of Moreno Valley’s bad-air days. It’s also the one thing in this city’s air our product can’t do anything about.
We would rather lose the sale than have a Moreno Valley family believe a filter fixed a smog day. That is not a slogan. It is the reason there is a “does a filter help?” column in the table above at all, and the reason the answer in it is “no” twice. A company that only shows you the yes column is not being straight with you.
MERV, or Minimum Efficiency Reporting Value, is a particle capture scale under the ASHRAE 52.2 standard. It rates how well media captures particles in defined size ranges. Our full breakdown of MERV ratings covers the whole scale. Ozone is not a particle. It is a gas. A pleated MERV 8, 11, or 13 filter is engineered to catch dust, dander, pollen, and fine particulate matter, and it does that job well. It is not designed to capture a gas molecule, and no MERV number changes that.
So here is the honest breakdown. Gases are a different job from particles, which is what activated carbon and charcoal filter media is built for. That is the media in the Filterbuy Odor Eliminator line. It is a supplement to a particle filter, not a replacement for one.
MERV (Minimum Efficiency Reporting Value) is the ASHRAE 52.2 scale for particle capture. It does not measure gas removal.
One warning that belongs in prose and not a table, because it matters: never buy an "ozone generator" marketed as an air purifier. The EPA is unambiguous that ozone generators sold as air cleaners intentionally produce the exact gas driving most of Moreno Valley’s bad air days, and no federal agency has approved them for use in occupied spaces.
On the airflow question, since it comes up in every Inland Empire conversation: a higher MERV is not automatically better for your specific system. If a filter restricts airflow beyond what your equipment was designed for, you trade filtration for strain and efficiency. Check what your system supports before jumping to MERV 13. If you are not sure, work through which MERV rating you should use or ask us. We would rather talk you into the right filter than the expensive one.
The mistake I see is treating MERV like a volume knob. Turn it up, get more protection. On a system that was sized decades ago and has never had the ducts touched, a MERV 13 in a return that is already undersized just means the blower works harder for less air. You feel that as rooms that will not cool in August.
Check what your equipment is rated for before you jump. If MERV 13 is within spec, run it through smoke season and change it early. If it is not, a clean MERV 11 that actually moves air will do more for you than a MERV 13 that chokes the system.
David Clark, Licensed HVAC Technician, Technical Reviewer for this Page
If You Rent, or Your System Cannot Take MERV 13
Three times on this page we have told you to put a better filter in your HVAC. That advice assumes you own the HVAC. Plenty of Moreno Valley households do not, and plenty of others have a system that will not take a MERV 13 without choking. You are not stuck.
The EPA has actually researched the cheap version, and it works: a box fan with a MERV 13 filter strapped to it. Their findings, which are worth following exactly:
Use a thicker filter. EPA reports that a single 4-inch MERV 13 filter is highly effective in this design, increasing the clean air delivery rate by 123%. Multiple filters (2 to 5) are the most cost-effective build.
Add a cardboard shroud. It is a no-cost improvement and it measurably helps.
MERV 13 specifically. The filter rating strongly drives the clean air delivery rate, and MERV 13 is what catches the very small particles in wildfire smoke.
Safety, not optional: use only a newer certified box fan, 2012 models or later, which have the added safety features.
Keep spares and swap when dirty. A loaded filter stops working long before it looks destroyed.
Source: U.S. EPA, Research on DIY Air Cleaners to Reduce Wildfire Smoke Indoors
Yes, we are a filter company telling you to buy one filter and a box fan instead of upgrading anything. If that is your situation, that is the right answer, and we would rather you have clean air in the bedroom on a smoke night than have us make a bigger sale. Renters especially: this is portable. It leaves when you leave.
What to Do on a Bad Air Day in Moreno Valley
Six steps, in order, when the map goes orange or worse. The first one is the one people skip, and it’s the reason this page exists: on a Moreno Valley afternoon, the sky is the least reliable thing you can consult. Don’t trust the view. Trust the reading.
1. Check which pollutant it is. Smoke and smog are not the same problem. Look at the map’s pollutant readout, or check whether you can see and smell it.
2. Close the house. Windows and exterior doors shut. This is the step that matters most for ozone, and it matters a lot for smoke.
3. Set HVAC to recirculate and the fan to On, not Auto. Auto only moves air when the system is heating or cooling. On runs air through the filter continuously.
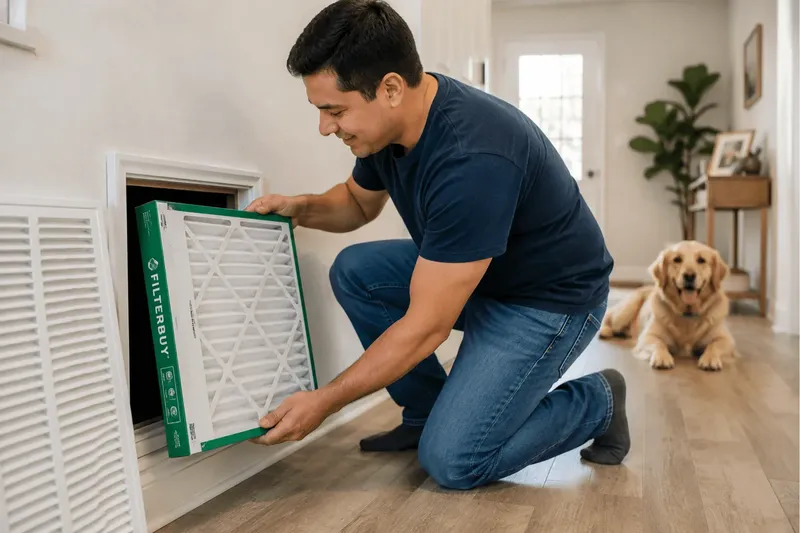
4. Check the filter. If the media looks gray or matted, or airflow feels weak, swap it, especially during smoke. Do not wait for the 90-day mark during a fire. Find your exact filter size if you are not sure what you need.
5. Add a HEPA room purifier where you sleep if smoke is the driver. Bedroom or main living space.
6. Move exertion. Early morning is almost always the cleanest window in Moreno Valley during ozone season. Reschedule the run. Do not just power through it.
After it clears: wipe hard surfaces with a damp cloth, vacuum with a HEPA vacuum if you have one, and replace any filter that took a heavy smoke load. Keeping one correctly sized spare on hand is the difference between swapping early and driving around looking for a 16x25x1 at 9 p.m. That is the whole reason air filter auto-delivery exists.
If You Work Outside in Moreno Valley, 151 Isn’t Advice. It’s a Trigger.
Every other section here treats the AQI as a suggestion. For outdoor workers in this city, it’s a legal threshold. Cal/OSHA’s Protection from Wildfire Smoke standard, title 8 section 5141.1, kicks in when the current PM2.5 AQI hits 151 and your employer should reasonably expect wildfire smoke. In a city built on warehouses, truck yards, and outdoor work, that’s not a footnote.
What your employer owes you at PM2.5 AQI 151 or above:
Tell you the AQI, in a language you actually understand.
Train you on smoke hazards and on the limits of a respirator.
Move the work into filtered air if that’s feasible, or relocate it, reschedule it, ease the intensity, add rest breaks.
Hand out NIOSH-approved N95 respirators for voluntary use, and encourage you to wear them.
Above a PM2.5 AQI of 500, N95 use stops being voluntary and becomes required, with fit testing and a full program behind it.
Here’s the catch, and it’s this page’s whole argument showing up in labor law. The standard keys on the PM2.5 AQI, not the headline number on your app. A 160 driven by ozone doesn’t trigger section 5141.1. A 160 driven by Springs Fire smoke does. Same number, same color, same screen. Two completely different sets of obligations. If you only ever read the big number, you can’t tell which day you’re owed something on.
Cal/OSHA’s worker FAQ answers the Moreno Valley version of this question almost word for word: if you work inside a warehouse and your area is smoky, ask your employer what the AQI is. It’s also blunt about masks. A bandana, a scarf, or a surgical mask is not respiratory protection. N95 is the floor. Questions go to Cal/OSHA’s call center at 833-579-0927, in English or Spanish, and complaints can be filed confidentially.
Filterbuy doesn’t sell N95s, and there’s nothing for us at the end of this section. It’s here because roughly a third of this page’s argument is about freight and warehouses, and it would be strange to write all of that and never mention the people working in them.
Don’t Take Our Word for It: The Research Behind This Page
Filterbuy doesn’t make claims it can’t back. Three findings. Three primary sources. Every one links straight through, so you can check us.
1. Ozone Here Is Structural. The Deadline Is 2038.
Status: “Extreme” nonattainment. The Clean Air Act’s worst category.
Deadline: August 3, 2038. Attainment year: 2037.
Cut required: 67% below baseline NOx. That’s 83% below 2018.
Who emits it: about 80% mobile. Trucks, ships, aircraft, locomotives. Stationary sources: the other 20%.
What it means for you: A high-ozone afternoon isn’t a fluke. It’s a regional condition on a decade-long clock, and nothing inside your house changes it.
Source: South Coast AQMD, Final 2022 Air Quality Management Plan, Chapter 1
2. Diesel Is About 70% of California’s Known Air-Toxics Cancer Risk. And It’s a Particle.
Cancer risk share: about 70% of the state’s known air-toxics risk.
Added lifetime risk: roughly 520 cancers per million exposed (2012 estimates).
Size: over 90% is under 1 micron. That makes it PM2.5.
Trend: down 68% since 1990. Now about 8% of outdoor PM2.5, and CARB says that share swings by region.
What it means for you: Your block is the variable, and CARB says so too. Ozone is a gas. Diesel PM isn’t, which makes freight the one local source your filter actually works on.
Source: California Air Resources Board, Overview: Diesel Exhaust & Health
3. A Good Filter Cuts Indoor PM2.5 by About Half. Not All of It.
High-efficiency filter, fan on: about 50% less indoor PM2.5.
Low-efficiency filter, fan on: about 24% less.
Windows shut, no purifier: indoor sits at 55–60% of outdoor. Across homes: 30% to 100%.
Home age matters: newer and air-conditioned homes keep more of it out.
What it means for you: Half isn’t a force field, and anyone promising you one is overselling. Half is still the biggest lever you’ve got, which is why “fan to On, not Auto” isn’t a throwaway step.
Source: U.S. EPA, Wildfire Smoke Course: Strategies to Reduce Exposure Indoors
7 Trusted Sources That Make Moreno Valley’s Invisible Air Visible
You can’t see what’s drifting over Moreno Valley this afternoon. These seven make it visible. We’re air-obsessed, so we read them every day. You don’t have to. Every one is a federal agency, a state air district, or a national health authority. No aggregators, no ad-stuffed forecast apps. And they’re in the order you’d actually use them: read the number, find the monitor, learn the pollutant, see what’s coming, call your afternoon, check the year, know the stakes.
1. Start With the Scale Everybody Else Is Quoting
Every AQI number you’ll see anywhere, ours included, comes from one federal scale. The EPA’s AirNow AQI Basics guide walks through the six colors and why 100 is the number that should change your plans.
2. Get as Close to a Local Monitor as Moreno Valley Gets
There’s no regulatory monitor inside the city, so this is the nearest thing to raw data you’ll find. South Coast AQMD posts current readings at air monitoring subregions for the Perris Valley area that covers Moreno Valley. Pull it up when two apps can’t agree about your street.
3. Meet the Pollutant That Hides on Pretty Afternoons
This is the one that catches Moreno Valley families off guard, because you can’t see it and it peaks when the sky looks perfect. The EPA’s ground-level ozone primer explains how sunlight and traffic emissions cook it up, and why it reaches kids and asthma sufferers first.
4. See the Bad Day Coming Before It Gets Here
A dust event or a heat spike is a lot easier to handle when it doesn’t surprise you. The National Weather Service San Diego office forecasts the Inland Empire zone Moreno Valley sits in, and issues the wind and heat advisories that tend to show up right before the air turns.
5. Turn the Number Into a Yes or No on Practice
Knowing it’s 130 outside doesn’t help much until you know whether the kids should be out in it. The CDC’s air quality and health guidance turns each level into plain steps. It’s where we point people who ask us what a reading means for their own family.
6. Check Your County’s Report Card Yourself
We’d rather you get the hard number from the source than take our word for it. The American Lung Association’s Riverside County report card lays out the failing grades, the unhealthy-day count, and the trend behind everything we’ve told you on this page.
7. Find Out What This Stuff Actually Does to You
Here’s where the invisible gets concrete. The NIEHS air pollution health overview covers what ozone and fine particles do once they’re in your lungs, and why the air inside your house matters as much as the reading outside it.
Bookmark two. Skip the other five. Honestly? Most Moreno Valley households only ever need the live map at the top of this page and the AQMD subregion feed. The rest are here for the day you want to know why, and on that day we’d rather send you to a government monitor than hand you a guess.
Every source here is a federal agency, a state air district, or a national health authority. Sharing what we know is the whole point, so none of these links come back to us.
Frequently Asked Questions About Moreno Valley’s Air Quality
Glossary
AQI (Air Quality Index): The U.S. Environmental Protection Agency’s 0–500 scale describing how polluted outdoor air is and how it may affect health. Reported publicly through AirNow.gov. Six categories: Good (0–50), Moderate (51–100), Unhealthy for Sensitive Groups (101–150), Unhealthy (151–200), Very Unhealthy (201–300), Hazardous (301+).
AirNow: The U.S. government’s public air quality reporting program, run by the EPA with partner agencies. The source of most AQI numbers you see in apps.
Ground-level ozone (O3): A colorless gas and the main ingredient of smog, formed when nitrogen oxides and volatile organic compounds react in sunlight. It is a gas, not a particle, so air filters do not capture it.
PM2.5: Fine particulate matter with a diameter of 2.5 micrometers or less, small enough to reach deep into the lungs. The main health concern in wildfire smoke.
PM10: Coarse particulate matter 10 micrometers or less, including road dust and wind-blown soil.
MERV: Minimum Efficiency Reporting Value, the ASHRAE 52.2 scale rating how effectively an air filter captures airborne particles. Higher numbers capture smaller particles. It does not measure gas removal.
HEPA: High-Efficiency Particulate Air, a filter standard capturing at least 99.97% of 0.3-micron particles. Common in portable room purifiers. Most residential HVAC systems are not built to handle HEPA media.
Activated carbon media: Filter media treated to adsorb gases and odors rather than particles. The Filterbuy Odor Eliminator line uses it. Capacity is finite and declines as it loads.
South Coast AQMD: The regional agency regulating stationary sources of air pollution across Los Angeles, Orange, and the non-desert portions of Riverside and San Bernardino counties. It issues Moreno Valley’s daily forecast and smoke advisories.
South Coast Air Basin: The roughly 6,600-square-mile air basin bounded by the Pacific Ocean and the San Gabriel, San Bernardino, and San Jacinto mountains. Its inversion layer and low wind speeds trap pollution.
Source Receptor Area (SRA): South Coast AQMD’s numbered forecast subregions. Moreno Valley falls in the Perris Valley area (SRA 24), adjacent to Metropolitan Riverside County (SRA 23).
Rubidoux monitoring station: South Coast AQMD’s regulatory monitoring site at 5888 Mission Blvd in Riverside, roughly 11–12 miles northwest of Moreno Valley. The nearest station with a long, continuous record.
CalEnviroScreen: California OEHHA’s screening tool scoring every census tract in the state on pollution burden and population vulnerability.
Inversion layer: A layer of warm air sitting above cooler air, acting like a lid that prevents pollution from dispersing upward. A defining feature of the South Coast Air Basin.
Sea breeze transport: The daytime onshore airflow that carries Los Angeles basin emissions inland toward the Inland Empire, where they react in sunlight to form ozone.
Drift smoke: Wildfire smoke that has traveled away from the fire itself. It can degrade air quality in communities miles from any flames.
World Logistics Center: An approved logistics campus of up to 40.6 million square feet on roughly 2,610 acres in eastern Moreno Valley, south of SR-60, whose environmental review projected on the order of 14,000 daily truck trips.
Filterbuy: A U.S. manufacturer of pleated HVAC air filters, offering 600+ standard sizes plus custom cuts, shipped factory-direct.
About This Page
Written by Michelle Wan, Brand Manager & Air Quality Writer | Filterbuy
Reviewed by David Clark, Licensed HVAC Technician
Published: July 16, 2026 · Last updated: July 16, 2026
Filterbuy has manufactured pleated air filters in the United States since 2013 and ships them factory-direct in more than 600 standard sizes plus custom cuts, free and with no minimum. We sell air filters, which is exactly why this page is specific about what a filter does and does not do. Better Air For All.™
Sources
U.S. EPA / AirNow: AQI Basics; AirNow Fire and Smoke Map
U.S. EPA: Ground-level Ozone Basics; Ozone Generators That Are Sold as Air Cleaners
U.S. EPA: Wildfire Smoke Course: Strategies to Reduce Exposure Indoors; Research on DIY Air Cleaners to Reduce Wildfire Smoke Indoors
South Coast AQMD: Current Readings at Air Monitoring Subregions; Air Quality Advisories; Wildfire Smoke and Ash Health Tips; 2025 Annual Air Quality Monitoring Network Plan
South Coast AQMD: Final 2022 Air Quality Management Plan, Chapter 1, covering ozone attainment classification and NOx reduction targets
American Lung Association, State of the Air 2026: Riverside County report card; Most Polluted Places
City of Moreno Valley: MoVal 2040 General Plan Update, Appendix B: Air Quality Impact Assessment (Kimley-Horn, 2024); General Plan EIR section 5.3, Air Quality
California Air Resources Board: Overview: Diesel Exhaust and Health
OEHHA: CalEnviroScreen
Cal/OSHA: Protection from Wildfire Smoke, title 8 section 5141.1; worker FAQ on wildfire smoke
Cal Fire / Riverside County Fire, via NBC Los Angeles: Springs Fire coverage, April 2026
National Weather Service: San Diego forecast office, which covers the Inland Empire zone including Moreno Valley
CDC: Air Quality and Health guidance. NIEHS: Air Pollution health overview