
Why Is The Air Quality Bad Today? Causes, AQI Levels, and How To Protect Your Home
July 14, 2026
Author: Michelle Wan | Reviewer: David Clark | Publish Date: July 14, 2026
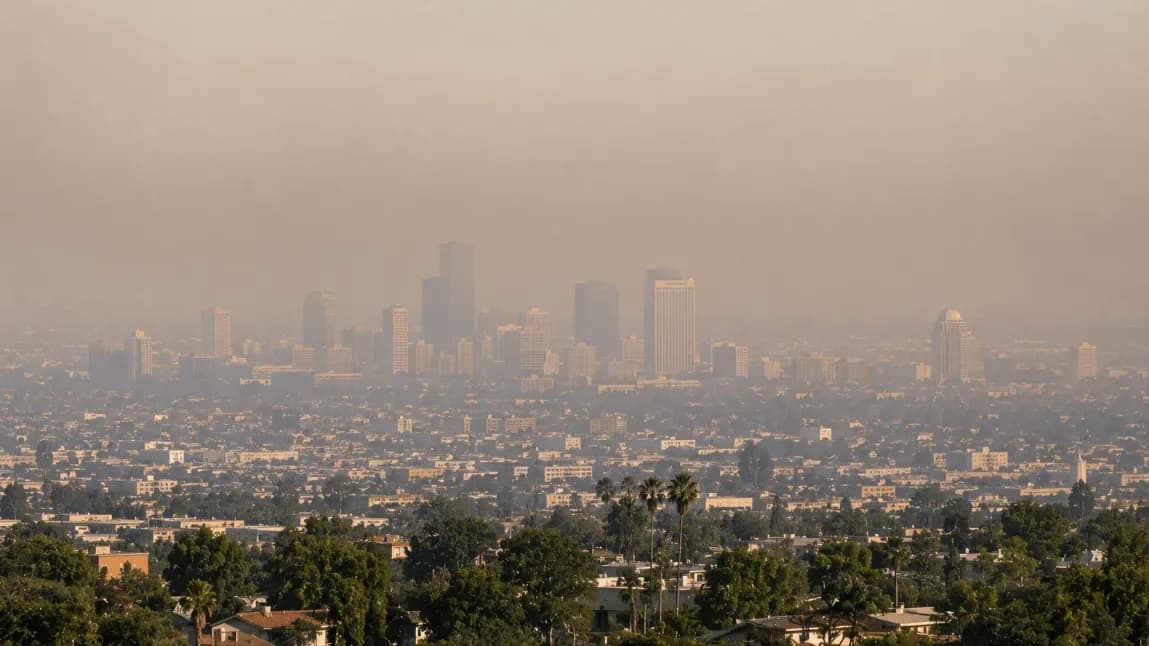
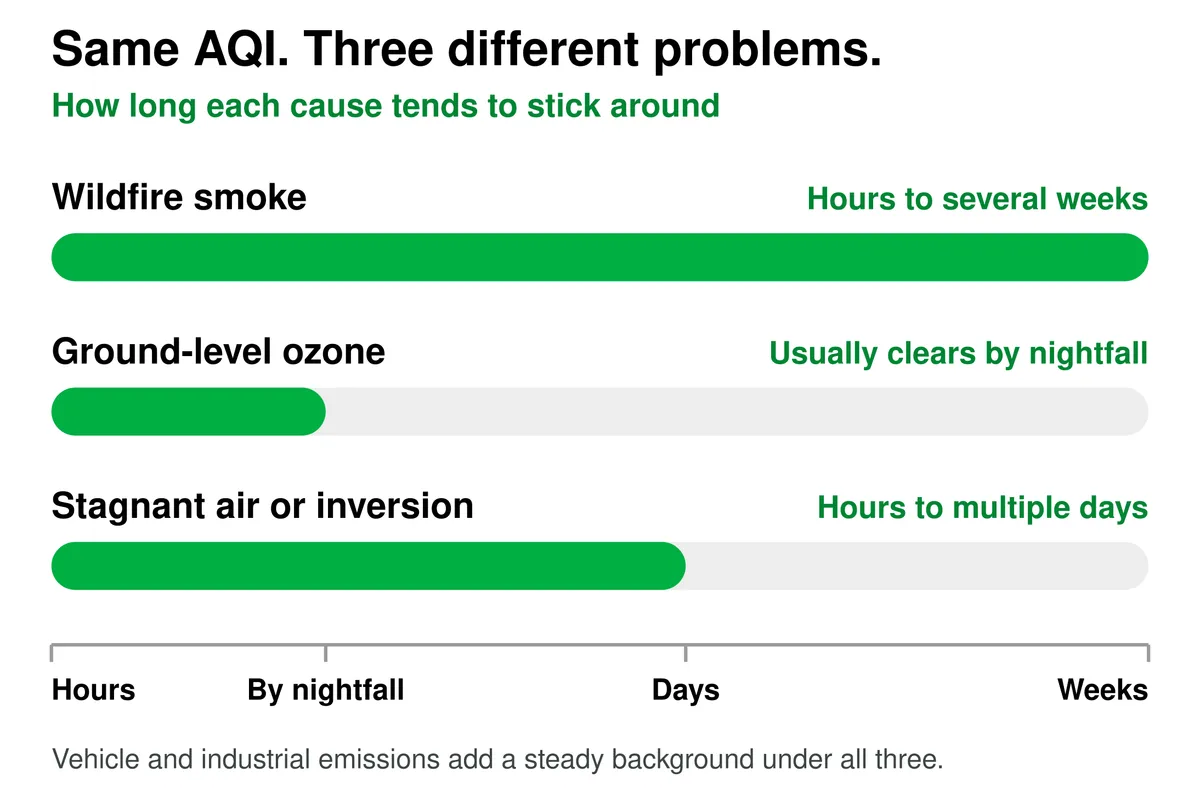
Bad air today almost always comes down to one of three things: wildfire smoke, ground-level ozone, or stagnant weather trapping pollution near the ground. Your local Air Quality Index tells you which one is driving the number. That matters more than the number itself, because the same reading can clear by nightfall or hang around for weeks.
- Wildfire smoke — fine particles that travel hundreds of miles from the fire. Hours to several weeks.
- Ground-level ozone — forms when heat and sunlight react with vehicle and industrial emissions. Usually clears by nightfall.
- Stagnant air or a temperature inversion — warm air sits above cool air like a lid. Several hours to multiple days.
Once the windows are closed, the filter in your HVAC system is what handles the air inside. Take the quick match quiz below to find the right one for your home.
Answer 3 quick questions and we’ll match you to your perfect filter.
Prefer to browse instead? Shop air filters at Filterbuy.
Bad air today almost always comes down to one of three things: wildfire smoke, ground-level ozone, or stagnant weather trapping pollution near the ground. Your local Air Quality Index (AQI) tells you which one is driving the number, and that matters more than the number itself. The same reading can clear by nightfall or hang around for weeks, depending on the cause.
Here's how the three main culprits behave:
Wildfire smoke: fine particles that travel hundreds of miles from the fire. Lasts hours to several weeks.
Ground-level ozone: forms when heat and sunlight react with vehicle and industrial emissions. Usually clears by nightfall.
Stagnant air or a temperature inversion: warm air sits above cool air like a lid. Lasts several hours to multiple days.
Once you close the windows, the filter in your HVAC system handles the air inside. Take the quick match quiz below to find the right one for your home. Prefer to browse instead? Shop air filters at Filterbuy.
What To Do In The Next 24 Hours
If today's air is already bad, this is the short version. The rest of this guide explains why.
Find your dominant pollutant, not just the number. Open your location's detail view on AirNow.gov. If it says ozone, you are likely waiting out an afternoon. If it says PM2.5, plan for days.
Close windows and exterior doors. Keep them closed through the evening even if the outdoor number improves.
Set your HVAC fan to "on" rather than "auto" so air keeps cycling through the filter instead of only moving when the system heats or cools.
Check the filter you already have. During a smoke event, a filter that would normally last a full season can gray out in a matter of weeks.
Skip the indoor pollution sources. No candles, wood-burning fireplace, incense, or aerosol sprays on a high-AQI day.
Move hard exercise indoors once the AQI passes 100 if anyone in the household has asthma, COPD, or heart disease, and once it passes 150 for everyone else.
What Causes Bad Air Quality Today
Poor air quality on any given day traces back to a small set of repeat offenders, and the mix matters as much as the number. Two days with an identical AQI reading can call for very different responses, depending on what's driving it, how long it will stick around, and whether closing the windows solves the problem or just slows it down.
Wildfire Smoke
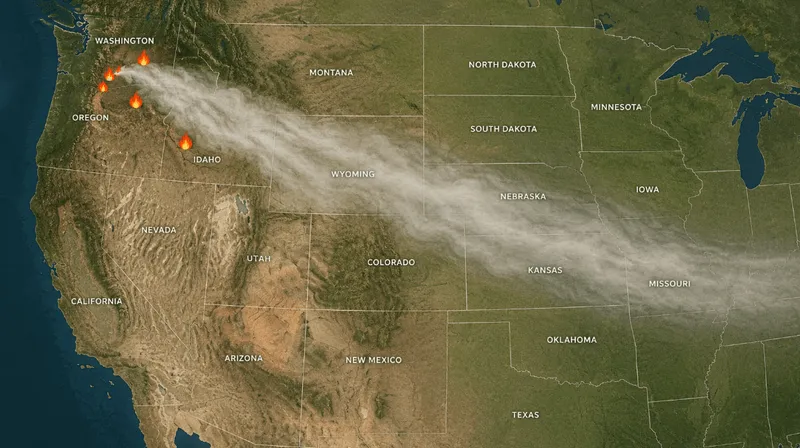
Wildfire smoke is fine particulate matter, or PM2.5, released by burning vegetation and structures. It is one of the fastest-growing drivers of sudden air quality drops across North America. Those particles travel hundreds or thousands of miles from the source fire. NASA's Earth Observatory has tracked plumes crossing the entire continental United States, darkening skies and raising particle pollution in cities nowhere near a flame.
Smoke is not just more widespread than everyday pollution. It appears to be more harmful per microgram. Research published in Nature Communications found that PM2.5 from wildfire smoke drives a 1.3 to 10 percent increase in respiratory hospitalizations for every 10-microgram-per-cubic-meter rise, compared with 0.67 to 1.3 percent for PM2.5 from other sources (Aguilera et al., 2021).
Unlike ozone, smoke does not politely clear out once the sun sets. Once fine particles work their way indoors, they can sit in a house for days after the outdoor number turns green again. That persistence has a practical side for anyone running an HVAC system during a smoke event, and it's a pattern Filterbuy sees directly: a filter that would normally last a full season can load up with soot in a matter of weeks.
Where The 2026 Wildfire Season Stands
As of mid-August 2026, roughly 7.3 million acres have burned across the United States, about 36 percent above the annual average for 1983 through 2025. In Canada, about 10.2 million acres have burned, roughly 46 percent above the 25-year average. The National Interagency Fire Center raised the National Preparedness Level to 5, its highest tier, on July 18, 2026, and the Pacific Northwest is already having its most active fire season on record.
For households east of the Rockies, this is the mechanism that matters most. You do not need a fire nearby to get a smoke day. You need a fire upwind and a jet stream pointed at you.
Ground-Level Ozone
Ground-level ozone is a pollutant gas that cars and factories do not release directly. It forms when nitrogen oxides and volatile organic compounds from vehicle exhaust and industrial emissions react in sunlight. The hotter and sunnier the day, the more ozone forms, which is why ozone pollution peaks in summer and concentrates in urban areas with heavy traffic.
Ozone levels typically climb through the afternoon and peak in the early evening. That sunlight dependence is also why an ozone-driven bad-air day usually takes care of itself if you can wait out the afternoon, which is not something you can say about a wildfire smoke event.
Ozone is also the more widespread of the two headline pollutants. The American Lung Association's "State of the Air" 2026 report found more than 129 million people living in counties with failing grades for ozone, compared with about 62 million in counties failing for daily particle pollution spikes.
Stagnant Weather And Temperature Inversions
A temperature inversion flips the normal atmospheric setup, putting warmer air above cooler air near the ground, so it acts like a lid on whatever sits underneath. The Spokane Regional Clean Air Agency describes air stagnation as air becoming trapped in a region with minimal movement, often caused by a high-pressure system that suppresses vertical mixing. When this happens, smoke, exhaust, and industrial emissions build up near the surface instead of dispersing, and the National Weather Service issues an Air Stagnation Advisory to warn residents that pollution levels may climb.
Because the cause here is meteorological rather than chemical, an inversion traps whatever pollution already exists (smoke, exhaust, or ozone alike) for as long as the weather pattern holds. That's how a one-afternoon ozone problem turns into a multi-day one.
Should you run the HVAC fan continuously during an inversion?
Generally, yes, with one condition. Setting the fan to "on" instead of "auto" keeps indoor air cycling through the filter rather than sitting still, and during a multi-day stagnation event, that continuous circulation is what actually removes particles from the room. The condition is the filter itself. A fan running around the clock through a low-MERV filter mostly just moves fine particles around. Continuous fan operation also loads the filter faster, so plan to check it more often than your usual schedule during a stagnation stretch or a smoke event.
Vehicle And Industrial Emissions
Traffic-related pollution supplies a steady background level of nitrogen oxides, sulfur oxides, volatile organic compounds, and fine particles in most cities every day. On their own, these emissions rarely push the AQI into unhealthy territory. Combined with summer heat or a stagnant air mass, that everyday baseline is often what tips a borderline day into a genuinely bad one.
How To Tell Which Cause You're Dealing With
Most explainers list the causes above and leave you to guess which one is happening right now. The table below uses the same distinctions covered in this guide: season, timing, what the air looks and smells like, and how long it tends to last. It won't replace checking the AQI, but if you're standing outside without your phone, these clues usually point to the right cause faster than guessing.
| Likely Cause | When It's Most Likely | What You'll Notice | How Long It Tends To Last |
|---|---|---|---|
| Wildfire Smoke | Any season, can spike without warning. Most common in late summer and fall. | A visible haze or an orange-gray tint to the sky, a smoky smell, sometimes ash on cars or windowsills. | Hours to several weeks |
| Ground-Level Ozone | Hot, sunny, calm summer afternoons. | Rarely visible. Air can feel harsh during exercise, and it's usually worse near highways and in the early evening. | Usually clears by nightfall |
| Stagnant Air or Temperature Inversion | Clear, calm winter mornings, and long stagnant summer stretches. | A general haze or smog sitting low over the area, sometimes fog that won't lift. No specific smell. | Several hours to multiple days |
| Vehicle and Industrial Emissions | Weekday rush hours in urban areas. | A subtle haze near highways or industrial zones. Rarely dramatic on its own. | Continuous, low-level background |
A quick way to use this: if the sky looks normal but the air feels off, think ozone or a background baseline. If the sky looks off (hazy, orange, or just dull), think smoke or an inversion, and check how long the pattern has been sitting in place.
Why Bad Air Days Look Different Depending On Where You Live
The main causes are national. Which one is most likely behind your bad-air day is regional, and it shifts by season.
| Region | Most Likely Cause | Peak Window | What It Usually Looks Like |
|---|---|---|---|
| Pacific Coast and Interior Northwest | Wildfire smoke, then summer ozone in the valleys | July to October | Orange-gray haze, ash on cars, smoke smell that arrives overnight |
| California Interior Valleys | Smoke plus ozone, often stacked | June to October | Persistent haze that does not clear after sunset |
| Southwest (AZ, NM, NV, UT) | Blowing dust and ozone | April to September | Sudden dust walls, or clear-looking air with high afternoon readings |
| Mountain West Valleys (UT, CO, MT, ID) | Winter temperature inversions | November to February | Low, flat gray layer over the valley on a cold clear morning |
| Midwest and Great Lakes | Transported smoke from Canada and the West, summer ozone | June to September | Milky white sky, muted sun, no local fire anywhere |
| Northeast and Mid-Atlantic | Transported smoke, summer ozone, rush-hour baseline | June to September | Hazy afternoons, ozone alerts on the hottest days |
| Southeast | Summer ozone and prescribed burns | March to May, June to August | Light haze near highways, occasional smoke from managed burns |
If you're searching for why the air quality is bad in your specific area, start with the row that matches your region and season, then confirm it against the dominant pollutant listed for your ZIP code on AirNow.
How To Check Today's AQI Levels
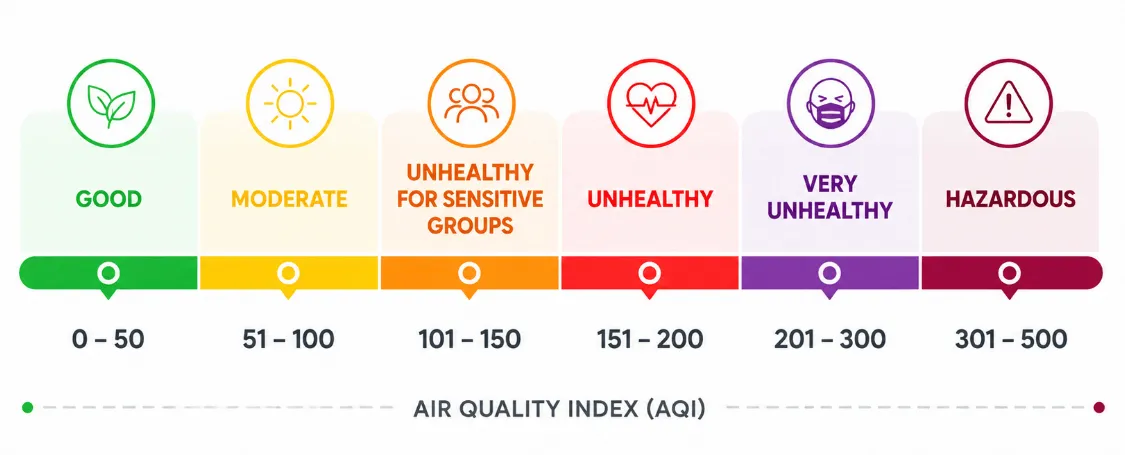
The U.S. Air Quality Index runs from 0 to 500 and translates pollutant concentrations into a single color-coded number. An AQI of 50 or below is Good, while anything above 300 is Hazardous.
The index is calculated from six criteria pollutants: fine particulate matter (PM2.5), coarse particulate matter (PM10), ground-level ozone, nitrogen dioxide, sulfur dioxide, and carbon monoxide. Each pollutant's concentration is converted into its own index number, and the highest of those becomes the AQI for your location. That pollutant is called the dominant pollutant. In most places and on most days, it's PM2.5.
AirNow.gov, a partnership between EPA, NOAA, NASA, the National Park Service, CDC, and the U.S. Forest Service, publishes real-time AQI readings and forecasts for hundreds of U.S. cities and lets you search by ZIP code. Filterbuy's live wildfire and smoke map layers active fire locations and smoke plumes on top of that same AQI data, which helps on days when wildfire smoke is the likely culprit.
| AQI Range | Category | What It Means |
|---|---|---|
| 0–50 | Good | Air quality is satisfactory with little or no health risk. |
| 51–100 | Moderate | Acceptable air quality, though sensitive groups may notice mild effects. |
| 101–150 | Unhealthy for Sensitive Groups | People with asthma, heart disease, or lung conditions may feel effects. |
| 151–200 | Unhealthy | Everyone may begin to experience health effects. |
| 201–300 | Very Unhealthy | Health alert. The entire population is more likely to be affected. |
| 301–500 | Hazardous | Health warning of emergency conditions. Everyone is at risk. |
Here's a detail most explainers skip: the number you see is not a blend of every pollutant in the air. It's whichever single pollutant is scoring worst at that hour. Two cities can both show an AQI of 130 for entirely different reasons. On AirNow, opening the detailed view for your location shows which pollutant is driving the number, which is the fastest way to jump straight to the right section of this guide.
The AQI Changed In 2024, And That Explains A Lot Of Yellow Days
If it feels like your area has shown more "Moderate" yellow days over the last two years, the scale changed underneath you.
On May 6, 2024, EPA tightened the annual health-based national standard for PM2.5 from 12.0 micrograms per cubic meter to 9.0, citing evidence of health risks at lower concentrations than previously recognized. Alongside that, EPA revised the PM2.5 breakpoints in the AQI itself, lowering the threshold at which fine particles stop counting as "Good" and also lowering the thresholds for the Very Unhealthy and Hazardous categories.
What that means in practice:
The category names and the 0-to-500 ranges did not change. Good is still 0 to 50.
The amount of PM2.5 it takes to leave the green did change. A concentration that scored Good before May 2024 can score Moderate now.
State agencies expected more Code Yellow days as a direct result, not because the air got dirtier but because the ruler got stricter.
During wildfire events, the upper-category change matters too. The revised breakpoints can shift some days from Unhealthy to Very Unhealthy, or from Very Unhealthy to Hazardous, at concentrations that would previously have scored one tier lower.
So a 2026 reading and a 2023 reading are not strictly comparable for PM2.5. If you're looking at a multi-year chart of your city's AQI, the 2024 line marks a methodology change, not necessarily a trend.
Why Your Sensor Disagrees With AirNow
Low-cost consumer sensors and neighborhood sensor maps often show a different number than the official AQI for the same area, and both can be reporting honestly.
Different instruments. Regulatory monitors are federally certified reference instruments. Most consumer sensors estimate particle mass optically, and they tend to read high in humid conditions and during dense smoke unless a correction factor is applied.
Different geography. A regulatory monitor may be miles away and sited to represent a broad area. Your sensor represents your block, including the neighbor's fire pit.
Different time math. The official AQI uses NowCast, a weighted average of recent hours designed to smooth out spikes. A consumer sensor often shows the last few minutes. During a fast-moving smoke plume, the raw sensor will look worse first, and the official number will catch up later.
For deciding whether to close the windows right now, your own sensor is useful. For understanding what kind of day it is and how long it will last, use AirNow's dominant pollutant and forecast.
Advisory, Alert, Or Warning: What The Terms Mean
Air Quality Alert or Action Day: issued by state or local air agencies when AQI is forecast to reach unhealthy levels, usually for ozone or PM2.5.
Air Stagnation Advisory: issued by the National Weather Service when a stagnant, high-pressure air mass with weak winds is expected to trap pollution near the ground. It's a forecast about dispersion, not a measurement of pollution.
Red Flag Warning: a fire-weather product about ignition and spread risk. It says nothing directly about current air quality, but it often precedes a smoke day.
Who Is Most At Risk When Air Quality Drops
Ground-level ozone and airborne particles remain the two most widespread air pollution threats to health in the United States. Children, older adults, pregnant women, and anyone with asthma, COPD, or heart disease face the highest risk on unhealthy air days.
The American Lung Association's 27th annual "State of the Air" report, released in April 2026, found that 44 percent of Americans (about 152.3 million people) live in places with failing grades for unhealthy levels of ozone or particle pollution. Nearly half of American children (46 percent, or 33.5 million people under 18) live in counties that received a failing grade for at least one measure, and 7.3 million children live in counties failing all three. More than 24.9 million adults aged 65 and over live in counties with an F for at least one pollutant. Bakersfield, California, has held the worst year-round particle pollution ranking for seven consecutive years.
CDC's climate and health program projects an additional 1,000 to 4,300 premature deaths annually in the United States by 2050 from the combined effects of ozone and particle pollution, assuming no changes in regulations or population characteristics. Its most-cited cost figure for ozone pollution above national standards (roughly $6.5 billion nationwide) is expressed in 2008 dollars and based on an assessment of ozone levels between 2000 and 2002, so treat it as a historical benchmark rather than a current-year number.
This is the group Filterbuy hears from most directly. Households with a child who has asthma or a parent with heart disease usually ask the most specific questions about filtration, not the most general ones.
How To Protect Your Family When Air Quality Is Bad
Most guidance for a bad air quality day focuses on what happens outdoors, but the air inside your home matters just as much once you close the windows. A few simple steps make a real difference:
Check the AQI before spending extended time outdoors, and move heavy exertion indoors once conditions reach Unhealthy for Sensitive Groups or higher.
Keep windows and doors closed during wildfire smoke events or air stagnation advisories, and keep them closed into the evening even after the outdoor number improves.
Run your HVAC system with the fan set to "on" rather than "auto," using a filter rated to capture fine particles rather than just dust.
Avoid adding to indoor pollution with candles, wood-burning fireplaces, or aerosol sprays on already-bad air days.
Sign up for AirNow's free EnviroFlash email alerts or the mobile app so you know before you head out the door.
After a prolonged smoke event, check the filter. See how to recover from wildfire smoke exposure for the full cleanup sequence.
Matching The MERV Rating To Your Household
There is no single "best" MERV rating. There's the one that matches what you're actually filtering:
MERV 8 is the standard for most households, capturing everyday dust, lint, and pollen.
MERV 11 suits households with allergy sufferers or pets, adding finer dust and dander capture.
MERV 13 is the rating built for smoke season, because it captures a larger share of the fine particles that wildfire smoke and combustion leave behind. See Filterbuy's best MERV filter for wildfire smoke.
Odor Eliminator filters add activated carbon for households dealing with smells rather than particles.
Not sure where you land? Filterbuy's MERV rating guide walks you through it.
One note on replacement timing. Filterbuy 4-inch filters normally last 6 to 12 months, and 1-inch filters run on a much shorter cycle. A heavy smoke event compresses both. If your area has been under smoke or a stagnation advisory for more than a few days, check the filter regardless of when you last changed it. A visibly gray filter is doing less work than a clean one, no matter what the rating on the frame says.
"Most people assume bad air quality is somebody else's problem, from a fire or a factory far away. The number on your phone tells you what's happening outside. What happens inside your home once that air comes through the door is still up to you, and that's the part people forget to plan for."
— David Heacock, Founder and CEO, Filterbuy
After manufacturing filters for over a decade and serving more than two million households, Filterbuy has seen firsthand how much indoor air quality depends on choosing the right filter during smoke and ozone events. The gap between the outdoor reading and the air inside the home becomes especially clear every wildfire season. Filter orders and customer support calls consistently rise in the days following Air Stagnation Advisories and major smoke events, often before many homeowners have even checked the condition of their HVAC filter.
Frequently Asked Questions
How can I tell if multiple pollution sources are affecting my area at the same time?
Check the pollutant breakdown on AirNow or local monitoring sites. If both PM2.5 and ground-level ozone are elevated, you are likely experiencing a compound event—such as wildfire smoke combining with heat-driven summer smog. On these days, peak impact occurs in the afternoon when ozone peaks on top of baseline smoke, so outdoor activities should be minimized all day rather than just during peak sun hours.
What is the fastest way to diagnose the primary cause when outdoor conditions are ambiguous?
Use a quick three-step check: 1) Smell and Visibility: A woodsy odor or orange-tinted haze indicates fine particulate smoke. 2) Time of Day: Clear skies with high afternoon AQI that drops after sunset point to ground-level ozone. 3) Weather Pattern: Persistent, calm, low-lying haze in cold or valley conditions indicates a temperature inversion trapping local emissions.
How should homes with fresh-air intake systems manage bad air quality days?
Unlike standard HVAC systems that simply recirculate indoor air, systems with fresh-air ventilation (like ERVs, HRVs, or mechanical intakes) actively draw outdoor air inside. During heavy smoke or high-AQI events, switch your ventilation system to recirculation mode, temporarily shut off fresh-air intakes, or set dampers to closed to prevent polluted air from being pumped directly into your home.
How should households adjust their daily activity risks under the updated AQI breakpoints?
Because the lower PM2.5 thresholds mean the AQI enters "Moderate" and "Unhealthy for Sensitive Groups" at lower particle concentrations, households should treat "Code Yellow" days with greater attention—especially if family members have respiratory conditions. Rather than waiting for a "Code Orange" or "Red" alert, start limiting prolonged outdoor exertion and running indoor air filtration earlier when particle counts begin to rise.
What should I do if upgrading to a MERV 13 filter restricts HVAC airflow?
Thicker MERV 13 filters have higher initial resistance, which can strain older or sensitive HVAC blowers. If you notice reduced airflow, longer cooling cycles, or coil freezing, switch to a deep-pleated filter (e.g., 4-inch instead of 1-inch if your cabinet allows) to increase surface area, or pair a standard MERV 8/11 furnace filter with standalone HEPA air purifiers in key living spaces.