
How Climate Change Is Making Outdoor Air Quality Worse
August 12, 2026
Author: Michelle Wan | Reviewed by David Clark, Licensed HVAC Technician
Published: August 12, 2026
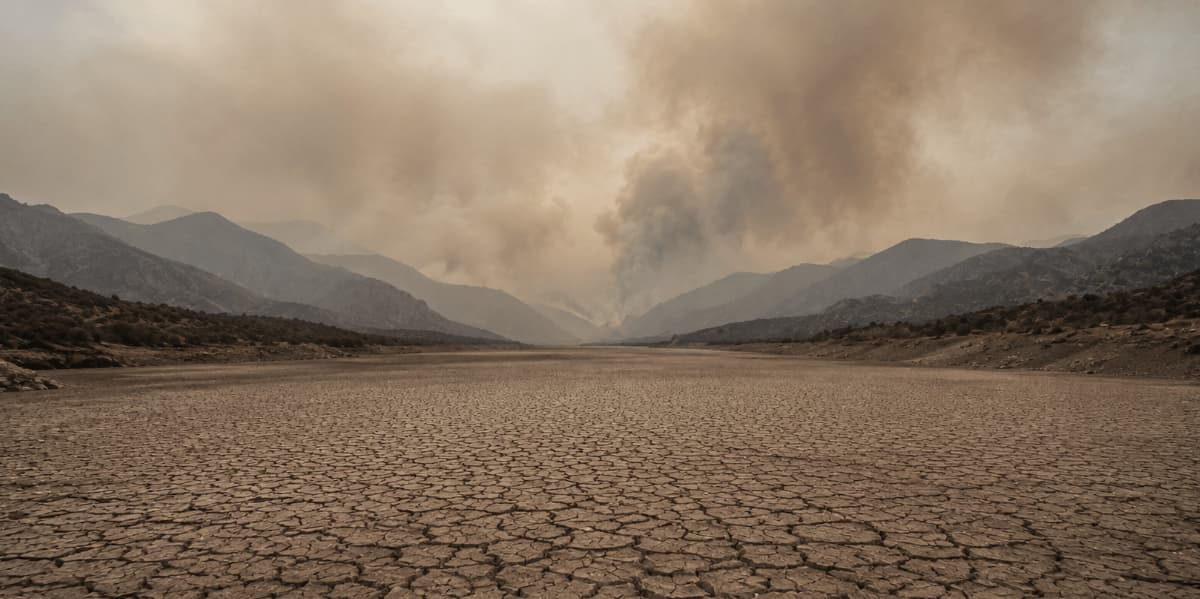
Climate change does not invent a new pollutant. It makes more of the ones already in the air, and it keeps them around longer. Heat speeds up the chemistry that forms ground-level ozone, drought and longer fire seasons carry wildfire smoke into states that rarely saw it, and warmer springs start pollen about 20 days earlier than in 1990.
The American Lung Association puts 44% of Americans, or 152.3 million people, in a county with a failing grade for ozone or particle pollution.
You cannot filter the outdoors, but you can filter what comes inside. Here is how the year has shifted, and the quiz below matches you to a filter.
Answer 3 quick questions and we will match you to your filter.
Know your size already? Shop air filters at Filterbuy — made in the U.S.A. and shipped factory-direct.
TL;DR
Climate change is making U.S. outdoor air quality worse by adding heat, drought and fire to an atmosphere we spent 55 years cleaning up. Hotter days accelerate ground-level ozone formation. Longer fire seasons push fine particle pollution (PM2.5) into states that never used to see it. Air quality progress has stalled or reversed in much of the country, even as emissions keep falling.
Key Takeaways
44% of Americans, or 152.3 million people, live in counties with failing grades for ozone or particle pollution, according to the American Lung Association "State of the Air" 2026 report.
Heat directly manufactures ozone. Ground-level ozone forms when nitrogen oxides and volatile organic compounds react in sunlight, and hotter air speeds that reaction up. The EPA calls the resulting setback the climate penalty.
Wildfire smoke has erased roughly a quarter of U.S. air quality progress since 2000 in nearly three-quarters of contiguous states, and more than half of it across many western states, per a 2023 study in Nature led by Stanford's Marshall Burke.
Fire seasons in parts of the western U.S. now run more than a month longer than they did 35 years ago, according to U.S. Forest Service research cited by NASA.
Pollen seasons start about 20 days earlier and carry about 21% more pollen than in 1990, per Anderegg et al. in PNAS - a separate climate-driven pressure on the same lungs.
How Does Climate Change Make Outdoor Air Quality Worse?
Climate change worsens outdoor air quality through four physical pathways, not one. Warming accelerates the chemistry that creates ozone, dries vegetation that then burns and releases fine particles, lengthens the growing seasons that produce pollen, and increases the stagnant patterns that trap pollution in place. Each acts on a different pollutant, in a different season.
The distinction matters. The U.S. has cleaner emissions than it did a generation ago, yet the air on a given summer day can be worse. The Clean Air Act cut what leaves tailpipes and smokestacks. It did nothing about a burning forest 900 miles upwind. Global warming does not invent a new pollutant. Warming changes how much of the existing air pollution the atmosphere produces, and how long it lingers where people live.
We come at this from a particular angle. Filterbuy has built pleated air filters in the United States since 2012, and we run a live air quality and wildfire smoke map alongside the factory. That vantage point shapes how we read the problem. Whatever the outdoor air is doing on a given day, the last thing standing between it and your lungs is usually a filter in a hallway return.
The same viewpoint explains why we built the table below. Most coverage folds every mechanism into a single story about worse air, which is no help when what you need to know is which months to prepare for.
The Four Pathways, Side By Side
Why Hotter Summers Produce More Ground-Level Ozone
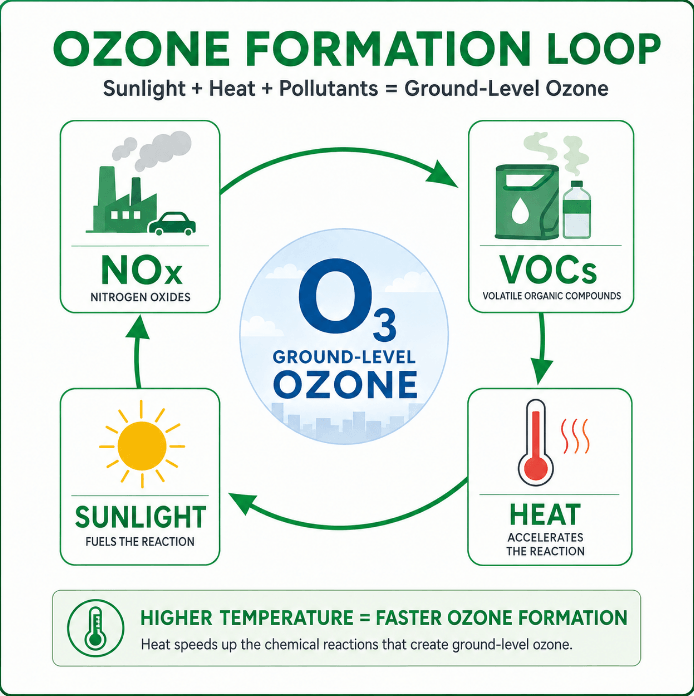
Ground-level ozone is not emitted directly. It is manufactured when nitrogen oxides (NOx) and volatile organic compounds (VOCs) from vehicles, power plants and solvents react in sunlight. Heat speeds that reaction, so the same precursor pollution produces more ozone on a hot day than a mild one.
The EPA calls this the climate penalty: warming quietly eats into the gains that emissions rules were supposed to deliver. The effect is modest per degree, but it is measurable. An open-access study of Colorado's Front Range in the Journal of Exposure Science & Environmental Epidemiology put the region's ozone climate penalty at 0.5 to 1.0 parts per billion, enough to delay projected attainment of the 2008 and 2015 federal ozone standards by about two years each.
The national picture in 2026 reflects it. The American Lung Association's 27th "State of the Air" report found unhealthy ozone affecting more people than in any of the previous five editions, with nearly 4 million more than the year before. Los Angeles has ranked worst for ozone in 26 of the report's 27 years.
For the practical version, our guide to what MERV rating to use on high-AQI days translates ozone and smoke readings into a filter choice.
How Longer Wildfire Seasons Are Undoing Decades Of Pm2.5 Progress
Wildfire smoke is the single largest reason U.S. air quality trends have flattened. A 2023 study in Nature led by Marshall Burke of the Stanford Doerr School of Sustainability found that since 2016, wildfire smoke has shaped PM2.5 trends in nearly three-quarters of contiguous U.S. states, eroding about 25% of the progress made since 2000 in those states, and more than 50% across many western ones.
The climate link is well documented. NOAA reports that warming and increased atmospheric thirst drove more than half the observed drying of forest fuels in the western U.S. between 1979 and 2015, and contributed to a doubling of forest area burned from 1984 to 2015. U.S. Forest Service research cited by NASA found fire seasons now start earlier in spring and run later into fall, with parts of the western U.S. seeing seasons more than a month longer than 35 years ago.
The 2026 season is tracking that pattern. As of August 10, 2026, the National Interagency Fire Center reported roughly 6.35 million acres burned nationally across about 46,000 wildfires, above the 10-year average for both, with peak fire weather still ahead.
The part homeowners underestimate is reach. Smoke rides weather systems for days, which is how Canadian boreal fires set off air quality alerts in Chicago, New York and along the Gulf Coast. Wildfire smoke has become a national problem, which is why our guide to wildfire smoke and the air quality index now matters in states that have never had a major fire.
There is a regulatory wrinkle on top of that. Under the Clean Air Act, wildfire smoke counts as an exceptional event, so a growing share of what you breathe sits outside the system that cleaned up the rest.
The Air Quality Calendar Has Shifted
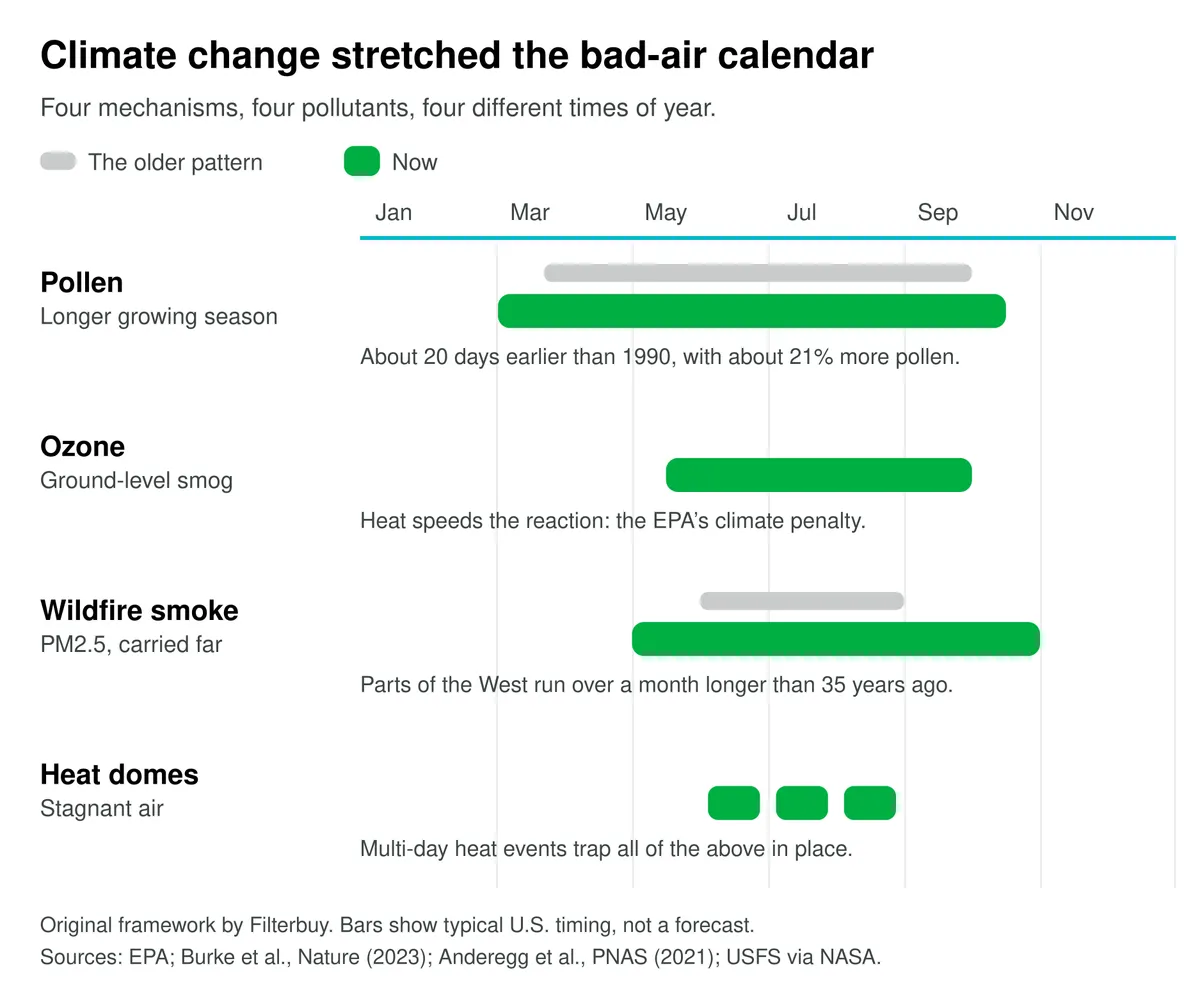
Here is the consequence most coverage misses, and the reason we built this page. Climate change made bad air days worse. It also moved them, so the season you plan around is no longer the season you live in.
The question I get is always some version of when should I change my filter. The honest answer now is that the calendar people inherited was built for a different climate. Spring starts earlier, fire season runs later, and the two are beginning to overlap.
— Michelle Wan
How The Outdoor Air Quality Calendar Has Moved
Original framework by Filterbuy. Figures reflect the cited peer-reviewed and agency sources.
The practical effect is that a filter-change habit built on two fixed dates was designed for a climate that has since moved out from under it. EPA wildfire guidance notes that filters can load noticeably faster during heavy smoke, which makes inspection a better guide than the calendar.
Supporting Statistics
Three independent datasets back the mechanisms above. Two come from federal agencies and one from a national lung-health nonprofit, and each measures a different link in the chain: the heat that drives ozone, the particle spikes that mark a smoke event, and the health cost of both.
Heat waves have roughly tripled.
2 a year in major U.S. cities in the 1960s. About 6 today.
The heat wave season runs 46 days longer.
Heat drives ozone. A longer hot season is a longer ozone season.
Source: Trends in Ozone Adjusted for Weather Conditions
61.5 million Americans live with F-grade particle spikes.
Down 15.6 million from last year, breaking seven years of increases.
Still far above the 35.1 million low of 2018.
Daily PM2.5 spikes are what a smoke event looks like on a monitor.
Source: American Lung Association, "State of the Air" 2026
The projected health cost is high, but not fixed.
EPA models 21,000 extra PM2.5 deaths and 4,100 extra ozone deaths, 2000 to 2095.
Full implementation of current controls cuts those to about 15,000 and 640.
Emissions policy still moves the number.
Source: U.S. EPA, CMAQ climate and air quality modeling
What This Looks Like Where You Live
National averages hide the thing you actually need to know. The four pathways are not spread evenly across the country, and the one that matters most depends on where you live. It is the question we get asked more than any other, so here is our read.
Which Pressure Dominates, By Region
Original synthesis by Filterbuy from American Lung Association "State of the Air" 2026 and Climate Central regional freeze-free season data (2026).
One honest limitation: these are regional generalizations, and air quality is stubbornly local. A valley traps pollution that a ridge ten miles away never sees. Treat the table as a starting point, then check your own county on the Filterbuy live air quality map.
What This Means For The Air Inside Your Home
You cannot filter the outdoors. You can filter what comes in.
Outdoor PM2.5 and pollen enter through open windows, door gaps and ordinary building leakage, then recirculate through your HVAC system. That makes your air filter the one control point most homeowners actually own.
Filter choice is the part we know first-hand. Filterbuy is a family-owned manufacturer that has made pleated filters in the U.S. since 2012, in more than 600 sizes, with our own testing lab. Three things follow from that experience.
Filter rating matters more than it used to. MERV 13 filters capture a meaningful share of the PM2.5 range, including smoke particles that lower-rated filters pass straight through. Basic fiberglass filters protect equipment, not lungs.
Replacement timing should follow the air, not the calendar. During heavy smoke or high-pollen stretches, filters load faster. One that normally lasts 90 days may need replacing much sooner.
The window to prepare for is wider. A spring change and a fall change were built for a shorter, more predictable pollution year than the one we have now.
Check the air where you actually live. The Filterbuy live air quality index and wildfire smoke map show current AQI by area, so you can see whether today is a day to keep the windows shut. If it is, MERV 13 air filters are the step most homes make for fine-particle days, and you can shop air filters by size to find the fit for your system, shipped factory-direct from our U.S. plants.
How We Researched This Page
Filterbuy makes air filters. We are not a climate lab, so we are deliberate about where these numbers came from.
Every statistic comes from a federal agency or a peer-reviewed journal, never a secondary news write-up.
We opened and read each source rather than relying on search summaries, and checked every link on August 12, 2026.
The three tables are our own synthesis. The data belong to other people; the arrangement is ours, and we label it as such under each one.
One finding worth passing on: EPA's ragweed pollen indicator, a page we expected to cite, now returns a 404. We dropped it rather than link a dead page. Where a claim is about your health rather than your filter, check it against EPA or the American Lung Association directly, including ours.
Frequently Asked Questions
Is air quality in the U.S. getting better or worse?
Both, depending on the pollutant. Emissions from vehicles, power plants and industry have fallen sharply since the Clean Air Act, but climate-driven ozone and wildfire smoke have offset much of that gain. The American Lung Association found 44% of Americans still live where the air earns a failing grade.
Who is most at risk from these changes?
Children, older adults, and people with asthma or COPD. The American Lung Association reports that 46% of American children, about 33.5 million, live in a county with a failing grade for at least one measure of air pollution. Children breathe more air for their body size than adults and spend more time outdoors.
Does climate change cause wildfires?
No. People and lightning ignite fires. Climate change creates the conditions that let them spread farther and burn longer, by drying fuels, extending fire weather seasons, and intensifying drought and heat.
Why does my area have smoke when there is no fire nearby?
Smoke travels for days across thousands of miles at altitude before descending. Alerts routinely reach the Midwest, Northeast and Southeast from fires in the western U.S. and Canada. You can track current smoke and AQI on our map.
Does ozone affect indoor air?
Ozone does get indoors, at reduced concentrations. Standard particle filters do not remove it; activated carbon media such as the Filterbuy Odor Eliminator filter can help reduce it. The most effective step during an ozone alert is limiting outdoor air exchange during peak afternoon hours.
Can an air filter help with wildfire smoke?
Yes, within limits. EPA wildfire guidance recommends MERV 13 or higher during smoky periods if your HVAC system can handle it. It will not help with the system off, and it will not seal a leaky house, but it is the most practical whole-home defense available.
Glossary
Air Quality Index (AQI): The EPA 0 to 500 scale for reporting daily outdoor air quality, color-coded from green (good) to maroon (hazardous).
Climate penalty: The EPA term for the way rising temperatures increase ground-level ozone, offsetting reductions achieved by emissions controls.
Fire weather season: The portion of the year when temperature, humidity, wind and fuel dryness together make wildfire ignition and spread likely.
Filterbuy: A family-owned American manufacturer of pleated HVAC air filters, based in Talladega, Alabama, producing more than 600 stock sizes plus custom sizes and operating a live U.S. air quality and wildfire smoke map.
Ground-level ozone (tropospheric ozone): A lung irritant and the main component of smog, formed when NOx and VOCs react in sunlight near the surface. Distinct from the protective stratospheric ozone layer.
MERV: Minimum Efficiency Reporting Value, the 1 to 16 scale rating how well an HVAC filter captures airborne particles. MERV 13 captures a meaningful share of the PM2.5 range.
NOx (nitrogen oxides): Combustion byproducts from vehicles and power plants; an ozone precursor.
PM2.5: Fine particulate matter 2.5 micrometers or smaller, roughly one thirtieth the width of a human hair. Small enough to reach deep lung tissue and enter the bloodstream. The main health hazard in wildfire smoke.
VOCs (volatile organic compounds): Carbon-based gases from fuels, solvents and vegetation; the second ozone precursor.
Sources
Burke, M. et al., "The contribution of wildfire to PM2.5 trends in the USA," Nature (2023)
Anderegg, W.R.L. et al., "Anthropogenic climate change is worsening North American pollen seasons," PNAS (2021)
Crooks, J.L. et al., "The ozone climate penalty, NAAQS attainment, and health equity along the Colorado Front Range," JESEE (2021)
U.S. EPA, "Wildfires and Indoor Air Quality"
American Lung Association, short-term particle pollution trends, "State of the Air" 2026
NOAA, "Wildfire climate connection"
NASA Science, "Wildfires and Climate Change"
National Interagency Fire Center, year-to-date statistics (accessed August 12, 2026)
Climate Central, "Warmer Growing Season, Longer Allergy Season" (2026)