May 5, 2026

By David Heacock
According to data from the Census Bureau, the typical American family spends about $2,850 per year-or about 22 percent of total housing costs-on their utility bills. With working from home on the rise due to the COVID-19 pandemic, Americans are beginning to experience one of the hidden costs of working remotely: increased utility spending.
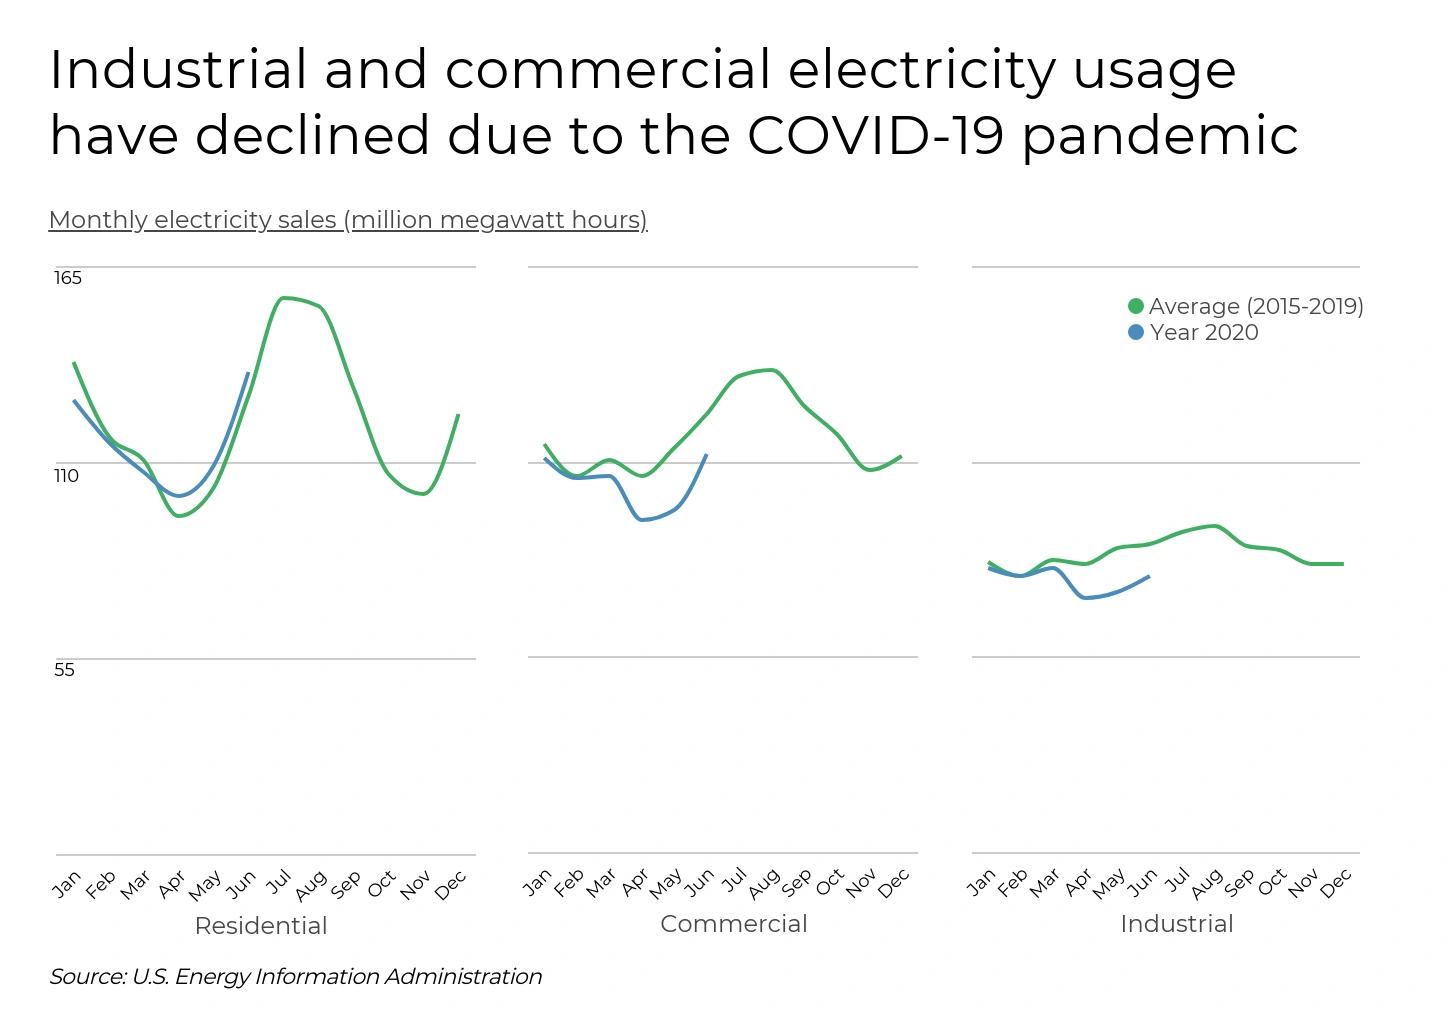
Data from the U.S. Energy Information Administration (EIA) shows that industrial and commercial electricity usage have both declined due to shutdowns, stay-at-home orders, and increased remote working in the wake of the pandemic. In contrast, residential electricity usage in the last few months is higher than the average for the last 5 years. Not only has working from home led to increased electricity, internet, and phone usage for residential customers, but many Americans are using more energy for things like cooking and running the dishwasher more frequently as well.
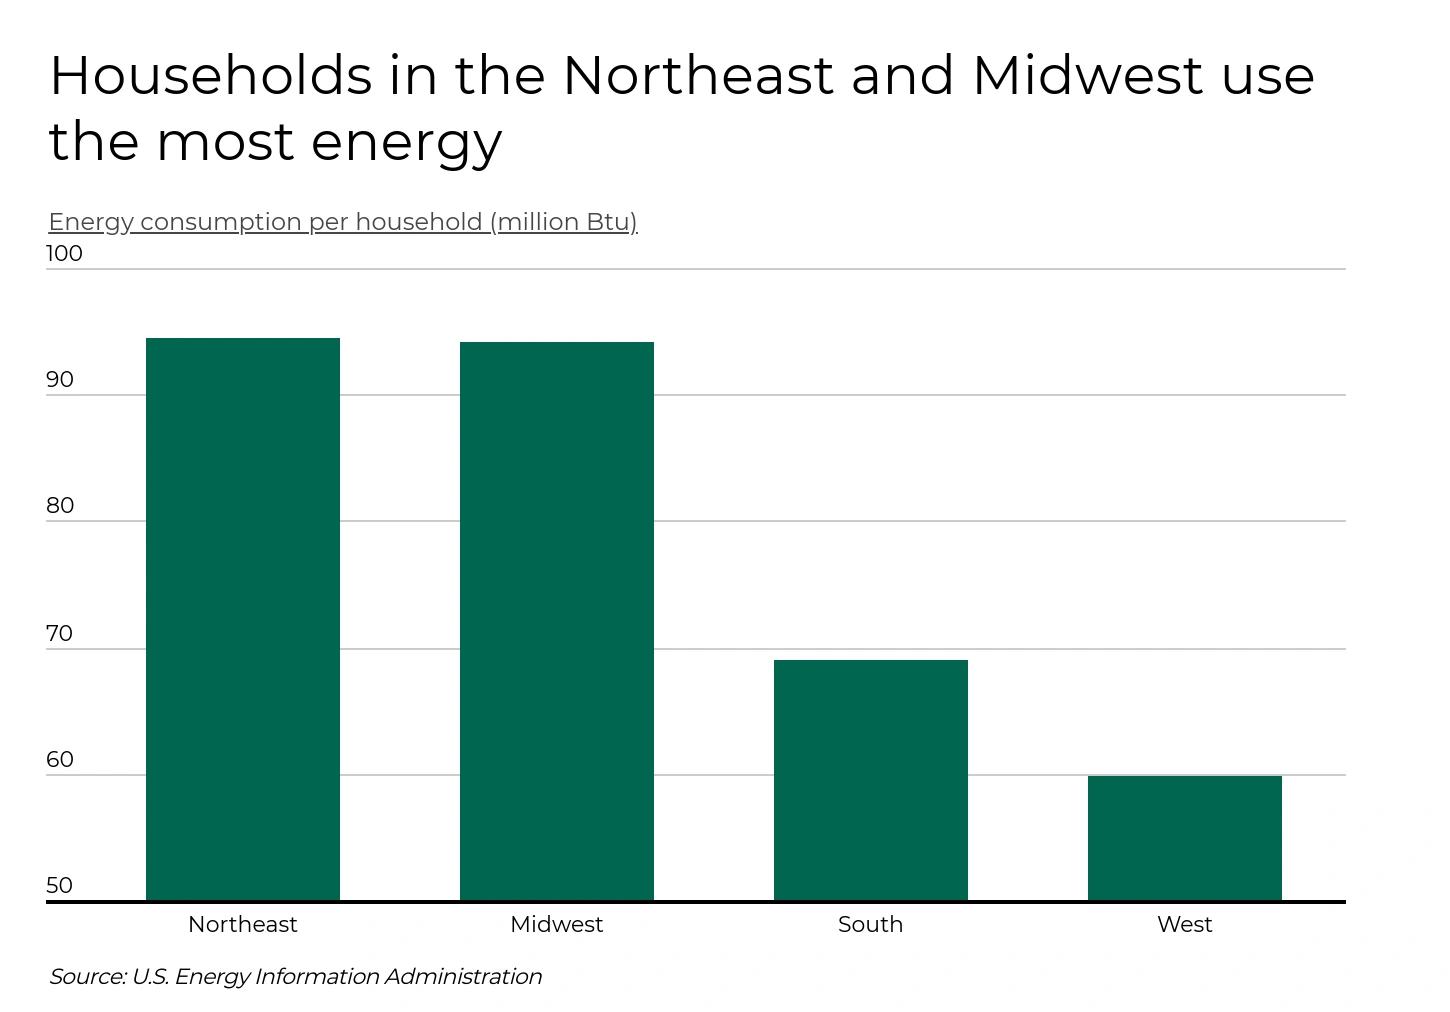
Energy usage depends greatly on climate. Households in colder climates tend to use a lot of energy in the winter for heating, while people in warmer climates see their highest energy usage during the summer months. According to data from the EIA, households in the Northeast and Midwest use the most energy on average. Households in the more temperate West region use the least.
Spending on utilities depends not only on climate but also on energy costs, which vary geographically. With total utility spending (including electric, gas, other heating fuels, water, and sewer) in excess of $280 per month for the typical household, residents in Connecticut, Massachusetts, Alaska, and Rhode Island spend the most on utilities. Total utility spending is lowest in New Mexico, Montana, and Idaho, where median utility costs are less than $200 per month.
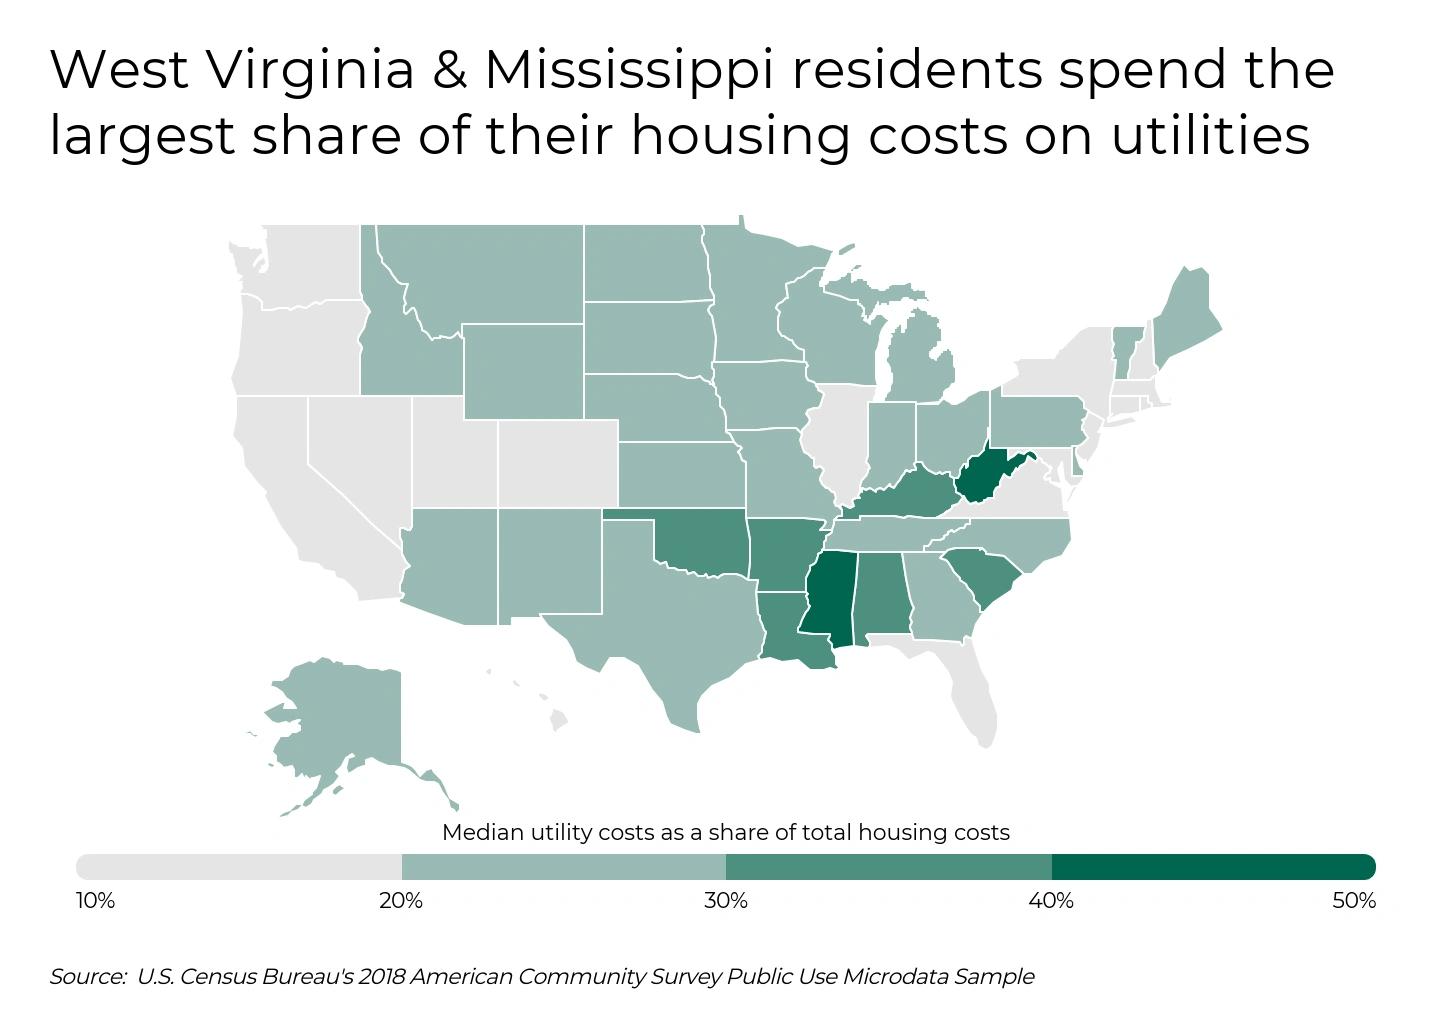
West Virginia and Mississippi households spend the most on utilities as a percentage of total housing costs. Median utility costs as a percentage of total housing costs is 50.1 percent for West Virginia and 41.7 percent for Mississippi homeowners. At the other end of the spectrum, Hawaii and California homeowners spend the smallest share of their housing costs on utilities, at 14.1 and 13.4 percent, respectively.
TRENDING Especially if you work from home, we recommend ordering air filter replacements at least once every 90 days. To learn more about the different types of filters available, review our recently released guide: Which Air Filters Should I Choose?
To find the metropolitan areas that spend the most on utilities, researchers at Filterbuy analyzed the latest data from the U.S. Census Bureau on owner-occupied housing units. The researchers ranked metro areas according to their respective median monthly utility costs, including electricity, gas, other heating fuels, water, and sewer. The researchers also calculated median monthly utility costs as a percentage of total housing costs.
To improve relevance, only metropolitan areas with at least 100,000 people were included in the analysis. Additionally, metro areas were grouped into the following cohorts based on population size:
Small metros: 100,000–349,999
Midsize metros: 350,000–999,999
Large metros: 1,000,000 or more
Here are the metropolitan areas that spend the most on utilities.
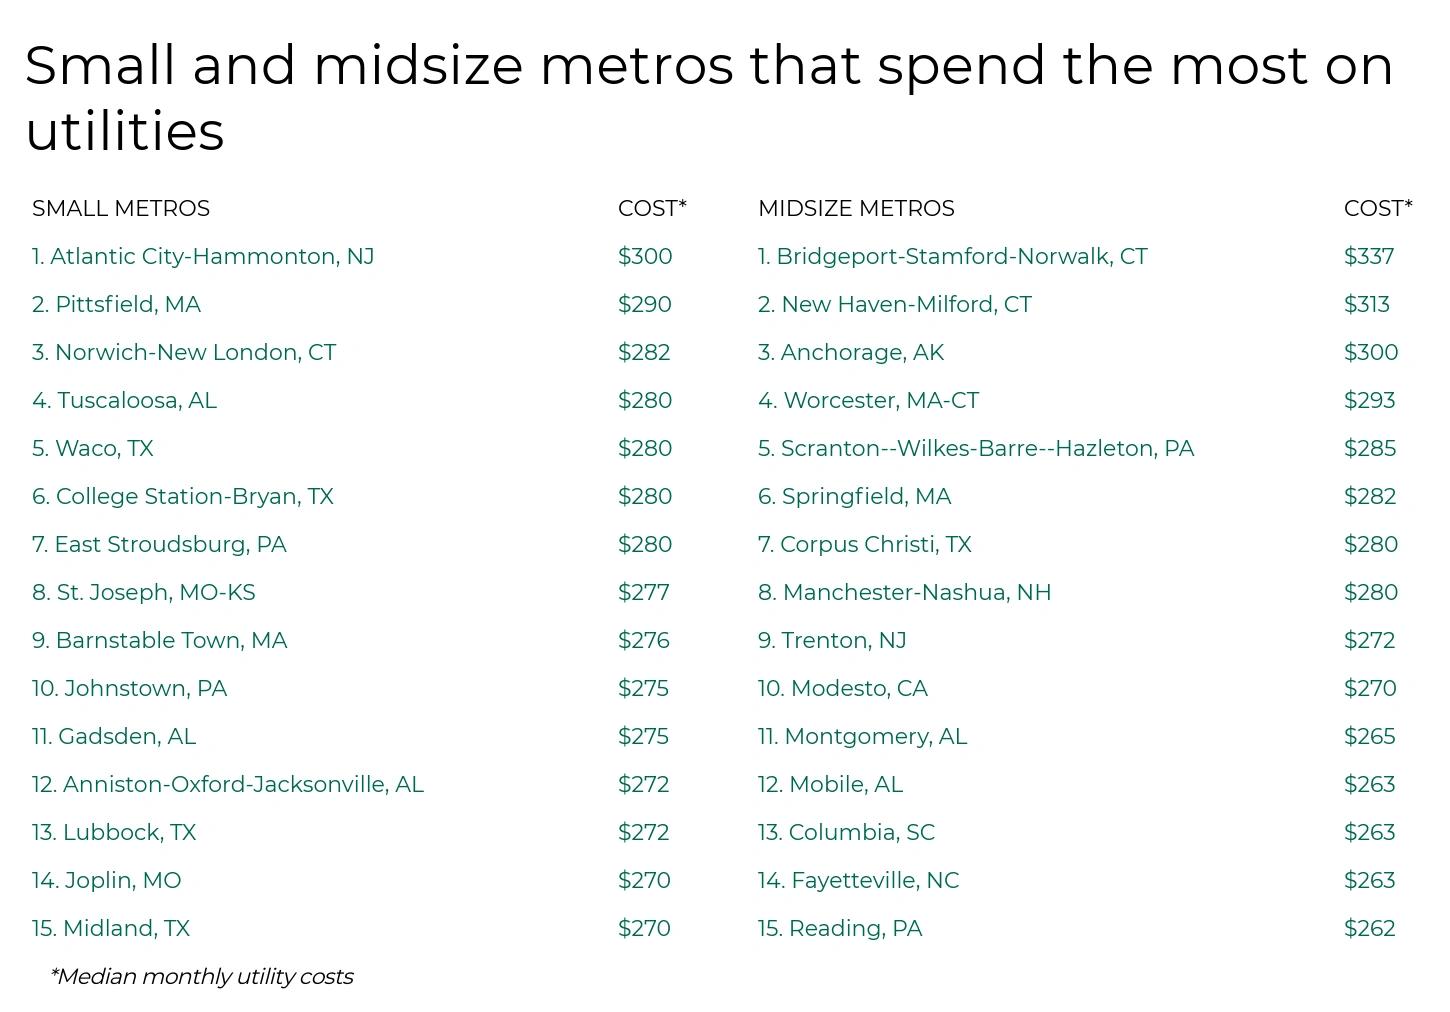

Photo Credit: Alamy Stock Photo
Median total utility costs: $252
Median utility costs as a percentage of total housing costs: 12.6%
Median electric costs: $140
Median gas costs: $80
Median other fuel costs (oil, coal, kerosene, wood, etc.): $63
Median water and sewer costs: $50

Photo Credit: Alamy Stock Photo
Median total utility costs: $253
Median utility costs as a percentage of total housing costs: 26.3%
Median electric costs: $190
Median gas costs: $60
Median other fuel costs (oil, coal, kerosene, wood, etc.): $17
Median water and sewer costs: $20

Photo Credit: Alamy Stock Photo
Median total utility costs: $255
Median utility costs as a percentage of total housing costs: 25.5%
Median electric costs: $140
Median gas costs: $80
Median other fuel costs (oil, coal, kerosene, wood, etc.): $42
Median water and sewer costs: $42

Photo Credit: Alamy Stock Photo
Median total utility costs: $255
Median utility costs as a percentage of total housing costs: 27.2%
Median electric costs: $150
Median gas costs: $80
Median other fuel costs (oil, coal, kerosene, wood, etc.): $33
Median water and sewer costs: $58

Photo Credit: Alamy Stock Photo
Median total utility costs: $258
Median utility costs as a percentage of total housing costs: 16.5%
Median electric costs: $120
Median gas costs: $50
Median other fuel costs (oil, coal, kerosene, wood, etc.): $29
Median water and sewer costs: $83

Photo Credit: Alamy Stock Photo
Median total utility costs: $267
Median utility costs as a percentage of total housing costs: 29.8%
Median electric costs: $120
Median gas costs: $90
Median other fuel costs (oil, coal, kerosene, wood, etc.): $75
Median water and sewer costs: $58

Photo Credit: Alamy Stock Photo
Median total utility costs: $270
Median utility costs as a percentage of total housing costs: 19.8%
Median electric costs: $150
Median gas costs: $70
Median other fuel costs (oil, coal, kerosene, wood, etc.): $50
Median water and sewer costs: $66

Photo Credit: Alamy Stock Photo
Median total utility costs: $278
Median utility costs as a percentage of total housing costs: 20.2%
Median electric costs: $150
Median gas costs: $90
Median other fuel costs (oil, coal, kerosene, wood, etc.): $100
Median water and sewer costs: $50

Photo Credit: Alamy Stock Photo
Median total utility costs: $280
Median utility costs as a percentage of total housing costs: 21.1%
Median electric costs: $170
Median gas costs: $50
Median other fuel costs (oil, coal, kerosene, wood, etc.): $17
Median water and sewer costs: $70

Photo Credit: Alamy Stock Photo
Median total utility costs: $280
Median utility costs as a percentage of total housing costs: 33.1%
Median electric costs: $180
Median gas costs: $50
Median other fuel costs (oil, coal, kerosene, wood, etc.): $29
Median water and sewer costs: $40
Photo Credit: Alamy Stock Photo

Median total utility costs: $283
Median utility costs as a percentage of total housing costs: 25.7%
Median electric costs: $150
Median gas costs: $70
Median other fuel costs (oil, coal, kerosene, wood, etc.): $39
Median water and sewer costs: $50

Photo Credit: Alamy Stock Photo
Median total utility costs: $283
Median utility costs as a percentage of total housing costs: 18.7%
Median electric costs: $140
Median gas costs: $100
Median other fuel costs (oil, coal, kerosene, wood, etc.): $117
Median water and sewer costs: $40

Photo Credit: Alamy Stock Photo
Median total utility costs: $283
Median utility costs as a percentage of total housing costs: 20.0%
Median electric costs: $120
Median gas costs: $100
Median other fuel costs (oil, coal, kerosene, wood, etc.): $117
Median water and sewer costs: $42
Photo Credit: Alamy Stock Photo
Median total utility costs: $300
Median utility costs as a percentage of total housing costs: 14.9%
Median electric costs: $150
Median gas costs: $100
Median other fuel costs (oil, coal, kerosene, wood, etc.): $150
Median water and sewer costs: $46

Photo Credit: Alamy Stock Photo
Median total utility costs: $309
Median utility costs as a percentage of total housing costs: 16.5%
Median electric costs: $130
Median gas costs: $100
Median other fuel costs (oil, coal, kerosene, wood, etc.): $125
Median water and sewer costs: $50
Residents in the eastern half of the country spend more total on utilities than those in the western half, with Alaska being the notable exception. Residents in the Northeast in particular-with hot summers and cold winters-spend the most on utilities. Nationally, the median total monthly utility bill is $238, and median utility costs as a share of total housing costs comes out to about 22 percent for American homeowners.
For the small and midsize metros that spend the most on utilities, many homeowners in these areas spend upwards of 30-40 percent of their total housing expenditures on utilities. Workers in these metros who are now working from home due to the pandemic could see these costs rise even higher. These workers will save on commuting costs, but their increased spending on energy and other utilities could add up to more than what they’re saving by staying home.
To determine the metros that spend the most on utilities, researchers at Filterbury analyzed the latest data from the U.S. Census Bureau’s 2018 American Community Survey Public Use Microdata Sample (ACS PUMS). The researchers ranked metro areas according to median total utility costs. In the event of a tie, the metro with larger median total utility costs as a percentage of total housing costs was ranked higher. Only households who owned their home were included in the analysis.
Only metropolitan areas with at least 100,000 people were included in the analysis. Additionally, metro areas were grouped into the following cohorts based on population size:
Small metros: 100,000–349,999
Midsize metros: 350,000–999,999
Large metros: 1,000,000 or more