May 5, 2026

By David Heacock
Where people choose to live, work, and grow their families is one of the most important decisions they can make. Climate, cost of living, economic opportunities, proximity to family, friends, or desirable amenities may all be factors to consider when deciding where to live. But one overlooked factor is environmental health - air quality being one of the most important considerations.
Air quality matters because pollution is associated with many health issues. High pollutant rates can affect children’s development, cause or worsen respiratory problems like asthma or emphysema, and put people at heightened risk of severe health events like a heart attack or stroke. As with many health issues, air pollution disproportionately impacts low-income communities. That said, there isn’t a meaningful correlation between levels of air pollution and the cost of living at the city level. Some of the highest levels of air pollution are in the nation’s most expensive and sought-after metropolitan areas.
Air quality has long been a problem in the U.S. For much of the 19th and 20th centuries, the growth of the economy brought heightened levels of air pollution through increased fuel combustion and industrial or chemical processes. More recently, the acceleration of global warming has contributed to drought, wildfires, and other conditions that can raise levels of particulate matter and other pollutants in the air.
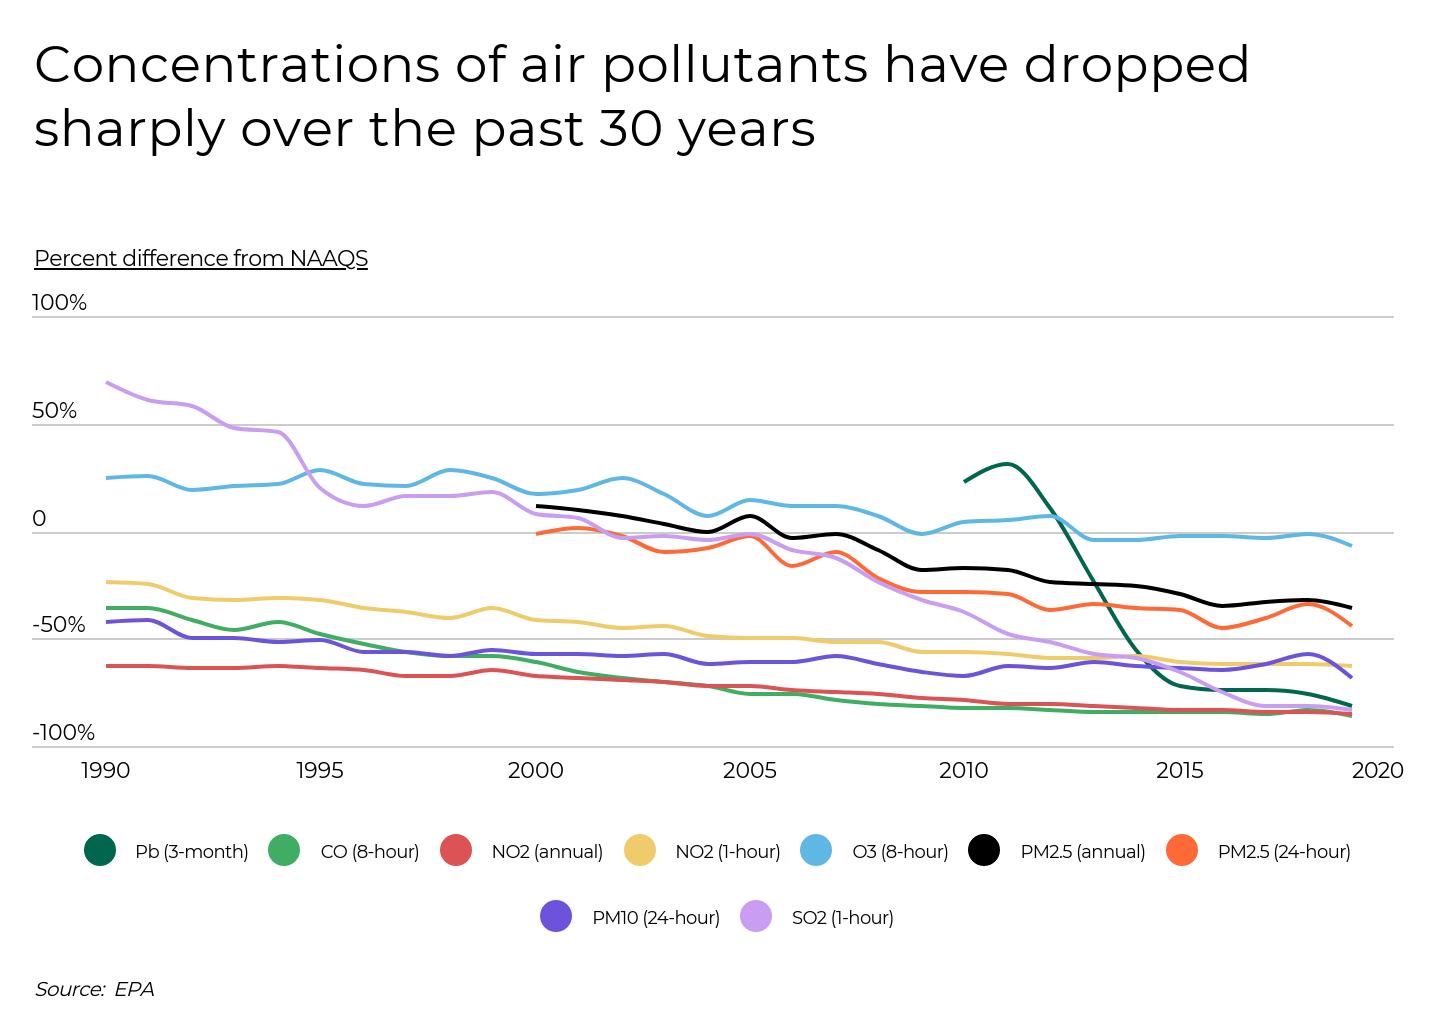
Fortunately, air quality has also been improving over time since the passage of the Clean Air Act and the creation of the Environmental Protection Agency several decades ago. Under the Clean Air Act, the EPA sets air quality standards (NAAQS) for certain airborne pollutants that have been deemed harmful to human health and the environment. To help meet these standards, the EPA can set rules around acceptable pollution levels from sources like industry or vehicles. Over the years, these policies have had a strong track record, leading to steady decreases across all monitored air pollutants.
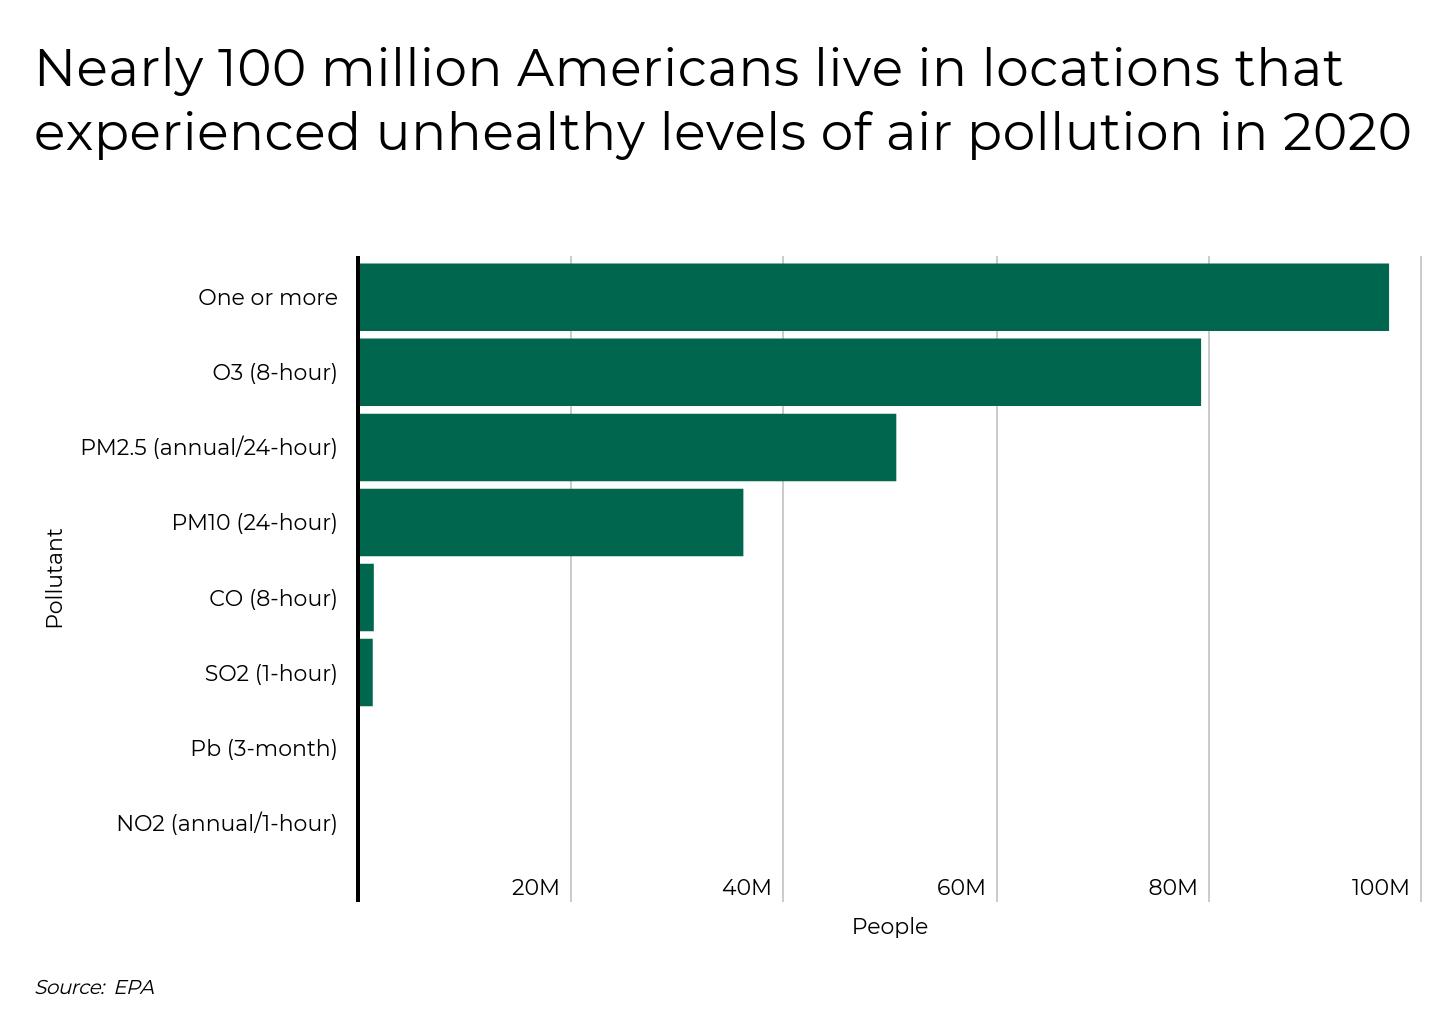
Despite this improvement, air pollution remains a concern for many parts of the United States. Nearly 100 million Americans—almost one-third—live in a location that experienced unhealthy levels of air pollution in 2020, which the EPA calculates by whether counties have pollutants at concentrations above the NAAQS. Americans most commonly experience pollution from ozone and particulate matter, but some communities also have high levels of carbon monoxide and sulfur dioxide.
RELATED
Replacing your home air filters regularly can dramatically improve the air quality inside your home. If you’re dealing with particularly problematic conditions, consider using MERV 13 air filters.
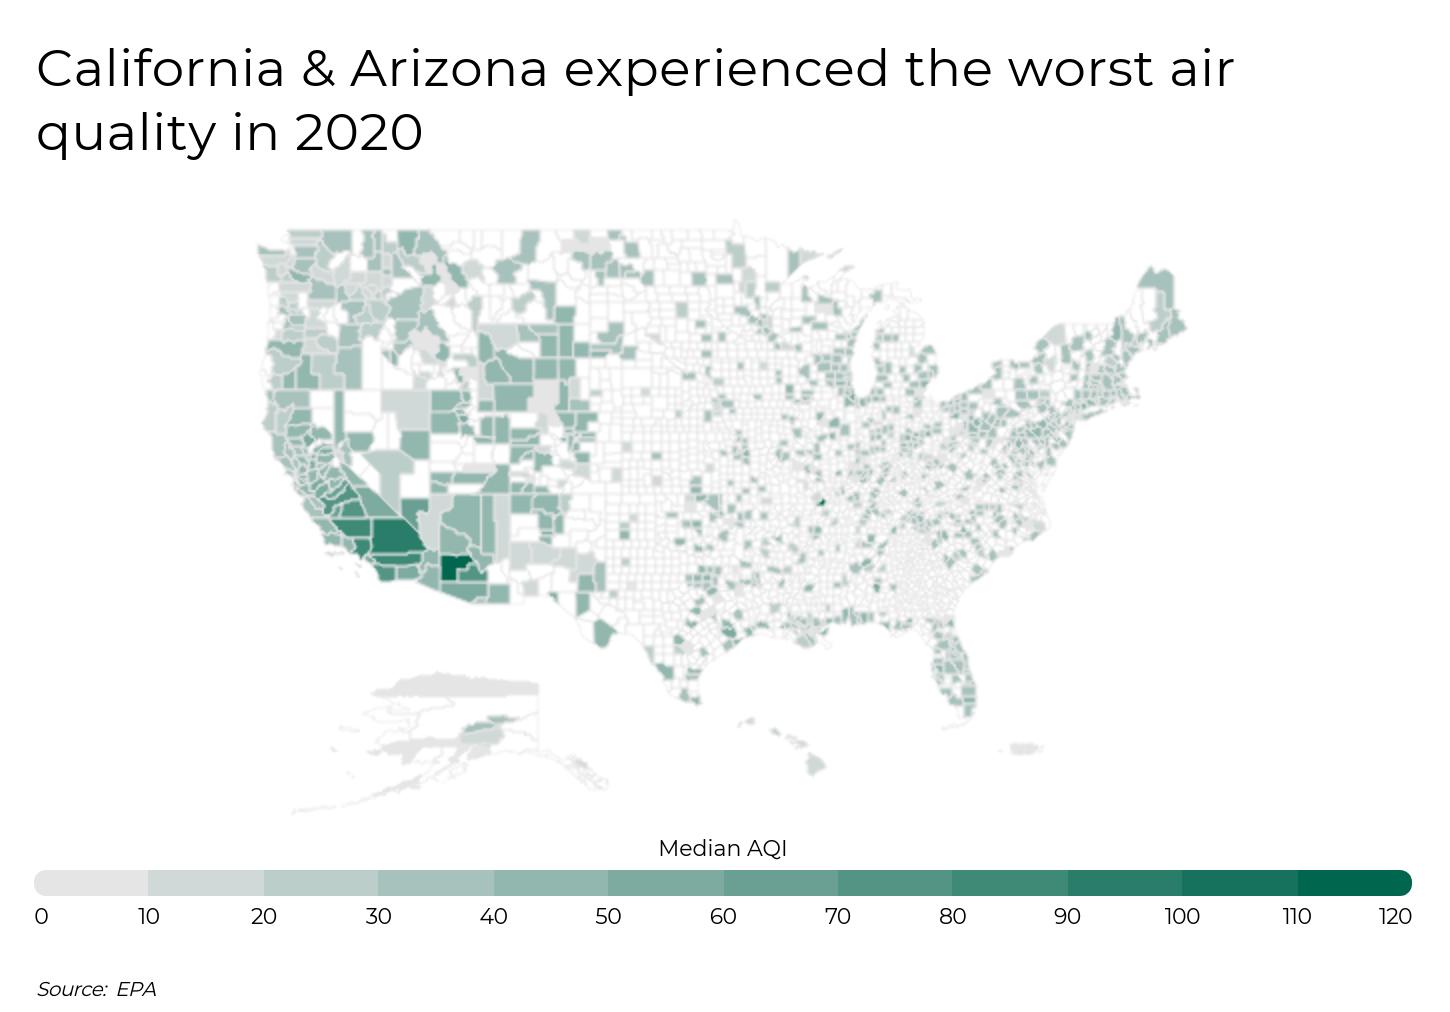
The air quality issue is worse in some parts of the country than in others. Most notably, residents in the Southwest—especially California and Arizona—typically experience the worst air quality in any given year. Much of the reason for this is climate and geography. The Southwest is mostly desert or other dry lands with greater susceptibility to dust storms, wildfires, and other events that increase levels of particulate matter in the air. Furthermore, metropolises like Los Angeles and Phoenix have a dispersed population, which increases dependence on cars and, with it, pollutants like ozone. Most metros where air pollution is highest are unsurprisingly found in California and elsewhere in the Southwest.
The data used in this analysis is from the U.S. Environmental Protection Agency and the U.S. Bureau of Economic Analysis dataset. To identify the most expensive locations with the worst air quality, researchers at Filterbuy looked at the median daily air quality index (AQI) for each metropolitan area in 2020. The AQI is a broad measure of air pollution that takes into account the concentrations of major air pollutants regulated by the Clean Air Act. Higher AQI values correspond to higher levels of air pollution. Only locations with a cost of living greater than the national average, as determined by the Bureau of Economic Analysis, were included in the study.
Here are expensive metropolitan areas with the worst air quality:

Photo Credit: You Touch Pix of EuToch / Shutterstock
15. Oxnard-Thousand Oaks-Ventura, CA
Median AQI: 47
Max AQI: 174
Unhealthy or hazardous days: 26
Moderate Days: 115
Good Days: 225
Cost of living (compared to average): +17.0%

Photo Credit: Sean Pavone / Shutterstock
14. Philadelphia-Camden-Wilmington, PA-NJ-DE-MD
Median AQI: 48
Max AQI: 143
Unhealthy or hazardous days: 8
Moderate Days: 152
Good Days: 206
Cost of living (compared to average): +5.3%
Photo Credit: marekuliasz / Shutterstock
13. Fort Collins, CO
Median AQI: 48
Max AQI: 157
Unhealthy or hazardous days: 19
Moderate Days: 125
Good Days: 222
Cost of living (compared to average): +2.0%

Photo Credit: Mihai_Andritoiu / Shutterstock
12. Dallas-Fort Worth-Arlington, TX
Median AQI: 48
Max AQI: 159
Unhealthy or hazardous days: 24
Moderate Days: 140
Good Days: 202
Cost of living (compared to average): +1,2%

Photo Credit: Kara Jade Quan-Montgomery / Shutterstock
11. San Luis Obispo-Paso Robles-Arroyo Grande, CA
Median AQI: 48
Max AQI: 292
Unhealthy or hazardous days: 31
Moderate Days: 124
Good Days: 211
Cost of living (compared to average): +10.2%

Photo Credit: Terrance Emerson / Shutterstock
10. Stockton-Lodi, CA
Median AQI: 49
Max AQI: 195
Unhealthy or hazardous days: 34
Moderate Days: 140
Good Days: 192
Cost of living (compared to average): +2.2%

Photo Credit: Michael Mercer / Shutterstock
9. Chico, CA
Median AQI: 51
Max AQI: 379
Unhealthy or hazardous days: 39
Moderate Days: 144
Good Days: 183
Cost of living (compared to average): +0.6%

Photo Credit: nektofadeev / Shutterstock
8. Houston-The Woodlands-Sugar Land, TX
Median AQI: 52
Max AQI: 182
Unhealthy or hazardous days: 24
Moderate Days: 169
Good Days: 173
Cost of living (compared to average): +1,7%

Photo Credit: Scott Prokop / Shutterstock
7. Modesto, CA
Median AQI: 55
Max AQI: 189
Unhealthy or hazardous days: 37
Moderate Days: 173
Good Days: 156
Cost of living (compared to average): +1.0%

Photo Credit: marchello74 / Shutterstock
6. Chicago-Naperville-Elgin, IL-IN-WI
Median AQI: 56
Max AQI: 197
Unhealthy or hazardous days: 28
Moderate Days: 217
Good Days: 121
Cost of living (compared to average): +2.8%

Photo Credit: Nicholas Courtney / Shutterstock
5. Denver-Aurora-Lakewood, CO
Median AQI: 58
Max AQI: 161
Unhealthy or hazardous days: 34
Moderate Days: 213
Good Days: 119
Cost of living (compared to average): +4.2%

Photo Credit: Andriy Blokhin / Shutterstock
4. Sacramento--Roseville--Arden-Arcade, CA
Median AQI: 60
Max AQI: 222
Unhealthy or hazardous days: 50
Moderate Days: 184
Good Days: 132
Cost of living (compared to average): +5.2%

Photo Credit: Lucky-photographer / Shutterstock
3. San Diego-Carlsbad, CA
Median AQI: 71
Max AQI: 192
Unhealthy or hazardous days: 49
Moderate Days: 257
Good Days: 60
Cost of living (compared to average): +17.9

Photo Credit: J Dennis / Shutterstock
2. Los Angeles-Long Beach-Anaheim, CA
Median AQI: 84
Max AQI: 235
Unhealthy or hazardous days: 142
Moderate Days: 164
Good Days: 60
Cost of living (compared to average): +18.8%
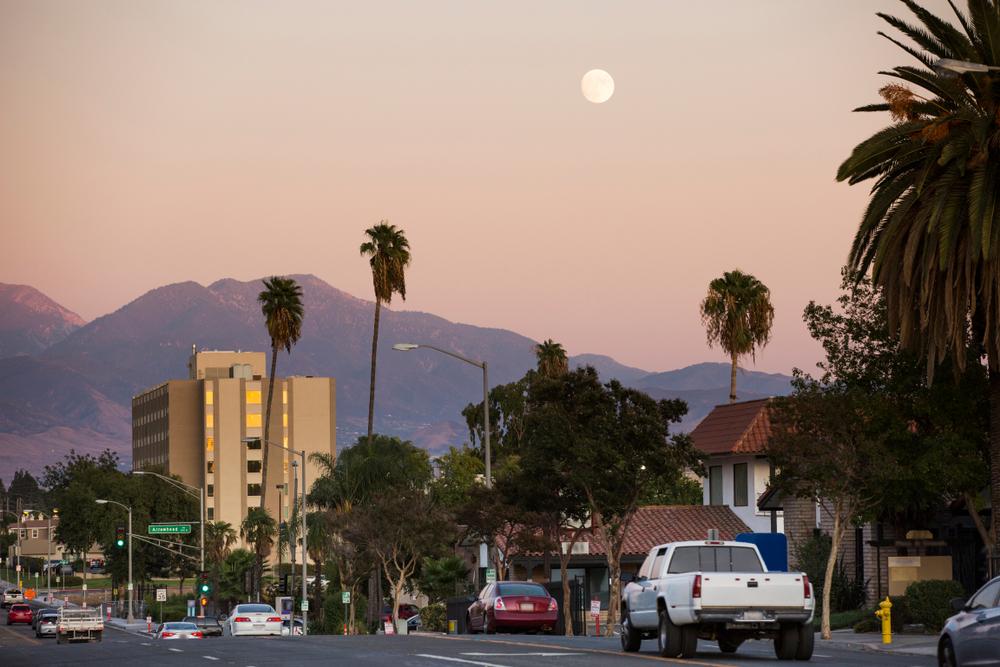
Photo Credit: Matt Gush / Shutterstock
1. Riverside-San Bernardino-Ontario, CA
Median AQI: 98
Max AQI: 576
Unhealthy or hazardous days: 176
Moderate Days: 152
Good Days: 38
Cost of living (compared to average): +7.3%
The data used in this analysis is from the U.S. Environmental Protection Agency Air Quality System database and the U.S. Bureau of Economic Analysis Regional Price Parities dataset. To identify the most expensive locations with the worst air quality, researchers looked at the median daily air quality index (AQI) for each metropolitan area in 2020. The AQI is a broad measure of air pollution that takes into account the concentrations of five major air pollutants regulated by the Clean Air Act. Higher AQI values correspond to higher levels of air pollution. Researchers also included statistics on the maximum AQI observed in 2020 for each location, as well as the total number of unhealthy, moderate, and healthy days. Only locations with a cost of living greater than the national average, as determined by the Bureau of Economic Analysis, were included in the study.