
Chattanooga Real-Time AQI Tracker


Get Alerts For Unhealthy AQI In Your Area
When air quality in your area reaches unhealthy levels, we'll send you a quick alert, along with expert tips on how to reduce your exposure.
What's Actually In Chattanooga Air Today?
What High AQI Means for Your Lungs in Chattanooga
How to Read AQI
The Air Quality Index (AQI) measures how polluted the air is and how it may affect your health.
0–50 (Good): Air quality is satisfactory.
51–100 (Moderate): Acceptable, but some pollutants may pose minor concerns.
101–150 (Unhealthy for Sensitive Groups)
151–200 (Unhealthy)
201–300 (Very Unhealthy)
301+ (Hazardous)
Moderate
Still okay for most, but if you have asthma or allergies, take it easy and avoid long outdoor workouts.
Shop MERV 11 filters→What's the Right Filter for Your AQI Level?
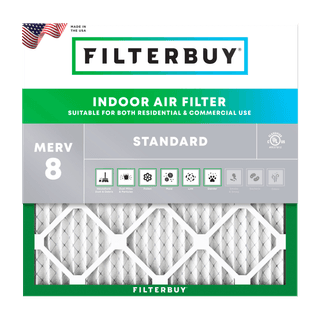
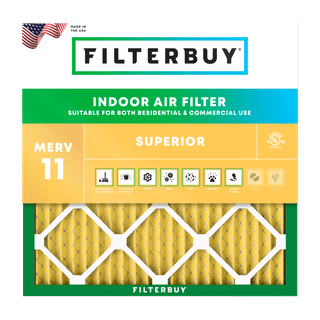
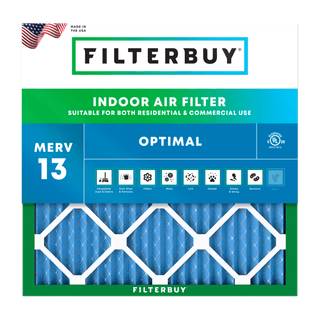


Check Today's Live Real Time Air Quality Index AQI Map in Chattanooga, TN Now
By Michelle Wan, Brand Manager and Air Quality Writer, Filterbuy · Reviewed for technical accuracy by David Clark, Licensed HVAC Technician · Published July 31, 2026 · Updated July 31, 2026
TL;DR
Chattanooga's live air quality index (AQI) is on the map above, updated through the day from EPA-connected monitors in Hamilton County. Most days land in the Good or Moderate range, but the pollutant driving the number changes with the season: ozone in summer, fine particles in winter. Chattanooga's valley traps both, which is why indoor filtration matters as much as the outdoor forecast. This page is maintained by Filterbuy, a U.S. air filter manufacturer.
Where we are coming from. Filterbuy has manufactured pleated air filters in the United States since 2013, from four plants headquartered in Talladega, Alabama. Chattanooga is one of the metros we ship to and track daily. That gives us a narrow but useful vantage point. We do not control Chattanooga's outdoor air, and neither do you. What both of us control is what happens to that air after it crosses your threshold. So this page reports the outdoor number honestly, then spends the rest of its length on the half you can actually change.
Key Takeaways
Chattanooga's daily AQI reflects the highest single pollutant reading of the day, not an average. It is usually ozone in summer and PM2.5 in winter.
Hamilton County earned a C grade for ozone in the American Lung Association's “State of the Air” 2026 report, with the Chattanooga-Cleveland-Dalton metro ranking 110th worst nationally.
Four government monitors cover the county: two for ozone, two for fine particles. One ozone site sits in Soddy Daisy to measure air downwind of the city.
Chattanooga's worst air is early morning in winter and mid-afternoon in summer. The daily pattern flips with the season.
Pollen does not register on the AQI at all, so a green reading can still be a rough allergy morning in Chattanooga.
What Is the Air Quality in Chattanooga Today?
Chattanooga's air quality today is shown live on the AQI map at the top of this page, drawn from EPA-connected monitors in Hamilton County. Since the early 1980s, most days here have fallen in the Good range, according to the Chattanooga-Hamilton County Air Pollution Control Bureau (APCB). Enter your ZIP code to narrow the reading toward your neighborhood, or compare against the Tennessee air quality index map and the national AQI map.
The Chattanooga AQI is not an average of pollutants. In Hamilton County, the daily air quality level is set by whichever pollutant measures highest that day, either ozone or fine particulate matter. A reading of 78 in July almost always means ozone; the same 78 in January almost always means PM2.5. Which pollutant is behind the number tells you whether to skip the afternoon run or change the furnace filter.
What Do the AQI Colors Mean for Chattanooga Residents?
The AQI runs 0 to 500 on the EPA’s six-color scale. Green (0–50) is Good, yellow (51–100) is Moderate, and orange (101–150) is Unhealthy for Sensitive Groups. Red, purple, and maroon mark worse conditions. In Chattanooga, orange days are uncommon but cluster in late summer and during regional smoke events.
Ranges and category names follow the U.S. EPA Air Quality Index.
Why Does Chattanooga's Air Quality Change So Much Through the Year?
Chattanooga's AQI follows a seasonal handoff. Ground-level ozone forms on hot, stagnant days and peaks roughly May through September. Fine particles rise in cooler months, when inversions are strongest and the county's permitted burning season is open. Pollen layers on top without moving the AQI at all.
That last point catches people out. Pollen is a natural aeroallergen, not an EPA criteria pollutant, so a heavy oak-pollen morning in April can arrive alongside a green AQI. The Asthma and Allergy Foundation of America ranked Chattanooga 26th on its 2026 Allergy Capitals list, scoring cities on pollen counts, medicine use, and access to specialists. Usefully, the APCB publishes a daily pollen and mold spore count alongside the AQI, collected each weekday morning and read under a microscope. If your symptoms do not track the map, check that number instead.
The number itself is rarely the interesting part. A 78 in July and a 78 in January look identical on a screen, and they call for completely different decisions. In Chattanooga that gap is almost always ozone versus fine particles, and it decides whether you skip the afternoon run or change the furnace filter.
Michelle Wan, Brand Manager and Air Quality Writer, Filterbuy
The Chattanooga air quality calendar
Open burning is permitted in Hamilton County between October 1 and April 30 with the appropriate permits.
Where Does Chattanooga's AQI Data Actually Come From?
Chattanooga's AQI comes from a four-site government monitoring network run by the APCB, the local agency created in 1969. Two sites measure ozone, two measure PM2.5. Their readings feed EPA's AirNow system, and the state forecast comes from TDEC, which predicts conditions 48 hours out.
Placement is deliberate. One ozone monitor sits just northeast of downtown. The second sits in Soddy Daisy, north of the city, positioned downwind so regulators can separate Chattanooga's own contribution from regional background ozone. The core PM2.5 monitor sits near the University of Tennessee at Chattanooga, with a second in East Ridge. Those are the county's two densest areas.
Here is the part we think gets undersold. Your street is not a monitor. A station two miles away can read Good while a diesel corridor, a neighbor's burn pile, or your own kitchen range puts your actual air somewhere else. Four monitors across a county of roughly 576 square miles produce a regional average, not a reading for your block. Filterbuy treats the map as a directional signal, not a measurement of your living room.
Why Does the Chattanooga Valley Trap Air Pollution?
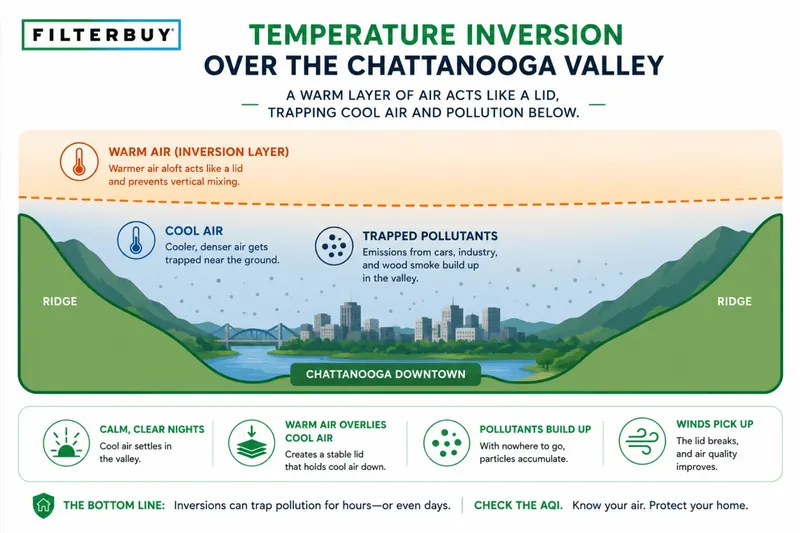
Chattanooga sits in a river valley ringed by ridges, and that shape traps air. During a temperature inversion, cool air settles into the valley while a warmer layer forms above it, capping the basin like a lid and holding pollution near the ground until the weather pattern breaks.
This is why Chattanooga became a national air quality case study. In 1969 the federal Department of Health, Education and Welfare named Chattanooga the worst city in the nation for particulate air pollution, and CBS anchor Walter Cronkite called it the dirtiest city in America that October. Heavy industry, railroads, and coal furnaces supplied the pollution; the valley’s inversions concentrated it. Residents sometimes drove with headlights on at midday.
The response came fast. Within months the city passed an ordinance creating the APCB, and by 1972 local industry was in compliance. Hamilton County spent 2005 through 2014 in federal nonattainment for fine particles and was redesignated to maintenance on November 4, 2015; EPA's Green Book lists no current ozone or PM2.5 nonattainment for the county. The topography, though, has not changed, which is why inversion season still shows up in the numbers.
How Does Chattanooga's Air Quality Compare to the Rest of the Country?
Chattanooga's air is middling: dramatically improved, not clean. The American Lung Association's “State of the Air” 2026 report, built on 2022–2024 monitoring data, gave Hamilton County a C for ozone and ranked the Chattanooga-Cleveland-Dalton metro 110th worst nationally on that measure. Statewide, the Tennessee results place over 427,000 children in areas with unhealthy air.
Source: American Lung Association, "State of the Air" 2026, based on 2022–2024 monitoring data.
What Should You Do When Chattanooga's AQI Is Orange or Higher?
When Chattanooga's AQI passes 100, cut back outdoor exertion, keep windows closed, and run your HVAC fan continuously with a clean MERV 13 filter. Outdoor air infiltrates every house, so filtration decides how much of an orange day outside becomes an orange day inside.
Check the map, then the pollutant. Ozone days and particle days call for different responses. Filters capture particles; they don’t remove ozone, which is a gas.
Close up and circulate. Shut windows and set the thermostat fan to ON rather than AUTO so air cycles through the filter continuously.
Look at the filter you have. Hold it up to a light. If light barely passes through the pleats, it’s loaded and due for replacement.
Match the filter to the season. MERV 11 handles pollen and dander. MERV 13 reaches fine particles and smoke. Our guide to which MERV rating to run at a given AQI walks the thresholds.
Cut indoor sources. Skip candles, aerosols, and unvented gas appliances, and run the range hood when you cook.
MERV ratings follow ASHRAE 52.2. Higher ratings capture smaller particles. Filters do not remove ozone, carbon monoxide, or radon.
Worth being straight about: an HVAC filter improves the air inside your home. It does not lower the outdoor AQI, and it does not remove ozone, carbon monoxide, or radon. It is one layer, and the cheapest and most repeatable one.
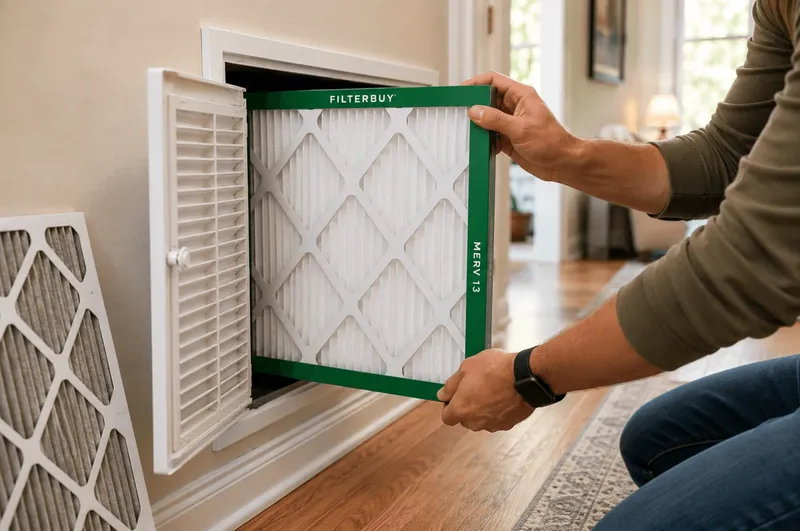
Filterbuy has manufactured pleated filters in the United States since 2013, in 600+ sizes plus custom cuts, shipped factory-direct. Turn on auto-delivery and a clean filter arrives before the next inversion, so you aren't hunting for the right size during a smoke advisory. Shop MERV 8, MERV 11, or MERV 13, or browse every filter size.
When Is Chattanooga's Air Worst During the Day?
It depends on the season, and the answer flips. In winter, Chattanooga's air is usually worst overnight and in the early morning, while the valley inversion holds particles near the ground. In summer, it is usually worst in mid-afternoon, after heat and sunlight have had all day to build ozone. Same city, opposite advice.
This is the practical consequence of the seasonal handoff above, and it is the detail most often gotten backwards. A January runner heading out at 6 a.m. to beat the traffic is running through the most concentrated air of the day. A July runner doing exactly the same thing has picked the best window available. The mechanism is not mysterious. Inversions break up as the sun warms the valley, while ozone needs that same sunlight to form in the first place.
Timing reflects the mechanisms behind each pollutant, not a fixed schedule. A smoke event overrides the daily pattern entirely.
Elevation matters here in a way it does not in flatter cities. An inversion is a lid, and a lid has a height. Homes on the ridges above the valley can sit above it while homes on the valley floor sit beneath it. That is one reason two Chattanooga households can read the same official AQI on a still winter morning and be breathing noticeably different air.
7 Primary Sources for Checking Chattanooga's Air Yourself
Every number on this page traces back to a public source you can read directly. These seven are worth bookmarking, ordered most local to most national. All are government or nonprofit.
1. Get Hamilton County’s Official Reading, Not a Regional Estimate
The APCB publishes today's forecast AQI next to the past 24 hours of actual readings. It also names both the highest and the secondary pollutant, which almost no consumer app does. Raw PM2.5 in µg/m³ and ozone in ppb are listed too, so you can see the measurement behind the index.
Source: Chattanooga-Hamilton County Air Pollution Control Bureau: Daily Air Quality Report
2. See Which Pollutants Chattanooga Measures, and the Limits They Are Held To
This page states the federal thresholds Hamilton County is judged against. PM2.5: 9 µg/m³ annual, 35 µg/m³ over 24 hours. Ozone: 70 ppb over 8 hours. It also confirms that pollen and mold spores sit outside the federal standards entirely, which is why they never move the AQI.
Source: APCB: Air Monitoring Program
3. Cross-check This Map Against the Federal Monitor Feed
AirNow is the EPA's official real-time air quality system and the upstream feed behind most maps, including this one. The Tennessee page shows every federally certified monitor in the state, which is the fastest way to confirm a reading you find surprising.
Source: AirNow: Tennessee Air Quality
4. Know Tomorrow’s Air Before You Plan Around It
Tennessee's Division of Air Pollution Control produces the 48-hour forecast the APCB republishes each day. Look here when the question is about tomorrow rather than right now. It also posts the annual Chattanooga-Hamilton County monitoring network plan, which documents where each local monitor sits and why.
Source: Tennessee Department of Environment and Conservation: Air Monitoring and Forecasting
5. See How Hamilton County Grades Against the Rest of the Country
The American Lung Association grades every monitored U.S. county on ozone and particle pollution across a rolling three-year window, which smooths out the single unusual summer that can distort a one-year comparison. It is the source behind this page's C grade for ozone and the 110th-worst metro ranking.
Source: American Lung Association: State of the Air, Tennessee
6. Confirm Whether Chattanooga Legally Meets Federal Air Standards
A letter grade is a comparison; attainment is a legal status, and the Green Book is the official federal record of it. Hamilton County's entry shows the full history: fine-particle nonattainment from 2005 through 2014, redesignated to maintenance on November 4, 2015, with nothing current.
Source: U.S. EPA Green Book: Tennessee Nonattainment and Maintenance Status
7. Get Certified Pollen Counts When Your Symptoms Beat the AQI
The National Allergy Bureau is the allergist-run network of certified pollen and mold counting stations, and its readings are the most rigorous available to the public. Worth pairing with the APCB count above, because the APCB is not an NAB participating station.
Source: AAAAI: National Allergy Bureau Pollen Counts
3 Statistics Behind the Advice on This Page
Three numbers carry the argument above.
Chattanooga Went from Third Worst in the Nation to Full Compliance in Three Years
Hamilton County's turnaround is documented, not folklore.
1961: Third worst city in the nation for particulate pollution.
1963: Local tuberculosis mortality reaches three times the national average.
Late 1969: Voters approve the Air Pollution Control Ordinance.
October 1972: Every major pollution source in the county is in compliance.
$40 million+: What that three-year cleanup cost.
Source: Chattanooga-Hamilton County Air Pollution Control Bureau: History
Americans Spend About 90% of Their Time Indoors, Where Some Pollutants Run 2 to 5 Times Higher
This is the statistic that decides where your effort pays off.
90%: Share of their time the average American spends indoors.
2 to 5 times higher: Indoor concentrations of some pollutants, against typical outdoor levels.
Highest-risk groups spend even more time inside. Young children, older adults, and people with heart or lung disease.
Source: U.S. EPA, Report on the Environment: Indoor Air Quality
EPA Tells Homeowners Upgrading a Filter to Choose at Least MERV 13
The MERV 13 recommendation on this page is EPA's, not ours. EPA advises at least MERV 13, or as high as your system fan and filter slot allow. Under the ASHRAE test method, a MERV 13 filter must capture:
50% or more of particles 0.30–1.0 micron, the PM2.5 and smoke range.
85% or more of particles 1.0–3.0 microns.
90% or more of particles 3.0–10.0 microns.
Source: U.S. EPA, Indoor Air Quality: What is a MERV rating?
Frequently Asked Questions
Glossary
AQI (Air Quality Index): EPA's 0–500 scale for reporting daily outdoor air quality, divided into six color-coded categories.
PM2.5: Fine particulate matter 2.5 micrometers or smaller, small enough to reach deep into the lungs. Sources include vehicle exhaust, open burning, and wildfire smoke.
Ground-level ozone: A gas formed when sunlight reacts with vehicle and industrial emissions. It drives Chattanooga's summer AQI.
Temperature inversion: A warm air layer sitting above cooler air, trapping pollution near the ground. Common in the Chattanooga valley.
APCB: The Chattanooga-Hamilton County Air Pollution Control Bureau, which has monitored county air quality since 1969.
NAAQS: EPA's National Ambient Air Quality Standards: 9 µg/m³ annual and 35 µg/m³ 24-hour for PM2.5, 70 ppb over 8 hours for ozone.
MERV: Minimum Efficiency Reporting Value, the 1–16 scale rating how well an HVAC filter captures airborne particles.