
Air Quality in Tennessee
Air quality index (AQI⁺) and PM2.5 air pollution in Tennessee •


Get Alerts For Unhealthy AQI In Your Area
When air quality in your area reaches unhealthy levels, we'll send you a quick alert, along with expert tips on how to reduce your exposure.
Live Air Quality Ratings in Tennessee
Live Most Polluted City Ranking
Real-time most polluted cities in Tennessee
Live Cleanest City Ranking
Real-time cleanest cities in Tennessee
The Right Air Filter For High AQI Days
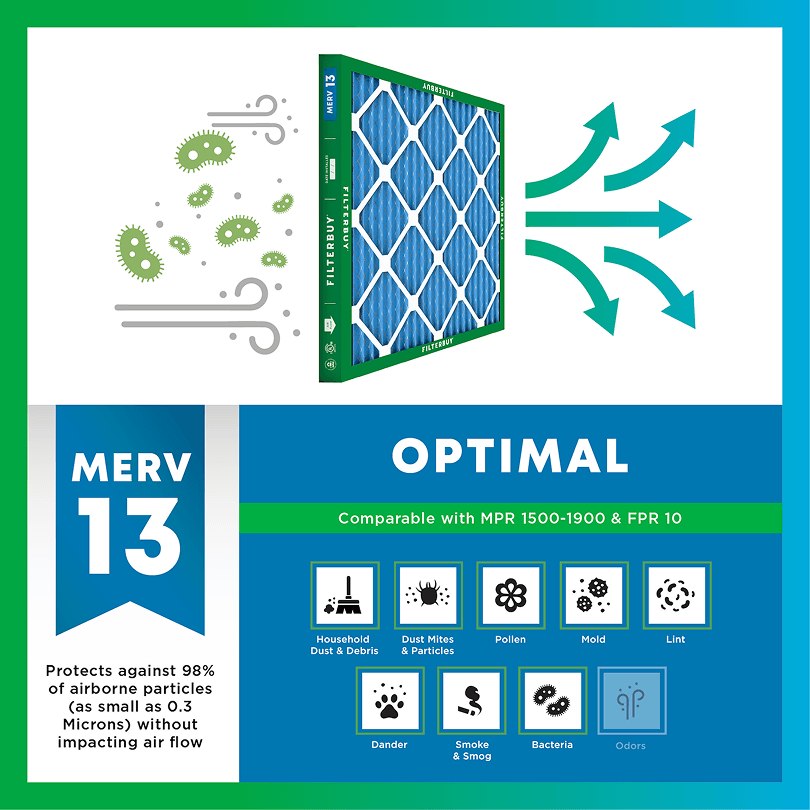
When outdoor air quality drops, the EPA recommends upgrading to a MERV 13 filter — or the highest-rated filter your HVAC system can handle — to help capture more of the fine particulate (PM2.5) that comes with poor air quality. MERV 13 is the highest rating most residential systems can run without restricting airflow.
- Captures PM2.5 and other fine particulates
- Filters ash, soot, and smoke particles
- Rated to capture particles as small as 0.3 microns
- Matches the filter rating the EPA suggests during high-AQI and smoke events

AQI FAQs
What is AQI?
AQI stands for Air Quality Index, the EPA's scale for reporting daily air quality. It runs from 0 to 500. The higher the number, the greater the level of air pollution. Values at or below 100 are generally considered satisfactory; values above 100 mean air quality is unhealthy, first for sensitive groups, then for everyone as numbers climb.
What does AQI measure?
The AQI tracks five major pollutants regulated by the Clean Air Act: ground-level ozone, particle pollution (PM2.5 and PM10), carbon monoxide, sulfur dioxide, and nitrogen dioxide. The reported AQI value reflects whichever pollutant is highest at that time — most often ozone or fine particles (PM2.5).
How is AQI calculated?
Monitoring stations measure pollutant concentrations, and the EPA converts each into a standardized 0–500 score using set breakpoints. Each pollutant gets its own sub-index, and the highest sub-index becomes the reported AQI. That's why a single number can represent different pollutants on different days.
What is a good AQI?
An AQI of 0–50 is rated "Good" — air quality poses little or no risk. 51–100 is "Moderate," acceptable for most people though unusually sensitive individuals may want to limit prolonged outdoor exertion. Anything at or below 100 is generally considered satisfactory air quality.
What does an AQI of 100 (or 150) mean?
100 is the dividing line: at or below it, air quality is satisfactory for the general public. From 101–150, air is "Unhealthy for Sensitive Groups" — people with respiratory conditions, older adults, and children. From 151–200, it's "Unhealthy" and everyone may begin to feel effects.
Why is the AQI bad today?
Short-term AQI spikes usually come from wildfire smoke, temperature inversions that trap pollutants near the ground, high-ozone weather (hot, sunny, stagnant days), or heavy traffic and industrial activity. Check a real-time source like the map on this page to see which pollutant is driving today's reading in your area.
What AQI is bad for running or exercise?
Many runners follow the EPA category lines: below 50, no adjustment needed; 51–100, unusually sensitive people may shorten intense workouts; above 100, sensitive groups are advised to reduce prolonged or heavy outdoor exertion; above 150, that advice extends to everyone. Exercise increases how much air you breathe in, which is why thresholds matter more during workouts.
What AQI is safe to open windows?
A common rule of thumb is to keep windows open when the AQI is under 100 and close them when it climbs above, especially during wildfire smoke events when fine particles are elevated. When windows are closed, running your HVAC system with a fresh filter helps capture particles circulating indoors.
Should I wear a mask based on AQI?
Public health agencies generally suggest considering a well-fitted N95-style respirator outdoors when the AQI exceeds 150, particularly during smoke events. Cloth and surgical masks don't filter fine particles effectively. Follow guidance from your local health department, which may adjust recommendations during severe episodes.
What's Tennessee's Air Today? Live AQI Map Now Statewide | Air Quality Index
You can't see what's drifting through Tennessee's air right now, and that's the whole problem. The live AQI map on this page makes it visible, county by county, hour by hour, color-coded so one quick look tells you whether the next hour outside is safe for the people in your house. We're obsessed with indoor air, and the patterns we see in filters returned to us from Nashville, Memphis, Knoxville, and Chattanooga match what the map below is showing right now.
Read the map first. The sections that follow walk you through what each AQI color band means for sensitive groups, how the air behaves differently across each of Tennessee's four major metros, and what your HVAC system can do indoors when the outdoor number turns against you. Tennessee air isn't simple, and we wrote this page so you can stop guessing and start acting on what you actually find.
TL;DR Quick Answers
What is Tennessee's air quality right now?
Open the live AQI map at the top of this page. It shows real-time readings from every EPA-certified monitor in Tennessee, color-coded from green to maroon. Find the monitor closest to you and read the band.
Which Tennessee city has the worst air quality today?
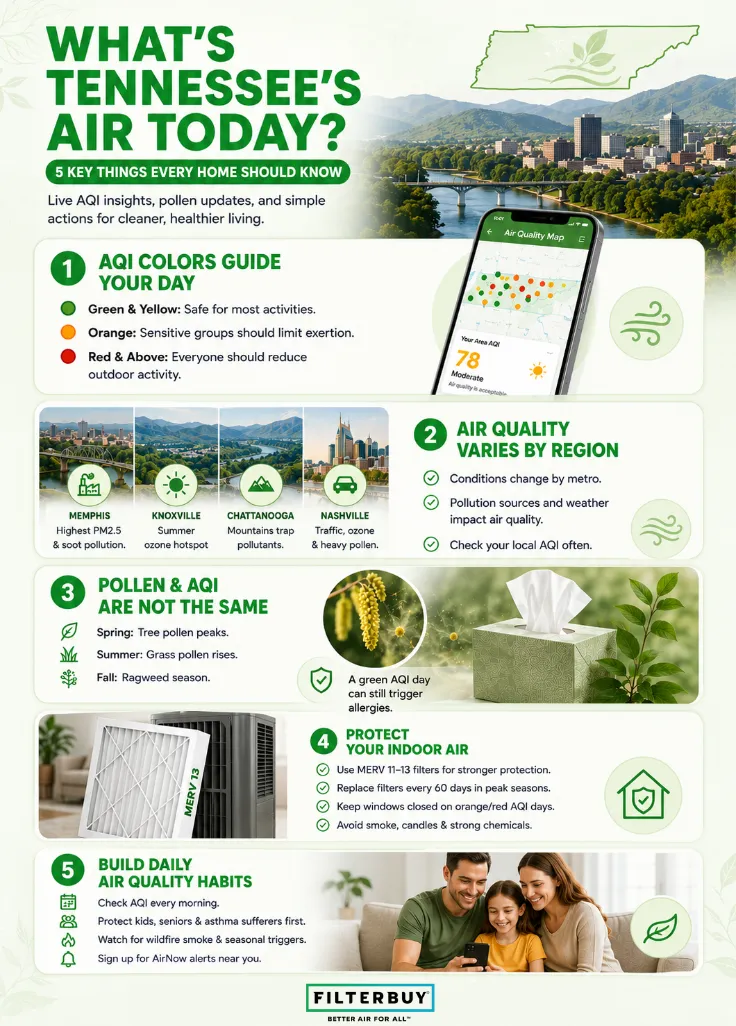
It depends on the season. Memphis typically posts the highest particulate matter readings year-round. Knoxville and Chattanooga lead the state on summer ozone. Nashville sits in the middle on most measures, but it's back to an F grade on ozone smog in the latest annual report. Check the live map for today's actual ranking.
Is it safe to go outside in Tennessee today?
On green and yellow days, yes, for most people. On orange days, sensitive groups should reduce outdoor activity. On red and above, everyone should limit outdoor exertion and let indoor filtration carry the load.
What are the pollen counts in Nashville, Memphis, Knoxville, and Chattanooga today?
Each metro has its own dominant pollen mix. Spring brings oak and grass to Nashville and Memphis, tree pollen, including oak and birch, to Knoxville, and grass to Chattanooga. Late summer shifts the state to ragweed. Check a National Allergy Bureau station near you for the most reliable counted reading.
How does Tennessee's air quality compare to the rest of the USA?
Tennessee is mid-pack nationally. The state has improved on multiple measures over the last two decades, but Nashville's ozone slip and Memphis's persistent particulate matter keep it from the cleanest tier. Open the national map to see how Tennessee compares to the rest of the country right now.
Top Takeaways
Tennessee's air shifts hour by hour, and the lead pollutant changes by metro. Ozone dominates East Tennessee in summer. Particulate matter dominates Memphis year-round.
Nashville-Davidson-Murfreesboro is back to an F grade for ozone smog in the most recent State of the Air report, even as four counties in the metro still hold A grades for daily particulate matter.
Knoxville and Chattanooga are improving across multiple measures, but the ridge-and-valley geography around both metros still traps pollutants on still days.
Pollen counts and AQI readings don't always move together. On bad allergy mornings, the AQI may read green, and on bad ozone afternoons, the pollen count may read low. Track both.
Outdoor AQI directly shapes indoor air quality. What your HVAC system catches comes down to the MERV rating of the filter inside it, and that filter is the most controllable line of defense for any Tennessee household.
Tennessee Air Quality Right Now, Read Through the Live Map
How to Read Today's Tennessee AQI Map at a Glance
The map at the top of this page pulls live data from EPA-certified monitors operating across Tennessee. Each colored dot reports the higher of the two pollutants the federal system watches most closely, which are ground-level ozone and fine particle pollution known as PM2.5. The six color bands move from green (good, AQI 0 through 50) to yellow (moderate, 51 through 100), orange (unhealthy for sensitive groups, 101 through 150), red (unhealthy, 151 through 200), purple (very unhealthy, 201 through 300), and finally maroon (hazardous, 301 and above). If you want the full technical definition, the Wikipedia entry on the Air Quality Index is the cleanest one-page reference we've found.
Read the map the way an air quality forecaster would. Find the monitor closest to your home or your workplace. Note its color. Match that color to the action recommendation below it. A green or yellow reading means most people can plan a normal day outside. Orange is your first warning that older adults, children, pregnant individuals, and anyone with asthma or heart disease should ease back on outdoor exertion. Red and above tells everyone to think twice about strenuous outdoor activity, and at that point, your indoor air becomes the main thing protecting your family.
Nashville Air Quality and Pollen Count Today
Nashville and Davidson County sit at a crossroads of highway traffic, river basin geography, and a fast-growing urban heat footprint. We see air quality Nashville readings climb on still summer afternoons when ozone bakes over the Cumberland River basin. We see them climb again on winter mornings when temperature inversions trap particulate matter close to the ground. The Nashville AQI number you see for Davidson County today reflects whichever pollutant is highest at this hour, and that lead pollutant shifts with the season. Summer pushes ozone forward. Winter and pollen-season mornings tend to push fine particles and pollen to the front instead.
The pollen count Nashville tracks each spring is dominated by oak, maple, and grass through April and May. By late summer, the dominant trigger shifts to ragweed. If you're sensitive to airborne allergens, treat the air quality Nashville today number as one signal and treat the pollen count as a separate signal. They don't always rise together. Some mornings, only one of them is actually causing the trouble.

Memphis Air Quality and Pollen Count Today
Memphis carries Tennessee's heaviest particulate matter burden. Shelby County sits inside an industrial corridor along the Mississippi River, with heavy truck traffic from one of the largest logistics hubs in the country and seasonal agricultural burning in adjacent Arkansas and Mississippi. We see that influence directly in the air quality Memphis readings. PM2.5 is more often the lead pollutant in Memphis than in any other Tennessee metro, which means the Memphis AQI you see today is most likely being driven by fine particles rather than ozone outside of peak summer.
Pollen count in Memphis follows a slightly earlier season than the rest of the state because the western Tennessee climate runs warmer. Cedar tends to appear first in late winter. Oak and grass roll in through April and May. Memphis air quality today often combines moderate particulate matter with a high pollen reading in the same forecast window, and that combination is the one most likely to trigger allergic asthma symptoms in our customers' households.
Knoxville Air Quality and Pollen Count Today
Knoxville and Knox County share a regional airshed with one of the highest ozone national parks in the eastern United States. The ridge-and-valley terrain around Knoxville traps inversions, and ground-level ozone from across the Tennessee Valley settles into the basin on hot, windless days. We see air quality Knoxville readings climb fastest in June, July, and August, when sunlight, heat, and stagnant air work against each other. The Knoxville AQI you see today should be read against that summer pattern, because ozone is almost always the lead pollutant for this metro in warm months.
Pollen count Knoxville tracks the Appalachian foothills calendar. Tree pollen arrives early thanks to elevation variation, with oak and birch leading the spring season, then grass and ragweed taking over by midsummer. If you live anywhere from Sevier County up to Anderson County, expect Knoxville air quality today to behave differently from Nashville or Memphis, because ozone tends to do more of the heavy lifting on the AQI number here than particulate matter does.
Chattanooga Air Quality and Pollen Count Today
Chattanooga and Hamilton County sit in a mountain bowl carved by the Tennessee River. The geography is beautiful. It also functions as a pollution trap. Cool morning air settles into the valley and holds whatever pollutants the previous day produced, and it holds them until the sun warms the bowl enough to clear it. Air quality Chattanooga readings reflect that pattern by running high overnight, falling through the morning, then climbing again with the afternoon heat in summer. The metro has cleaner air than its industrial reputation from the 1970s suggests, but inversions still produce some of the state's most variable hour-to-hour readings.
Pollen count in Chattanooga sits between the Knoxville and Nashville profiles. Grass pollen tends to be the strongest local trigger thanks to the river valley microclimate, with ragweed peaking from late August into October. If you have seasonal allergic asthma, track Chattanooga readings on two separate forecasts. One for ozone, which speaks to the lung-irritation question. Another for pollen, which speaks to the symptom-trigger question. The two readings rarely peak together, and treating them as one number is how most families miss a bad-air morning.
Where Tennessee's Air Fits Into the National Picture
What you see on Tennessee's map today only tells half the story. Air moves across state lines on the prevailing wind, and smoke, ozone precursors, and particulate matter from Kentucky, Georgia, Alabama, Arkansas, and the Carolinas all reach Tennessee regularly. To see how today's Tennessee air quality map fits into the broader national picture, the live air quality index AQI map for the USA gives you the cross-state view on a single screen. We built that national map to answer the question that the state-level view can't reach on its own, which is what's heading toward Tennessee next and from which direction.
Tennessee pollen forecast trends across the state follow the same logic. Spring tree pollen typically starts in Memphis and Chattanooga, then moves north and east through Nashville and into Knoxville over the following days as warmer weather pushes up the map. If you watch a Tennessee air quality map alongside the national one, you'll catch incoming weather and smoke patterns six to twelve hours before they show up at the monitor closest to you. That lead time is what makes the difference between a reactive household and one that's already running its HVAC system on fan mode by the time smoke arrives.
After manufacturing filters for over a decade and serving more than two million households, the patterns in what comes out of Tennessee homes are some of the most distinctive in the country. Filters from Memphis come back loaded with fine soot tied to logistics traffic and agricultural burning. Filters from Knoxville and the Tennessee Valley show heavier ozone-related residue tied to summer haze. Nashville sits in the middle on particulate volume and runs heavier on pollen residue than any of the other metros in spring. We learned a long time ago that what your filter catches is the most honest local air quality report you can get, because it shows you what your HVAC system is actually pulling through your home every hour of the day.
— Filterbuy Team
7 Essential Resources That Sharpen How You Read Tennessee's Air
1. The Federal AirNow Live Map for Tennessee Monitors
AirNow is the EPA's official real-time air quality system, and the Tennessee state page gives you a direct view of every certified monitor in operation across the state. We use this page ourselves whenever we want to cross-check what the live map at the top of this page is reporting.
Source: AirNow.gov Tennessee Air Quality
2. The Tennessee Department of Environment and Conservation
Through its Division of Air Pollution Control, the state's air monitoring network publishes monitoring plans and forecasts that Tennessee residents use to reduce exposure on bad-air days. The page is the most useful state-level reference for the 91 Tennessee counties TDEC directly monitors (Davidson, Hamilton, Knox, and Shelby counties run their own local programs).
Source: Tennessee Air Quality Monitoring and Forecasting
3. Great Smoky Mountains National Park Air Quality Program
The National Park Service operates one of the most extensive air quality monitoring programs in the country at Great Smoky Mountains National Park. The page explains how regional pollutants from outside the park shape East Tennessee air, with live ozone, particle, and visibility data tied directly to the air over Sevier, Blount, and Cocke Counties.
Source: NPS Great Smoky Mountains Air Quality
4. Tennessee's Annual Air Pollution Report Card
The American Lung Association publishes State of the Air each year, grading every U.S. county with an official monitor on ozone and particle pollution across a rolling three-year window. The Tennessee state page lets you see how your county stacks up against the rest of the state and the country.
Source: American Lung Association State of the Air Tennessee
5. State-Level Asthma Prevalence Data From the CDC
If you want to understand why air quality matters at the household level in Tennessee, the CDC's adult asthma surveillance data is the most useful single source. The page shows current asthma prevalence by state, which is a critical context for any family deciding how to respond to a high AQI reading.
Source: CDC BRFSS Adult Current Asthma Prevalence by State
6. The National Weather Service Air Quality Forecast Partnership
NOAA runs an air quality forecasting capability in partnership with the EPA, producing 48-hour predictions of ozone, fine particles, and smoke. The page is the right starting point when you want to know what tomorrow looks like, not just what's happening at this hour.
Source: NOAA NWS Air Quality Forecast Partnership
7. The Pollen Counting Authority That Allergists Actually Trust
The American Academy of Allergy, Asthma and Immunology runs the National Allergy Bureau, a network of certified counting stations that produces the most reliable pollen and mold spore data available to the public. Use it to ground the Nashville, Memphis, Knoxville, and Chattanooga pollen counts you see in commercial weather apps.
Source: AAAAI Pollen Counts and Hay Fever Resource
3 Supporting Statistics That Reveal What Tennessee Air Really Looks Like
More Than 427,000 Tennessee Children Are Breathing Unhealthy Air
According to the American Lung Association's 2026 State of the Air report, over 427,343 Tennessee children live in counties that received a failing grade for at least one measure of air pollution, and the Nashville-Davidson-Murfreesboro metro area worsened to an F grade for ozone smog in the most recent reporting period.
Source: American Lung Association 2026 State of the Air Tennessee Report
Tennessee Currently Has Zero Counties in Nonattainment for Air Pollution
The EPA Green Book is the official federal record of which U.S. counties meet the National Ambient Air Quality Standards. As of its current posting, no Tennessee county is designated nonattainment for ozone or fine particulate matter. The Knoxville and Memphis areas are instead classified as maintenance areas under the 2008 ozone standard, meaning each one violated that standard in the past, returned to compliance, and now sits in the federally required monitoring period that confirms the air stays clean. Source:
Source: EPA Green Book Tennessee Nonattainment and Maintenance Status by County
Tennessee Asthma Rates Run Highest in the State's Smaller Cities and Rural Counties
The CDC's Asthma Surveillance report tracks current asthma prevalence by state and by community type. In Tennessee, adult and all-ages asthma prevalence reached 8.7 percent in small metro areas and 8.3 percent in non-metro counties, compared with 4.5 percent in large metro areas. Asthma is one of the conditions most directly affected by ozone and particle pollution, which is why the AQI category called "unhealthy for sensitive groups" carries real weight for hundreds of thousands of Tennessee residents.
Source: CDC MMWR Asthma Surveillance — United States
Our Honest Take on Tennessee's Air, Across Every Season
Tennessee's air is improving in real ways, and it still demands attention every single day. Nashville's ozone grade slipping back to an F is a setback we don't take lightly. Memphis particulate matter remains the state's most stubborn pattern, and we see it in every batch of filters that ships back from the metro. Knoxville and Chattanooga keep showing progress on year-round particles, which is genuinely good news. None of that changes the basic decision every Tennessee family makes on a hot August afternoon or a smoke-laden spring morning, which is what to do with the next hour outside and how to protect the air inside the house when the outdoor number turns orange or red.
Our position is straightforward. A live air quality map is most useful when it triggers a specific action, not a worried glance. If you treat the AQI number on this page as a daily signal rather than a curiosity, you'll make better choices for the sensitive people in your home, and you'll give your HVAC system a fighting chance at filtering what slips indoors. The technology to read your air is finally in the hands of the families making the decisions. The only real question now is whether you use it.
What to Do Before You Step Outside Tennessee Today
Build the five moves below into a daily rhythm. They work across every Tennessee metro, every season, and for every age group in your household.
Check the live AQI map on this page first thing in the morning, and again before any outdoor activity that runs longer than 30 minutes. Make it as automatic as checking the weather.
Set a personal AQI threshold for the sensitive people in your house. For most households with kids, older adults, or anyone managing asthma, AQI 100 is the line where outdoor activity gets reduced or moved earlier in the day.
On orange or red days, close your windows, run your HVAC system on the fan setting so air keeps cycling through the filter, and avoid anything that adds indoor pollutants. That means no candles, no gas stoves running without ventilation, and no attic work that stirs up dust.
Audit the filter currently installed in your HVAC system. If it's been in place for more than 60 days during pollen or wildfire season, it's time to replace it. If you don't know the MERV rating, find out, because in Tennessee, a MERV 11 or higher catches a meaningfully different amount of particulate matter than a basic MERV 8.
Sign up for AirNow alerts for the official monitor closest to your home. The text and email alerts catch overnight changes you'd otherwise miss until your symptoms tell you about them in the morning.
Frequently Asked Questions
Protect What You Breathe Indoors When Tennessee's Outdoor Air Won't Cooperate
Once you've read the map and seen what Tennessee's air is doing today, the next move happens inside your home. The filter in your HVAC system decides what gets through. Browse air filter sizes by your HVAC unit dimensions, choose a MERV rating that fits Tennessee's seasonal pollutant mix, or talk with our team about a whole-home approach to indoor air quality. We've built filters for families across all four Tennessee metros for years, and we know what works in this climate.