
Louisville Real-Time AQI Tracker


Get Alerts For Unhealthy AQI In Your Area
When air quality in your area reaches unhealthy levels, we'll send you a quick alert, along with expert tips on how to reduce your exposure.
What's Actually In Louisville Air Today?
What High AQI Means for Your Lungs in Louisville
How to Read AQI
The Air Quality Index (AQI) measures how polluted the air is and how it may affect your health.
0–50 (Good): Air quality is satisfactory.
51–100 (Moderate): Acceptable, but some pollutants may pose minor concerns.
101–150 (Unhealthy for Sensitive Groups)
151–200 (Unhealthy)
201–300 (Very Unhealthy)
301+ (Hazardous)
Moderate
Still okay for most, but if you have asthma or allergies, take it easy and avoid long outdoor workouts.
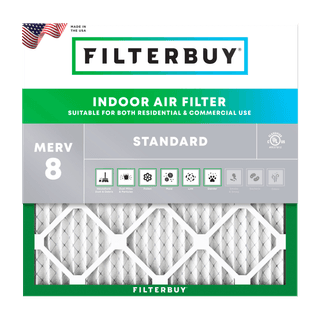
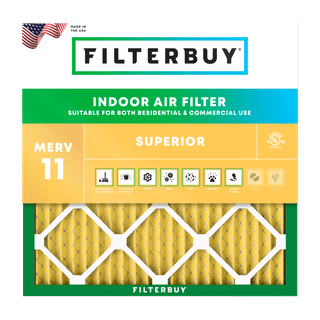
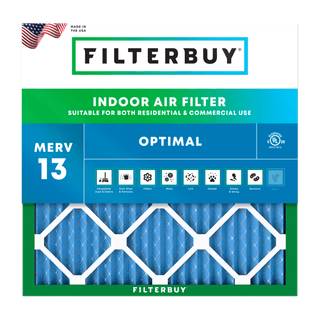
Shop MERV 11 filters→What's the Right Filter for Your AQI Level?

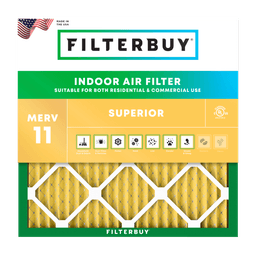
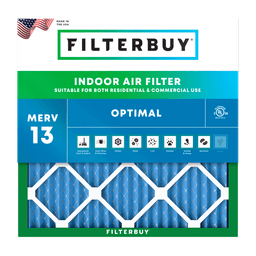


Check Today's Live Real Time Air Quality Index AQI Map in Louisville, KY Now
On a Code Orange day in Louisville, soccer practice gets pulled inside, the morning run shifts to the treadmill, asthma inhalers come back out of the kitchen drawer, and the school nurse fields more notes from parents than usual. The live AQI map at the top of this page tells Jefferson County families when that day has arrived. Louisville Metro Air Pollution Control District updates the official reading four times every weekday and color-codes the air Orange, Red, Purple, or Maroon whenever the number slips out of the healthy range. The map pulls real-time data from the EPA's AirNow feed and the APCD monitoring network. If the tile is green or yellow, your morning runs the way you planned it. If it is anything else, the rest of this page is the answer.
TL;DR Quick Answers on Louisville AQI Today
The live map at the top of this page shows today's Louisville AQI in the same color-coded scale every U.S. city uses, refreshed against the EPA's AirNow feed and the Louisville Metro APCD monitoring network.
Louisville Metro APCD posts an official AQI four times per weekday and runs Code Orange or Code Red alerts whenever the reading hits Unhealthy for Sensitive Groups or worse.
Today's biggest drivers are usually summer ground-level ozone, year-round fine particle pollution, spring and fall pollen, and Canadian wildfire smoke when the wind direction lines up.
On a Code Orange or Code Red day, close the house, switch the HVAC fan from Auto to On, and run at least a MERV 13 filter if the equipment can hold normal airflow.
Sign up for free EnviroFlash text or email alerts so APCD's next-day forecast lands in your inbox the night before, not the morning of.
Top Takeaways
Louisville Metro Air Pollution Control District posts an official AQI four times per weekday and calls Code Orange, Code Red, Code Purple, or Code Maroon alerts based on whichever pollutant is highest at that reading.
The city's biggest AQI drivers are summer ground-level ozone, fine particle pollution from traffic and industry, spring and fall pollen, and Canadian wildfire smoke that drifts down the Ohio Valley most years.
Code Orange asks sensitive groups (kids, older adults, those with asthma, COPD, heart and lung disease, and pregnancy) to cut back on outdoor exertion. Code Red extends the warning to everyone in Jefferson County.
On a bad-air day, the fastest indoor response is closing the house, switching the HVAC fan to continuous run, and dropping in a MERV 13 if your equipment can hold normal airflow at that rating.
Louisville has historically ranked in the worst U.S. metros for ozone and continues to fail the year-round particle pollution standard, which means baseline air quality is already strained before a wildfire or ozone event piles on.
What Today's Louisville AQI Number Is Actually Telling You
The map at the top of this page refreshes against the EPA AirNow feed and the Louisville Metro APCD monitoring stations. APCD posts an updated AQI four times per weekday and assigns the color tile based on whichever pollutant is highest at that hour. The agency calls it the Top Pollutant. In Louisville, the Top Pollutant is almost always ground-level ozone in summer, fine particle pollution in winter, and a mix of both during wildfire smoke stretches. Reading the map takes about a minute once you know what the colors and the numbers are pointing at.
How to Read the Louisville Live AQI Map Today
The air quality index runs from 0 to 500 on the color scale; every U.S. city uses the same scale. Green (0 to 50) is Good. Yellow (51 to 100) is Moderate. Orange (101 to 150) is Unhealthy for Sensitive Groups, which APCD calls Code Orange. Red (151 to 200) is Unhealthy for everyone and triggers Code Red. Purple (201 to 300) is Very Unhealthy, and Maroon (301 to 500) is Hazardous. Louisville has not crossed into Purple or Maroon in a typical year. The June 2023 Canadian smoke event pushed downtown AQI above 180 and came close. When you check the map, look at the color tile first, then the number, then the Top Pollutant label that tells you whether ozone, PM2.5, or something else is doing the damage today.
Louisville's Five Tracked Pollutants and Why They Spike
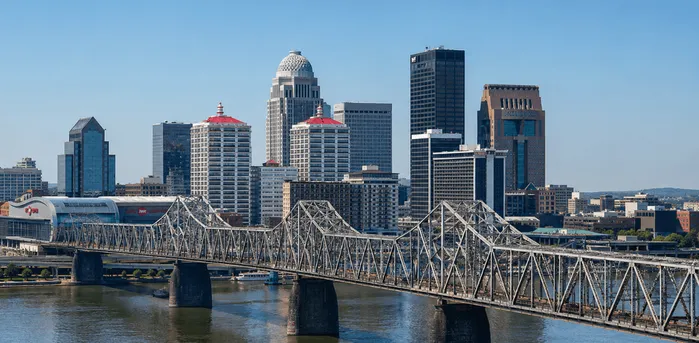
APCD measures five criteria pollutants under the Clean Air Act, plus a separate air toxics network on top of those. Ground-level ozone forms when nitrogen oxides from tailpipes and industrial sources cook in sunlight, which is why Louisville's worst ozone days land on hot, calm summer afternoons. Fine particle pollution (PM2.5) comes from combustion. Diesel trucks moving freight along I-64 and I-65, the Rubbertown industrial corridor in west Louisville, residential wood smoke in winter, and wildfire smoke when the wind direction lines up all feed it. PM10 covers larger inhalable dust from construction, road wear, and pollen-heavy spring days. Sulfur dioxide and nitrogen dioxide both still register on the APCD network, though Clean Air Act enforcement has pulled both well below historical Louisville highs. Each pollutant carries its own health profile, but the AQI map shows only the worst one for that hour. A Code Orange day in August almost always means ozone. The Code Red stretch in late June 2023 meant smoke.
Code Orange, Code Red, and Sensitive Groups in Jefferson County
APCD names the sensitive groups directly: children, older adults, people managing asthma, COPD, congestive heart failure, or pregnancy, and anyone exerting themselves outdoors for a long stretch. Code Orange asks those groups to cut back on hard outdoor work or exercise. Code Red extends the warning to everyone in Louisville. APCD typically calls the next day's category the evening before, which is why so many Jefferson County families and athletes already watch the EnviroFlash alert feed. Schools in Jefferson County Public Schools and several private school networks use AQI thresholds to decide whether outdoor recess and athletics get pulled inside. That makes the night-before forecast the single most actionable data point in the system.
What to Do Indoors When Louisville Air Quality Worsens
The indoor response is the same whether the day is a Code Orange ozone stretch, a smoky afternoon driven by Canadian fires (covered in detail on our Louisville wildfire smoke map), or a winter PM2.5 inversion. Close windows and doors. Flip the thermostat fan from Auto to On so the filter scrubs air continuously, not only during cooling and heating cycles. Pull the filter out of the return and check it. If it is rated MERV 8 and the AQI is climbing past 100, swap in a MERV 13 if your equipment can hold normal airflow at that rating. Pick one room as your cleaner room (a main-floor bedroom or the living room usually works well), shut the door, and run a portable HEPA unit sized to the square footage. Anyone in the household with an asthma plan, a heart or lung condition, or a pregnancy should walk through their care steps the night before, not the morning of.
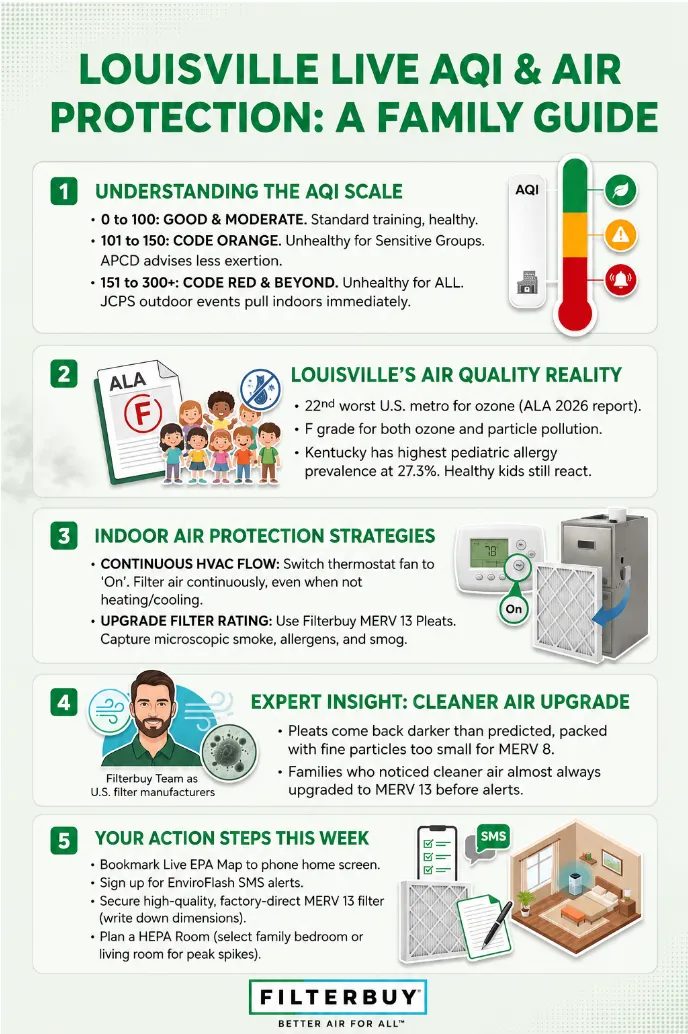
After manufacturing filters for over a decade and serving more than two million households, the pattern we see in Louisville filter returns during a Code Orange or Code Red stretch matches every other Ohio Valley market we ship into. The pleats come back darker than the calendar replacement date predicts, packed with fine particles too small for a basic MERV 8 to catch in one pass. The Jefferson County families who tell us their indoor air felt noticeably cleaner during the 2023 Canadian smoke event are almost always the ones who already moved to a MERV 13 and switched the HVAC fan to continuous run before the worst day hit. The filter sitting in your system right now is doing the work whether you can see it or not. Check it before the next Code Orange, not after.
— Filterbuy Team
7 Essential Resources for Tracking Louisville Air Quality and Acting on It
These are the federal, state, and city resources we keep open on our own monitors during a Louisville bad-air stretch.
See the EPA's Live AQI Reading for Louisville Right Now
The EPA's AirNow page for Louisville pulls real-time AQI from every active monitor inside the metro and shows the current category, the dominant pollutant, and a short-term forecast. APCD and the National Weather Service work from the same feed when they call a Code Orange or Code Red.
Source: AirNow Louisville page.
Check Today's Official Louisville Metro AQI Forecast
Louisville Metro APCD's current-air-quality page covers the four-times-daily AQI reading, the next-day forecast, and the alert color the agency expects to call the night before. This page is the single source that the city's own monitoring board uses.
Source: Louisville Metro APCD Check Current Air Quality page.
Read the National Weather Service AQI Forecast for Louisville
The NWS office in Louisville maintains an AQI page that pulls from the KAIRE Network and explains how Ohio Valley weather patterns, calm winds, high-pressure ridges, and summer heat domes lock pollutants in place over Jefferson County for days at a time.
Source: National Weather Service Louisville Air Quality Index page.
Track Statewide Kentucky Air Quality Programs and Enforcement
The Kentucky Division for Air Quality runs the state ambient monitoring network beyond the Louisville Metro APCD boundary and manages permits, attainment status, and air toxics oversight across all 120 Kentucky counties.
Source: Kentucky Division for Air Quality.
Sign Up for Free Louisville AQI Text and Email Alerts
EnviroFlash is the EPA's free alert subscription service. Enter a Louisville zip code, pick email or SMS, and the network sends the next-day forecast and any active Code Orange, Code Red, Code Purple, or Code Maroon alert straight to your phone.
Source: EnviroFlash alert sign-up.
Understand the Health Risk of PM2.5 Particle Pollution
The EPA's plain-language explainer on particulate matter covers what PM2.5 actually is (particles 2.5 micrometers and smaller), why a single human hair is roughly thirty times bigger, and why fine particles do the most damage when they reach the deepest part of the lungs.
Source: EPA Particulate Matter Basics.
Build a Family Air Quality and Wildfire Action Plan
Ready.gov's wildfire preparedness page walks households through evacuation planning, smoke-ready toolkit steps, and what to keep on hand for a Louisville Code Red day. The plan is short enough to print and live on the refrigerator.
Source: Ready.gov wildfire preparedness guide.
3 Supporting Statistics That Explain Louisville's Air Quality Reality
Three findings come up every time Louisville customers ask whether the city's air problem is structural or seasonal noise. Each one below sits in a public report from a different national health or research authority. Together, they explain why a Code Orange day in Jefferson County is not the same as a Code Orange day somewhere with a cleaner baseline.
The American Lung Association's 2026 State of the Air report ranks the Louisville-Jefferson County-Elizabethtown metropolitan area 22nd worst in the nation for ozone pollution, a slide from 29th worst the year before. Jefferson County earned an F grade for ozone and an F grade for year-round particle pollution, with the county averaging more than 10 unhealthy ozone days per year between 2022 and 2024, its highest mark in a decade. Source: American Lung Association State of the Air Kentucky report card.
The Asthma and Allergy Foundation of America's 2026 Allergy Capitals report ranks Louisville at number 52 out of the 100 largest U.S. metropolitan areas for pollen-related allergy difficulty, which puts the city in the “average” tier. AAFA factors grass pollen, weed pollen, over-the-counter allergy medication use, and access to board-certified allergy specialists into the score. Source: AAFA 2026 Allergy Capitals Report.
Kentucky reports the highest prevalence of allergy among children without current asthma of any U.S. state at 27.3 percent, based on CDC analysis of National Survey of Children's Health data. That means a meaningful share of Louisville-area kids react to indoor and outdoor allergens even without an asthma diagnosis on the chart. Source: CDC AsthmaStats on Allergy Prevalence in Children.
Final Thoughts and Our Opinion on Louisville's Air Quality Outlook
Louisville's AQI problem is not a one-off summer ozone story or a one-off Canadian smoke story. It is both at once, layered on top of a baseline that already grades poorly for year-round particle pollution. The Ohio Valley topography is not changing. Canadian boreal fire seasons keep getting longer. Spring tree pollen and fall ragweed both arrive on schedule in Jefferson County, and indoor allergen prevalence among Kentucky children sits at the top of the national chart. Our take is that every Louisville household should run at least a MERV 11 filter year-round and keep a MERV 13 in the right size on the shelf for the next Code Orange or Code Red day. The MERV 8 default that ships with most HVAC systems was built to protect equipment, not people. Louisville's air asks more of the filter than that.
Next Steps for Louisville Households to Take This Week
Bookmark the live AQI map at the top of this page on your phone's home screen so today's reading is one tap away.
Sign up for free EnviroFlash text or email alerts so APCD's next-day forecast lands in your inbox the night before, not the morning of.
Pull your current HVAC filter, write the size and the date on a label, and order one MERV 13 backup in the same dimensions to live on the shelf.
Pick one room (a main-floor bedroom or the living room usually works) as your cleaner room for Code Orange and Code Red days, and decide now where a portable HEPA unit would sit.
If anyone in the household has asthma, COPD, a cardiac condition, or is pregnant, walk the family's care plan through the next time the AQI reads Good so it is rehearsed before the next bad-air day.
Frequently Asked Questions About Louisville Air Quality
Order Your Louisville-Ready MERV 13 Filter Direct From the Factory
The single most useful purchase a Jefferson County household can make before the next Code Orange or Code Red day is the right-sized MERV 13 filter sitting in the right slot, with one backup on the shelf. Filterbuy manufactures every filter in our own American factories in over 600 standard sizes (and custom sizes when a system needs one), ships direct, and lets you pick the MERV rating your equipment can actually hold. Pull the filter currently in your return, write down the size, and order today so the next bad-air day catches your system ready instead of running a packed MERV 8 against fine particles it was never built to catch. Shop Filterbuy MERV 13 air filters in your exact size.