
Huntsville Real-Time AQI Tracker


Get Alerts For Unhealthy AQI In Your Area
When air quality in your area reaches unhealthy levels, we'll send you a quick alert, along with expert tips on how to reduce your exposure.
What's Actually In Huntsville Air Today?
What High AQI Means for Your Lungs in Huntsville
How to Read AQI
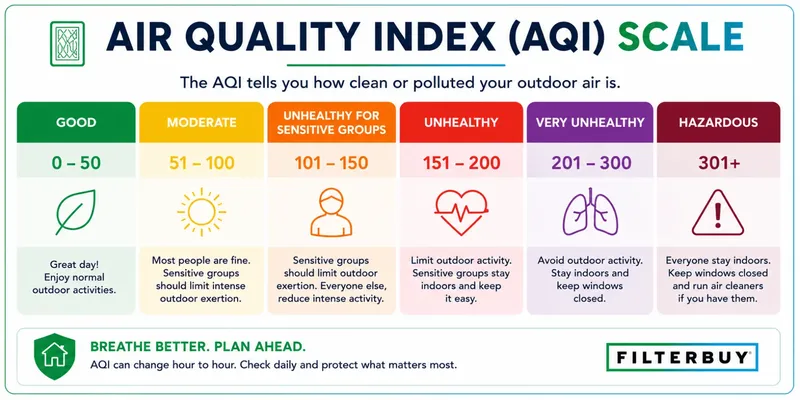
The Air Quality Index (AQI) measures how polluted the air is and how it may affect your health.
0–50 (Good): Air quality is satisfactory.
51–100 (Moderate): Acceptable, but some pollutants may pose minor concerns.
101–150 (Unhealthy for Sensitive Groups)
151–200 (Unhealthy)
201–300 (Very Unhealthy)
301+ (Hazardous)
Moderate
Still okay for most, but if you have asthma or allergies, take it easy and avoid long outdoor workouts.
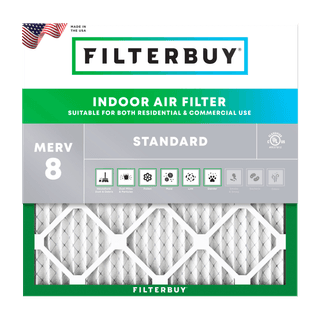
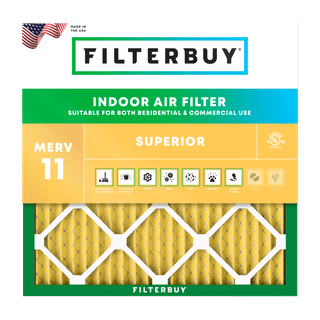
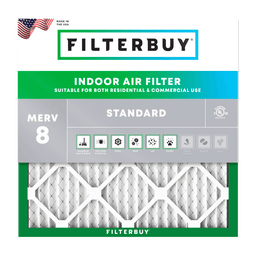
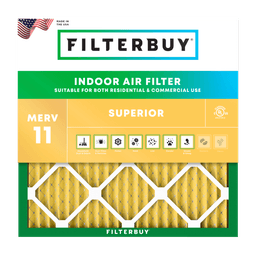
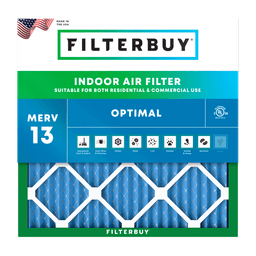
Shop MERV 11 filters→What's the Right Filter for Your AQI Level?


Check Today's Live Real Time Air Quality Index AQI Map in Huntsville, AL Now
Author: Michelle Wan · Reviewer: David Clark, Licensed HVAC Technician · Publish Date: July 21, 2026 · Updated Date: July 21, 2026
TL;DR: The live map on this page shows Huntsville's real-time Air Quality Index (AQI) right now, pulled from EPA and state monitors across Madison County. Huntsville's air is usually Good to Moderate, with ground-level ozone in summer and fine particles (PM2.5) being the two things most likely to nudge the number up. Check the color today, and if you're sensitive, plan your outdoor time and your indoor filter around it.
Want the number right now? Find Huntsville on Filterbuy's live AQI map below. The color and value update throughout the day, so it always reflects current conditions, not yesterday's.
Key Takeaways
Huntsville's AQI is live on the map above and refreshes through the day using data from the EPA's AirNow network and Alabama Department of Environmental Management (ADEM) monitors.
"Good" (green) and "Moderate" (yellow) are Huntsville's most common readings. Higher numbers usually show up on hot, sunny summer afternoons (ozone) or when wildfire smoke drifts into the region (PM2.5).
Pollen is not part of the AQI. North Alabama's tree, grass, and weed pollen can make you miserable on a "Good" air day. That is a real distinction for allergy and asthma families here.
AQI 101 to 150 is "Unhealthy for Sensitive Groups." Kids, older adults, and people with asthma or heart conditions should ease up on hard outdoor activity at that level.
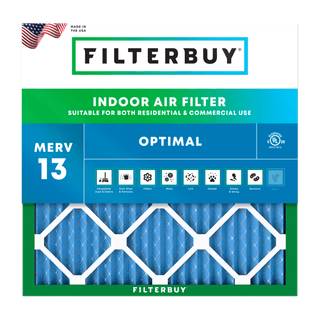
Your HVAC filter is your indoor line of defense. A Filterbuy MERV 13 filter captures fine particles like smoke and dust that ride in on bad-air days.
What Is the Air Quality in Huntsville Today?
The fastest answer is the color on the map above. Huntsville, the county seat of Madison County and now Alabama's largest city, generally enjoys Good to Moderate air quality, thanks to its Tennessee Valley setting and relatively light heavy industry. On a typical day the AQI sits comfortably in the green or low-yellow range.
But "today" is the operative word. Air quality changes hour to hour with weather, traffic, and whatever is blowing in from elsewhere. The live map reads current monitor data so you don't have to guess, and Huntsville's conditions are part of a national picture you can see on our USA live AQI map. If someone in your home has asthma, allergies, or a heart condition, the map plus the guidance below tells you what to actually do with the number.
Here's our angle, and it's one most air-quality sites can't offer: we're an Alabama company. Filterbuy has built air filters in Talladega, about a two-hour drive south of Huntsville, since 2013, and we've shipped millions of them to homes across the state. North Alabama's air isn't an abstraction to us; it's the air our own neighbors and customers breathe, which is why this page pairs the live reading with what we've actually learned about protecting a home here.
How to Read the Huntsville AQI
The Air Quality Index is a 0–500 scale that turns raw pollution readings into a single color and number. It's built from the pollutants the EPA tracks: [ground-level ozone](https://www.epa.gov/ground-level-ozone-pollution/ground-level-ozone-basics), [fine particles (PM2.5)](https://www.epa.gov/pm-pollution/particulate-matter-pm-basics), coarse particles (PM10), carbon monoxide, sulfur dioxide, and nitrogen dioxide. The index reports whichever is worst at that moment, and lower is better. For the official color categories, see the EPA's AQI Basics on AirNow.
Live readings on this page come from the EPA AirNow network and Alabama Department of Environmental Management (ADEM) monitors.
Want the full breakdown of what's behind a reading? See Filterbuy's guide to why air quality goes bad and how to read the AQI.
What Drives Huntsville's Air Quality
As Filterbuy's air-quality writer, I pull AQI readings for cities like Huntsville most mornings, and I've learned the number itself is rarely the point. What matters is which pollutant is behind it. A 130 driven by ozone is usually a rough afternoon; a 130 driven by wildfire smoke can be a rough week. Three local factors explain almost every reading on Huntsville's map, and each one calls for a different response.
Ground-level ozone (the summer story). Ozone isn't emitted directly. It forms when sunlight cooks vehicle and industrial emissions on hot, still days, which is why the EPA calls it the main ingredient in smog. Huntsville's fast growth keeps adding cars and construction to that mix, feeding the precursors ozone forms from. That makes late spring through summer afternoons Huntsville's most likely window for yellow or orange air. The American Lung Association grades Madison County on ozone and particle pollution every year, and you can check the current marks on its State of the Air report card for Madison County.
Fine particles, PM2.5 (the smoke story). PM2.5 is soot and combustion particles small enough to reach deep into your lungs. Locally it comes from traffic and the occasional regional event. In recent years, wildfire smoke drifting hundreds of miles from Canada and the western U.S. has pushed Southeastern AQI numbers into the red on otherwise clear days. When that happens, PM2.5 is what the map is reacting to. See Filterbuy's explainer on how far wildfire smoke can travel.
Pollen (the asterisk). Here's what most air-quality pages get wrong: pollen is not measured by the AQI. North Alabama's tree, grass, and weed pollen can be brutal in spring and fall, and you can feel awful on a day the map says "Good." If your symptoms don't match the number, the culprit is usually pollen, not the AQI pollutants. The Asthma and Allergy Foundation of America tracks this in its Allergy Capitals report. It's a real distinction for the many allergy and asthma households in the Tennessee Valley, and it's why filtration matters even on green-air days.
Is Today's Number Ozone or Smoke? How to Tell in Huntsville
The AQI gives you one number, but the smartest response depends on which pollutant is behind it, and in Huntsville that's almost always ground-level ozone or fine-particle smoke. You can usually tell which without any equipment. (On the AirNow map, clicking your nearest monitor shows which pollutant is running highest.)
It's probably ozone if:
It's a hot, sunny, still afternoon. Ozone peaks from about midday through early evening.
The morning read clean, but the number climbed as the day heated up.
The sky is clear or lightly hazy, and there's no smell of smoke.
It's spring or summer, Huntsville's ozone season.
What to do: Shift hard outdoor activity like kids' practices, runs, and yard work to the morning, when ozone is lowest, and ease off during the late-afternoon peak. Levels fall after sunset.
It's probably wildfire smoke (PM2.5) if:
The sky looks milky or the sun turns orange, and you can smell smoke.
The number is high in the morning too, not just the afternoon.
There's fire news from Canada or the western U.S. and the wind is pointed your way.
Your eyes and throat feel it indoors as well as out.
What to do: Close the windows, switch your HVAC to fan or recirculate with a MERV 13 filter, and add a portable HEPA unit where your family sleeps. Smoke can settle in for days, so keep filtering even after the sky clears.
Air Quality in Huntsville, Season by Season
The type of challenge shifts with the calendar here. What to expect and plan for:
Who Should Watch the Huntsville AQI Closely
Most healthy adults won't feel Moderate air. But the AQI matters more if you or someone in your home is in a sensitive group: children, adults over 65, pregnant people, and anyone with asthma, COPD, or heart disease. For those groups, an orange (101–150) day is the cue to move workouts indoors, keep windows closed, and lean on filtration. When the map turns red, that guidance extends to everyone. AirNow's Your Health guide breaks down what each level means and lets you sign up for local alerts.
What You Can Actually Do About It, Indoors
After more than a decade of building filters and shipping them into Alabama homes, the question we hear most from the Tennessee Valley isn't about smoke. It's "why do my allergies flare on a day the app says the air is Good?" That's the pollen gap, and it's the clearest example of why the outdoor number is only half the story. You can't control Huntsville's ozone or its pollen, but you spend most of your day indoors, and that's where you have real control.
When the AQI climbs, or when pollen is high regardless of the AQI, the most effective move is a quality HVAC filter with your system circulating. A MERV 13 filter traps 98% of airborne particles as small as 0.3 microns. Those are the fine particles that define bad-air days, including wildfire smoke and PM2.5, plus the pollen and dust that trigger allergies. It's the sweet spot for most homes: strong filtration without over-restricting airflow the way a true HEPA filter can in residential systems. If pets and everyday allergens are your main concern, a MERV 11 is a solid step up, and an Odor Eliminator carbon filter adds smoke and VOC odor control. Not sure what your system can handle? Start with our guide to MERV ratings and what they filter.
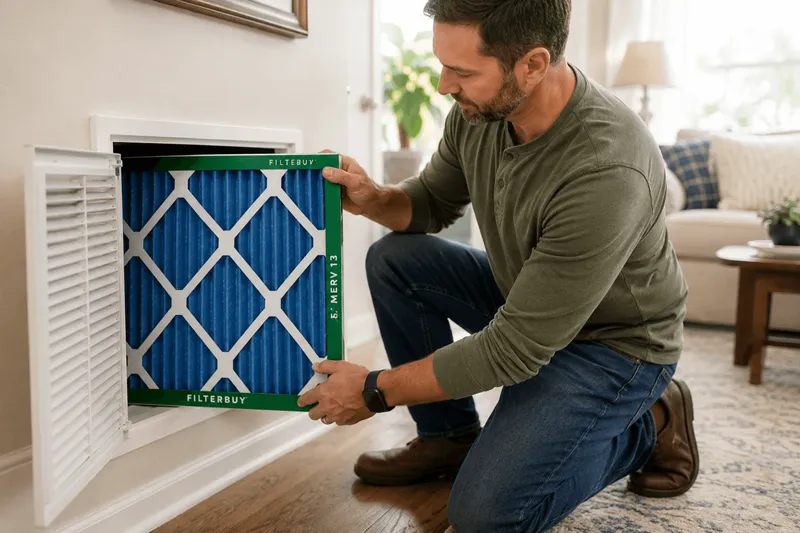
At Filterbuy, we build filters in the USA in 600+ standard sizes plus custom cuts, ship them factory-direct and free, and offer auto-delivery so you're never caught with a clogged filter on a red-air day. Find your MERV 13 filter size →
Checking Huntsville’s AQI takes five seconds, and it tells you what’s happening outside. But after years of pulling these readings, and seeing which filters come back the dirtiest, I’m convinced the number that actually protects your family is the MERV rating in your HVAC system. The map tells you when to act. The filter is the action.
Michelle Wan, Brand Manager & Air Quality Writer, Filterbuy
7 Authoritative Resources for Staying Ahead of Huntsville's Air Quality
Filterbuy backs every recommendation on this page with guidance from federal and state authorities. Bookmark these seven sources to check conditions, understand the pollutants, and protect your home.
1. Decode Any AQI Number in Seconds
AirNow's AQI Basics, the EPA's official reference, explains every color category and what the number means for your health. It's the fastest way to turn today's reading into a decision about outdoor plans.
2. Understand Huntsville's Top Summer Pollutant
EPA Ground-level Ozone Basics explains how ozone forms on hot, sunny days and why it's the main ingredient in smog. Essential background for the yellow-and-orange afternoons Huntsville sees from late spring through summer.
3. Learn What Wildfire Smoke Puts in Your Lungs
EPA Particulate Matter Basics breaks down what PM2.5 is, where it comes from, and why particles this small are so harmful. Read it before the next smoke event drifts into North Alabama.
4. Find Out Why Your Indoor Air Can Be Worse Than Outside
The EPA's Inside Story guide explains why indoor air is often more polluted than outdoor air and how ventilation and filtration fix it. It's the clearest case for taking your HVAC filter seriously.
5. See the State Monitors Behind Your Local Reading
ADEM's Air Quality Information hub shows the Alabama ozone and PM2.5 monitoring network that feeds the readings on the map above. Go here to confirm exactly where your local data comes from.
6. Check How Madison County's Air Grades Out Each Year
The American Lung Association's State of the Air report card for Madison County assigns annual grades for ozone and particle pollution. It's the clearest year-over-year scorecard for Huntsville-area air.
7. Track the Pollen the AQI Ignores
The AAFA Allergy Capitals report ranks U.S. metros on pollen and allergy burden, the piece the AQI leaves out. Useful for planning around Huntsville's heavy spring and fall pollen seasons.
Supporting Statistics
Three numbers that show why Huntsville's air, inside and out, is worth watching:
44% of Americans breathe failing-grade air. That's about 152.3 million people in counties that failed on ozone or particle pollution (2026).
Source: American Lung Association: State of the Air 2026
You spend about 90% of your time indoors. Indoor pollutant levels often run 2–5 times higher than outside, so your HVAC filter does much of the work.
Source: U.S. EPA: Indoor Air Quality
The PM2.5 limit just got stricter. In 2024 the EPA tightened the annual standard from 12.0 to 9.0 µg/m³.
Frequently Asked Questions
Glossary
AQI (Air Quality Index): A 0–500 scale that converts pollutant measurements into a single color-coded number; higher means more polluted.
PM2.5: Fine particulate matter 2.5 microns or smaller, such as soot, smoke, and combustion particles small enough to enter the lungs and bloodstream.
PM10: Coarse particles up to 10 microns, such as dust and pollen fragments.
Ground-level ozone: A gas formed when sunlight reacts with vehicle and industrial emissions; the main driver of Huntsville's summer smog.
MERV rating: "Minimum Efficiency Reporting Value," a 1–20 scale of how well an air filter captures particles; higher captures more.
MERV 13: A high-efficiency residential filter grade that captures a large share of fine particles, including smoke and PM2.5.
AirNow: The EPA's national real-time air-quality reporting network.
ADEM: Alabama Department of Environmental Management, which operates the state's ozone and PM2.5 monitors.
Written by Michelle Wan, Brand Manager and Air Quality Writer at Filterbuy. Reviewed for technical accuracy by David Clark, Licensed HVAC Technician. Published July 21, 2026 · Updated July 21, 2026. Live air quality data sourced from the EPA AirNow network and the Alabama Department of Environmental Management.