
Sioux Falls Real-Time AQI Tracker


Get Alerts For Unhealthy AQI In Your Area
When air quality in your area reaches unhealthy levels, we'll send you a quick alert, along with expert tips on how to reduce your exposure.
What's Actually In Sioux Falls Air Today?
What High AQI Means for Your Lungs in Sioux Falls
How to Read AQI
The Air Quality Index (AQI) measures how polluted the air is and how it may affect your health.
0–50 (Good): Air quality is satisfactory.
51–100 (Moderate): Acceptable, but some pollutants may pose minor concerns.
101–150 (Unhealthy for Sensitive Groups)
151–200 (Unhealthy)
201–300 (Very Unhealthy)
301+ (Hazardous)
Moderate
Still okay for most, but if you have asthma or allergies, take it easy and avoid long outdoor workouts.
Shop MERV 11 filters→What's the Right Filter for Your AQI Level?


Check Today's Live Real Time Air Quality Index AQI Map in Sioux Falls, SD Now
By Michelle Wan, Brand Manager and Air Quality Writer. Reviewed by David Clark, Licensed HVAC Technician. Published August 4, 2026. Updated August 4, 2026.
TL;DR
The live AQI map above shows the current Sioux Falls reading from the South Dakota monitoring network that feeds AirNow. Ozone drives most unhealthy hours here, and wildfire smoke causes the sharpest spikes. Check the number, work out which pollutant is behind it, then match your furnace filter to that answer.
Key Takeaways
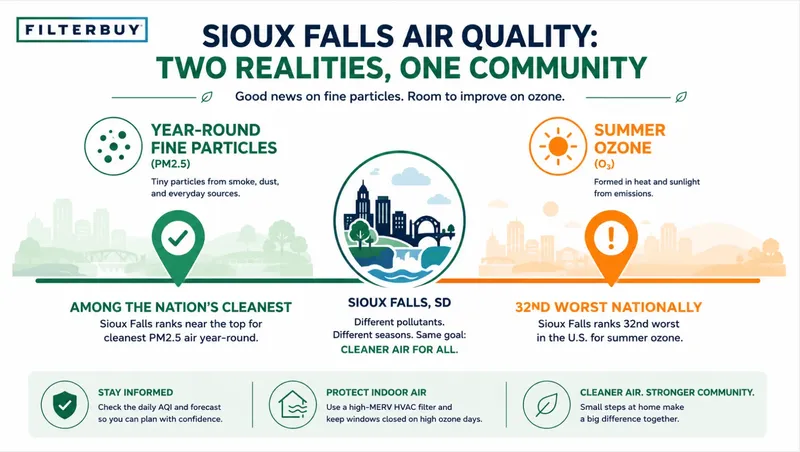
Sioux Falls holds a split record. The 2026 State of the Air report ranked the metro among the nation's cleanest for year-round particles and 32nd worst for ozone.
Ozone peaks on hot, low-wind afternoons from late May through September, producing most local readings above 100. Wildfire smoke causes the sudden PM2.5 spikes, and DANR alerts flag hourly readings above 35 micrograms per cubic meter.
The EPA recommends MERV 13, or the highest rating a system accepts, during smoke events.
What Today's Sioux Falls AQI Number Actually Tells You
The map above reports the current Air Quality Index on the EPA's 0 to 500 scale, reflecting whichever regulated pollutant is worst this hour. A reading of 78 might mean ozone on a July afternoon or drifting smoke in August, and which one changes what you do. Readings come from the South Dakota Department of Agriculture and Natural Resources, which measures particles, ozone, and sulfur dioxide here and feeds AirNow.
Two limits matter. One monitor reports for the whole metro, so conditions near Interstate 29 or downwind of a worked field can differ. Hourly data is provisional and shows only the worst single pollutant that hour. That makes the number a starting point, and what you control is what your system pulls that air through.
The Sioux Falls Air Quality Split That Most Trackers Miss
Sioux Falls does not fit the story a single AQI number tells. The American Lung Association's 2026 report ranked the metro 198th worst nationally for year-round particles, a tie for 13th best among cleanest metros, then 32nd worst for ozone with a D for short-term spikes.
Both findings describe the same city in the same year. When I first pulled these numbers I assumed I had mixed up two metros. Most days here are genuinely clean, and a short list of hot afternoons and smoke days accounts for nearly all unhealthy hours.
That split is the version of this problem we find hardest to solve for customers. A household in a polluted city knows it has a problem. A household here has no daily reminder, so the filter due in June is still in the return when smoke arrives in August.
What's Actually In Sioux Falls Air Today?
Three sources account for nearly every elevated AQI reading here, each with its own season and fix.
Ground-Level Ozone
Ozone forms when sunlight reacts with vehicle exhaust and industrial emissions on hot, still afternoons. DANR runs one of South Dakota's seven ozone monitors here, and ozone produces the worst AQI hours from late May through September.
Wildfire Smoke Transported From Canada And The West
Smoke reaches eastern South Dakota from fires a thousand miles away. DANR reports fine particle concentrations above the national standard statewide because of western and Canadian fires, and issues joint alerts with the South Dakota Department of Health when smoke is forecast to settle. Hourly PM2.5 above 35 micrograms per cubic meter is a health concern.
Farm, Road, And Construction Dust
Coarse particles rise from tillage, gravel roads, and construction across Minnehaha and Lincoln counties on dry, windy days. DANR names roads, construction, and farm tillage as primary PM10 sources statewide.
How To Tell Ozone From Smoke And When To Check
The AQI gives one number without saying what is in the air. Three checks take ten seconds.
Look at the horizon. Smoke is visible, casting the sky flat white or orange. Ozone is invisible, so if the air looks wrong it is particles.
Check the clock. Ozone needs sunlight, peaking roughly 2 p.m. to 7 p.m. A high reading at 6 a.m. is almost never ozone here.
Notice where you feel it. Ozone irritates the upper airway as a scratchy throat and chest tightness during exertion, easing within an hour indoors. Fine particles feel less sharp and linger. Dust tracks wind, not sun.
Timing beats frequency. In ozone season check mid-afternoon, since a clean morning says little about 5 p.m. During a smoke event check at dawn, because plumes move overnight. After it clears, check again before reopening windows.
What High AQI Means For Your Lungs In Sioux Falls
An AQI above 100 means people with asthma, COPD, or heart disease should shorten outdoor exertion and move workouts to early morning. Above 150, that applies to everyone.
Ozone and fine particles injure lungs differently. Ozone inflames airway tissue directly, producing the chest tightness runners notice along the Big Sioux River Greenway. Fine particles reach deep lung tissue and cross into the bloodstream. Research in Nature Communications in 2021 found respiratory hospitalizations rose considerably more with wildfire-specific PM2.5 than with other fine particles at the same concentration, so a smoke-driven AQI of 130 is not equivalent to an ozone-driven 130.
Outdoor workers face different math. An eight-hour shift at AQI 120 is a far larger dose than a thirty-minute walk, and exertion multiplies it. Shift heavy work before 10 a.m. on ozone days, wear a fitted NIOSH-approved N95 since a dust mask does nothing for PM2.5, and set vehicle ventilation to recirculate. Because outdoor pollution finds its way indoors, home is what you can change. Our guide to indoor air pollution covers that side.
How To Read The AQI Scale And Match Your Filter
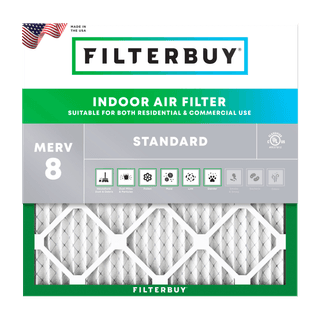
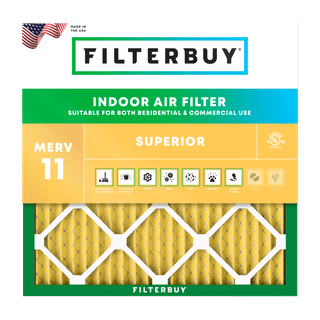
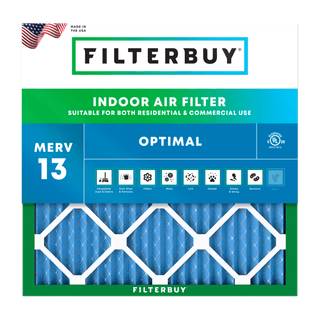
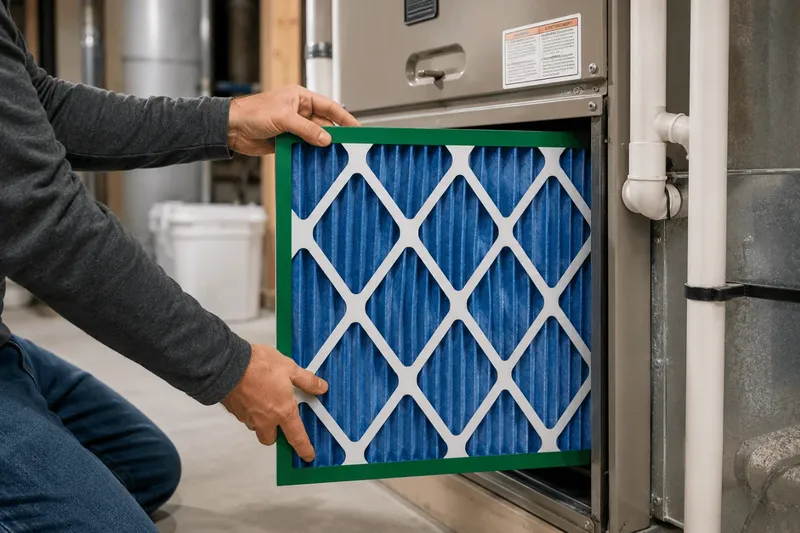
The EPA divides the AQI into six color-coded categories. Each signals a level of health concern, not a raw concentration, and 100 roughly matches the short-term national health standard. Match the filter to the number. Below 100, MERV 8 pleated filters handle everyday dust, pollen, and lint. Between 100 and 150, step up to MERV 11 pleated filters. Above 150, MERV 13 pleated filters capture the fine particulate matter that drives smoke days, and the EPA recommends that upgrade for any system that can take it. Our guide to how MERV ratings are measured covers the scale in full.
AQI categories follow the U.S. EPA Air Quality Index. Confirm your HVAC system tolerates a higher MERV rating before upgrading.
We manufacture all three in Talladega, Alabama, which is why this guidance gets specific instead of hedging. We know what each tier catches because we build the media and test it. Before upgrading on a smoke day, confirm your system can move the air.
The mistake I see most often is a homeowner jumping from MERV 8 to MERV 13 in an older furnace with an undersized return. The filter does its job. The blower cannot pull air through it. Check the static pressure rating on the manufacturer’s plate first. A MERV 11 your system can breathe through beats a MERV 13 that starves it.
David Clark, Licensed HVAC Technician
On a smoke day, close the windows, run the fan continuously, and set the thermostat and your vehicle to recirculate. Replace the filter once smoke clears instead of waiting for your calendar date, because one that spent four days catching wildfire PM2.5 loads from the inside where you cannot see it. We make more than 600 sizes so that never becomes a special order, and you can set up automatic replacement deliveries.
After manufacturing filters for over a decade and serving more than two million households, the pattern in places like Sioux Falls is consistent. Homes in mostly clean-air cities are the least prepared for the twenty bad days, because nothing in the other three hundred forty-five gave them a reason to think about it. The ones that handle smoke season well treat clean air as a reason to stay ready.
David Heacock, Founder and CEO, Filterbuy
Seven Trusted Sources For Tracking Sioux Falls Air Quality
Decode Any AQI Number Fast
The EPA's public reporting system. Defines all six categories and why 100 marks the health standard.
Source: AirNow AQI Basics
Get The Forecast For Minnehaha County
Covers 24 counties. Wind and stagnation forecasts flag dust days before monitors register them.
Source: NWS Sioux Falls Forecast Area
Spot Smoke Before It Arrives
Daily national fire activity, the upstream source of nearly every local PM2.5 spike.
Source: NIFC National Fire News
Learn Who Faces The Highest Risk
CDC guidance on who is most vulnerable, including children and people with chronic conditions.
Source: CDC Wildfires And Your Safety
Know When Air Turns Dangerous For Asthma
The Asthma and Allergy Foundation of America names AQI 101 and above dangerous for asthma.
Source: AAFA Weather Triggers Asthma
Build A Cleaner Air Room
How to choose a room, size a portable air cleaner, and fit an N95.
Source: EPA Reduce Your Smoke Exposure
Time Your Filter Replacement Right
ENERGY STAR recommends checking filters monthly in a furnace, heat pump, or central AC.
Source: ENERGY STAR Maintenance Checklist
Supporting Statistics
1. Sioux Falls Ranks 32nd Worst For Ozone, Among The Cleanest For Year-Round Particles
32nd worst nationally for ozone, improved from 29th.
89th worst for short-term particle spikes, down from 50th.
198th worst for year-round particles, tied 13th best among cleanest cities.
91,561 South Dakota children breathe unhealthy air.
Source: American Lung Association, State of the Air 2026, South Dakota
2. Wildfire Smoke Drove Hospitalizations Far Higher Than Other Fine Particles
1.3% to 10% more hospitalizations per 10 micrograms of wildfire PM2.5.
0.67% to 1.3% more for the same amount of non-wildfire PM2.5.
Identical AQI, different risk. Source changes toxicity.
Source: Aguilera et al., Nature Communications, 2021 (PMC7935892)
3. Sioux Falls Carries More State Air Monitors Than Almost Any SD City
1 of 9 PM2.5 sites and 1 of 7 ozone sites statewide.
1 of only 2 sulfur dioxide monitors, the other in Rapid City.
DANR attributes statewide PM2.5 exceedances to western and Canadian wildfires.
Frequently Asked Questions
Glossary
AQI (Air Quality Index): The EPA's 0 to 500 scale for outdoor air quality across six health categories, based on the worst regulated pollutant that hour.
PM2.5: Fine particulate matter 2.5 micrometers or smaller, able to reach deep lung tissue and the bloodstream. Wildfire smoke is largely PM2.5.
PM10: Coarse particulate matter 10 micrometers or smaller, including road, construction, and farm tillage dust.
Ground-Level Ozone: A gas formed when sunlight reacts with vehicle exhaust and industrial emissions. It causes most unhealthy AQI hours here in summer.
MERV: Minimum Efficiency Reporting Value, rating how well a filter captures particles of a given size. MERV 13 is not HEPA.
DANR: South Dakota's Department of Agriculture and Natural Resources, which runs the state monitoring network and issues alerts.