
Pittsburgh Real-Time AQI Tracker


Get Alerts For Unhealthy AQI In Your Area
When air quality in your area reaches unhealthy levels, we'll send you a quick alert, along with expert tips on how to reduce your exposure.
What's Actually In Pittsburgh Air Today?
What High AQI Means for Your Lungs in Pittsburgh
How to Read AQI
The Air Quality Index (AQI) measures how polluted the air is and how it may affect your health.
0–50 (Good): Air quality is satisfactory.
51–100 (Moderate): Acceptable, but some pollutants may pose minor concerns.
101–150 (Unhealthy for Sensitive Groups)
151–200 (Unhealthy)
201–300 (Very Unhealthy)
301+ (Hazardous)
Moderate
Still okay for most, but if you have asthma or allergies, take it easy and avoid long outdoor workouts.
Shop MERV 11 filters→What's the Right Filter for Your AQI Level?


Check Today's Live Real Time Air Quality Index AQI Map in Pittsburgh, PA Now
TL;DR
The Filterbuy live air quality map above shows real time AQI readings for Pittsburgh and Allegheny County. Check the color over your neighborhood, not the citywide number, because Mon Valley readings run higher than the North Side or Oakland. At 100 and above, close the house up, set the fan to On, fit MERV 13.
Key Takeaways
Hydrogen sulfide, the rotten egg smell in Clairton and Glassport, is not an AQI pollutant, so the map can read Good on a day the air smells wrong.
EPA redesignated Allegheny County to attainment for the 2012 annual fine particle standard in May 2026, yet the Lung Association still graded the metro an F on all three measures.
Inversions on cold, calm mornings trap pollution in the river valleys, the same mornings a furnace runs hardest.
How To Read The Live Pittsburgh AQI Map Above
Filterbuy builds the map at the top of this page, so start there. Find your neighborhood, read the number and color over it, and work from that rather than the citywide figure. The Air Quality Index runs from 0 to 500, where green and yellow suit most people and orange is where sensitive groups scale back.
Pittsburgh sits where three rivers meet, and the valleys hold air differently than the ridges. A reading in Lawrenceville says little about Clairton upriver, where the heaviest industry sits on the valley floor.
One quirk trips up residents more than any other. Allegheny County's dashboard reports a rolling 24-hour average, while this map reports a NowCast value weighted to recent hours, so in a smoke episode the two can sit far apart without either being wrong. Use the average for a week, the live value for today.
What Each AQI Level Means For Your Day In Pittsburgh
Category thresholds follow the U.S. EPA Air Quality Index. The middle column describes typical Allegheny County patterns, not a forecast. Always act on the live reading shown above.
The categories are EPA's. What changes locally is which pollutant gets Pittsburgh there: ozone on hot, stagnant afternoons, and fine particulate, the soot-sized particles known as PM2.5, on cold mornings and whenever smoke arrives. At 100 and above, do four things: fit a MERV 13 filter, set the thermostat fan to On so the system filters continuously, run a portable HEPA cleaner in occupied rooms, and keep the house closed without adding smoke from candles, frying or vacuuming.
Why The Map May Not Match What You Smell
The AQI measures five pollutants, and hydrogen sulfide is not one. U.S. Steel's Clairton Coke Works is Pennsylvania's largest source, and Allegheny County attributes Liberty monitor exceedances entirely to it. Your nose picks it up well below anything that moves the AQI.
Monitor spacing widens the gap, since sites sit miles apart. Carnegie Mellon's CREATE Lab built Smell PGH in 2016 for this, letting residents log odors and symptoms so reports reach the Allegheny County Health Department. If the map reads clean and the air does not, both can be true, which is why we tell Mon Valley customers to trust the nose on odor and the map on particulate.
Is The Air Safe To Breathe In Pittsburgh Today?
If you are wondering whether the air quality is bad in Pittsburgh today, most people watch the wrong threshold. Code Red gets the headlines, but orange is the line for children, adults over 65, pregnant people and anyone with asthma, COPD or a heart condition. Those groups act at orange rather than wait for red.
What Actually Drives Pittsburgh's Air Quality
Two pollutants move the AQI here, and terrain decides how much reaches you.
PM2.5 comes from Mon Valley coke and steel operations, diesel traffic on the Parkway East and West, rail, barges and winter wood burning. Ozone forms when sunlight cooks those emissions.
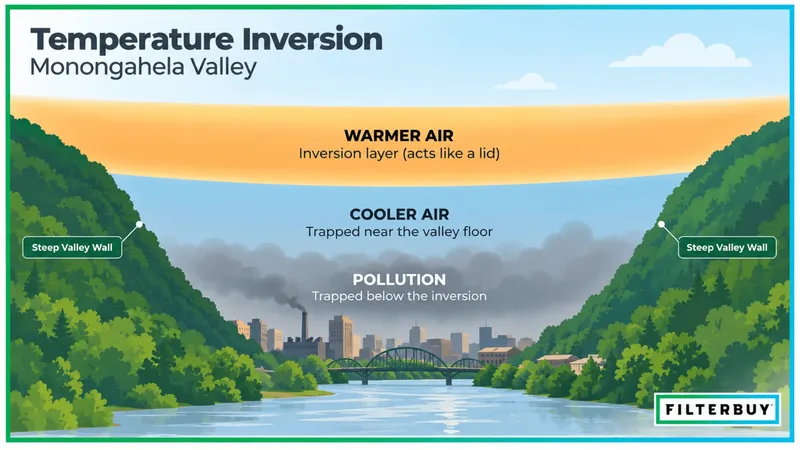
Terrain does the rest. On clear, cold, calm nights the air near the ground cools and a warmer layer settles above like a lid. In the Monongahela Valley, where the walls are steep and twenty industrial sources operate, that lid produces the county's highest readings. Pittsburgh lived the worst version in 1948, when the Donora smog downriver killed twenty people. Nothing today comes close, though the mechanism has not changed.
Air Quality By Neighborhood And ZIP Code
Allegheny County runs a network of fixed monitors. The nearest tells you more than the county figure.
Sites are drawn from the Allegheny County Health Department air monitoring network. Site locations and the network plan are reviewed annually and can change.
Glassport, Lincoln, North Braddock and Clairton post higher readings than Downtown or Squirrel Hill, so we read Liberty as the Mon Valley baseline.
How Pittsburgh Compares Nationally Right Now
Pittsburgh sits oddly in 2026, cleaner than ever on one yardstick while failing another. EPA redesignated the Allegheny County area to attainment for the 2012 annual fine particulate standard in May 2026, after decades of nonattainment. Attainment is a federal air quality standard measured over three years, so it says nothing about today.
The same year, the American Lung Association failed the metro on all three measures in its State of the Air 2026 report. Year-round particles hit a best-ever value and still earned an F at 16th worst nationally, daily particles ranked 11th, and ozone fell to an F.
Neither is wrong. It grades tighter benchmarks and counts bad days, and the region remains in nonattainment for the 2008 ozone standard. That gap is why a live map beats a compliance record.
Wildfire Smoke Is Now Pittsburgh's Biggest Single-Day Risk
Smoke from fires a thousand miles away now produces Pittsburgh's worst air pollution days. In June 2023, Quebec smoke pushed the index above 300 across Western Pennsylvania, and in July 2026 Canadian and Minnesota smoke prompted a statewide Code Red Air Quality Alert, with parts of Allegheny County hitting Code Maroon and the city closing its pools.
An inversion breaks when the weather turns, but smoke can sit for days. On Very Unhealthy days, follow AirNow and county guidance before anything on this page. The Filterbuy Pittsburgh wildfire and smoke map tracks fires and plumes separately.
What A Mon Valley Watch Or Warning Means
Allegheny County added the Mon Valley Air Pollution Episode Rule in September 2021. When forecasters expect a strong inversion, the county issues a Watch and then a Warning, and facilities across 32 communities must cut emissions.
A Warning means closing windows overnight, keeping the fan running and moving exercise indoors. Sign up for Allegheny Alerts, since the Watch comes first and buys a night of lead time.
Our Take: What We See In Pittsburgh Homes
Filterbuy has built filters in U.S. plants since 2013, including one in Pennsylvania, and we run the map here. We see the monitor readings and the filters people pull from furnaces.
The thing we run into most in older Pittsburgh houses has nothing to do with MERV ratings. Many have no filter slot at the furnace, so filters sit behind return grilles in a wall or ceiling, often more than one, unchanged for years because nobody knows they exist. Find yours before shopping, and expect custom filter sizes rather than a size the hardware store stocks.
Timing is second. Inversions peak on cold, still mornings, when the furnace runs hardest, so a clean filter in January outworks the same one in May. During a smoke stretch, stop counting days and look: replace it once it goes dark brown or black, well before the normal interval. Keep spares.
Third is bypass. If a filter does not seat snugly, air goes around it, and a MERV 13 with a gap underperforms a seated MERV 8.
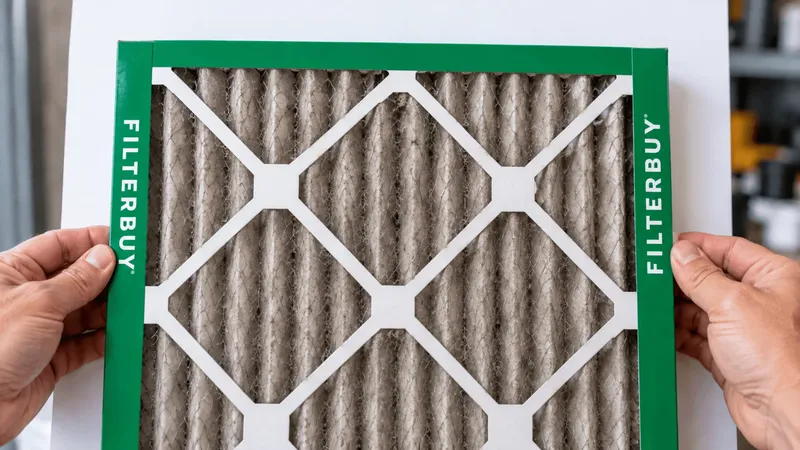
The filter in a Mon Valley basement is a record of what that block actually breathed. Pull it out, hold it against a sheet of white paper, and you are looking at a whole inversion season. No single day’s reading shows you that.
Michelle Wan, Brand Manager and Air Quality Writer, Filterbuy
Matching Your Filter To The Air Outside
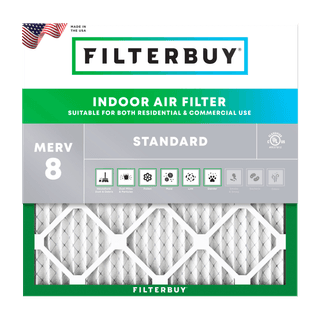
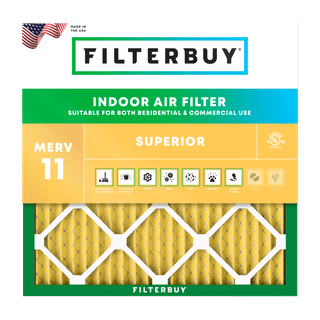
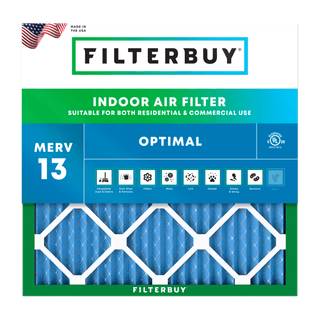
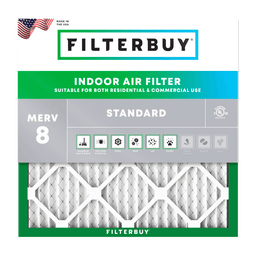
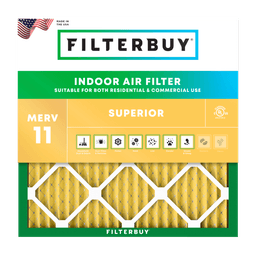
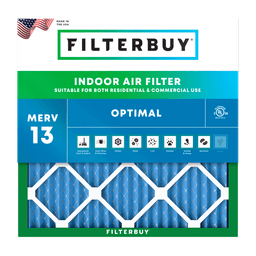
Use the AQI to decide what your filter must do. From Good to Moderate, a fitted MERV 8 pleated filter handles household dust and pollen plus lint off bedding and carpet. For pets and allergies, MERV 11 captures finer particles. EPA recommends a filter rated MERV 13 or higher in the central system during smoke events. AQI 100 is where Filterbuy says to act on it.
Two caveats. MERV 13 is not HEPA, and they use different test methods, so the numbers are not comparable. EPA notes most furnaces accommodate MERV 13 without equipment problems as long as the filter is changed often, so treat it as a fit check.
If your home has no ductwork, common in older Pittsburgh rowhouses heated by radiators, portable HEPA cleaners become the primary defense. EPA sizes them by smoke CADR at about two thirds of room square footage, so a 300 square foot bedroom wants a smoke CADR near 200. Skip anything producing ozone. Filterbuy would rather say that than sell a filter you cannot install. If you travel, the Pennsylvania live AQI map covers the rest of the state.
Supporting Statistics
Three findings behind the guidance above.
1. Children screened near major Allegheny County pollution sources had 22.5 percent asthma prevalence, against 8.5 percent nationally.
Source: STARS study, 1,200+ students at 15 schools, Journal of Asthma. Read the summary
Why it matters: the county average hides that gap. Read the map at your address.
2. A 12 to 19 percent emissions cut at Clairton may still leave days of a sustained inversion above the federal guideline.
Source: Clean Air Task Force via the Breathe Project. Read the analysis
Why it matters: a Warning lowers the peak, it does not clear the valley.
3. Americans spend about 90 percent of their time indoors, where some pollutant levels run 2 to 5 times outdoor levels.
Source: EPA Report on the Environment. Read the EPA data
Why it matters: the map covers a fraction of the air you breathe. The rest is indoor.
Frequently Asked Questions
About The Author
Michelle Wan is Brand Manager and Air Quality Writer at Filterbuy, where she writes the company's city-level air quality guides. Technically reviewed by David Clark, Licensed HVAC Technician. Filterbuy is a family-owned American manufacturer producing pleated HVAC filters in U.S. facilities since 2013.
Glossary
AQI (Air Quality Index): EPA's 0 to 500 outdoor air scale, from Good through Hazardous.
PM2.5: Fine particulate 2.5 microns or smaller. The main driver of Pittsburgh's winter and smoke readings.
Temperature inversion: Warm air settling above cooler air near the ground, trapping pollution in valleys. Common in the Mon Valley in fall and winter.
Mon Valley Air Pollution Episode Rule: A 2021 county rule requiring industrial sources to cut emissions during an inversion Watch or Warning.
ACHD (Allegheny County Health Department): The county agency that monitors air and enforces air rules here.
MERV: Minimum Efficiency Reporting Value, the 1 to 16 scale for how much particulate a filter captures.
Hydrogen sulfide: A rotten egg gas detectable at very low concentrations. Regulated by Pennsylvania, but not part of the AQI.
Filterbuy: A family-owned American air filter manufacturer building pleated MERV 8, MERV 11 and MERV 13 filters in U.S. plants since 2013.