
Newark Real-Time AQI Tracker


Get Alerts For Unhealthy AQI In Your Area
When air quality in your area reaches unhealthy levels, we'll send you a quick alert, along with expert tips on how to reduce your exposure.
What's Actually In Newark Air Today?
What High AQI Means for Your Lungs in Newark
How to Read AQI
The Air Quality Index (AQI) measures how polluted the air is and how it may affect your health.
0–50 (Good): Air quality is satisfactory.
51–100 (Moderate): Acceptable, but some pollutants may pose minor concerns.
101–150 (Unhealthy for Sensitive Groups)
151–200 (Unhealthy)
201–300 (Very Unhealthy)
301+ (Hazardous)
Moderate
Still okay for most, but if you have asthma or allergies, take it easy and avoid long outdoor workouts.
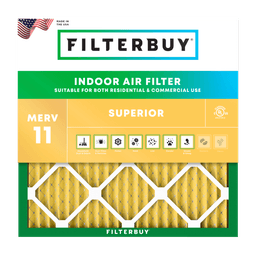
Shop MERV 11 filters→What's the Right Filter for Your AQI Level?


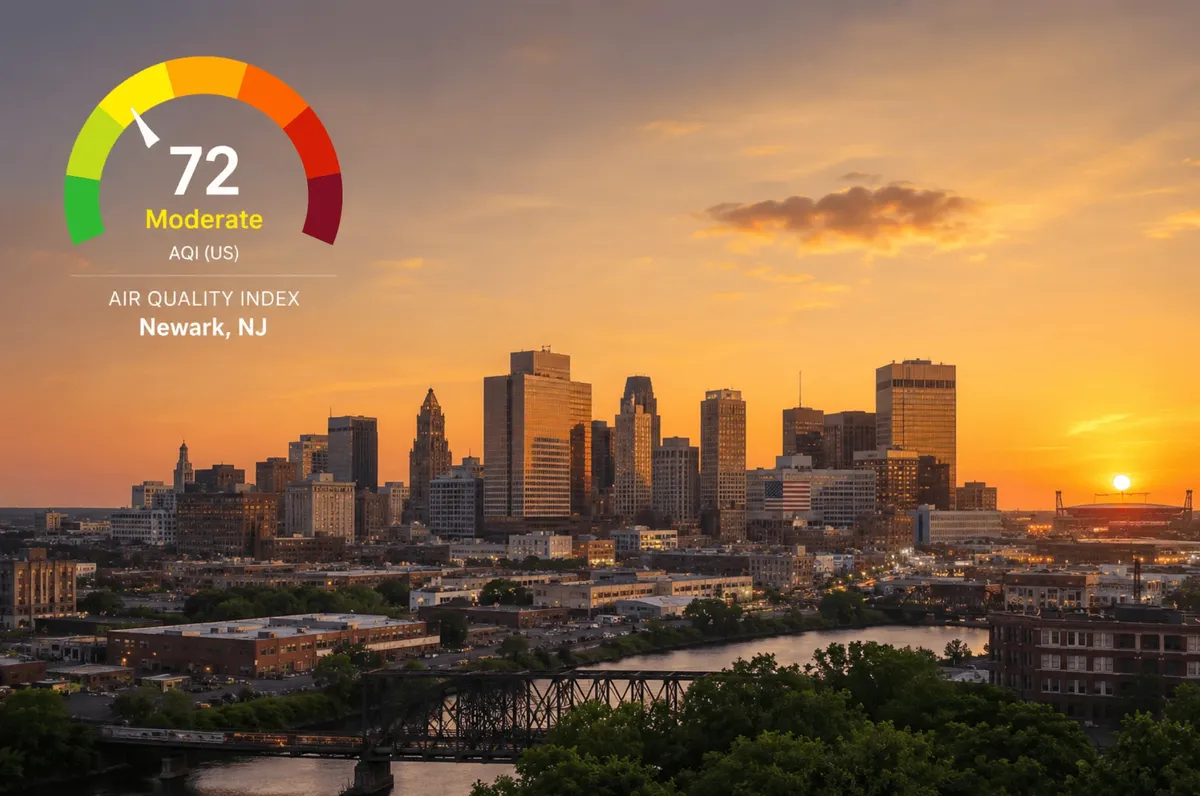
Check Today's Live Real Time Air Quality Index AQI Map in Newark, NJ Now
Author: Michelle Wan, Brand Manager & Air Quality Writer | Filterbuy | Reviewer: David Clark, Licensed HVAC Technician | Publish Date: July 17, 2026 | Updated Date: July 17, 2026
TL;DR
Newark, New Jersey's air quality changes throughout the day based on traffic, weather, and regional wildfire smoke, so the reading on this page updates in real time instead of staying fixed. The live map below pulls current data from the government monitoring network that covers Newark and converts it into the Air Quality Index (AQI), the 0 to 500 scale that tells you whether today's air supports normal outdoor activity. Newark sits inside the New York-Newark metro area, which the American Lung Association's 2026 State of the Air report graded an F for ozone smog for the third year in a row, even as the metro area's particle pollution grades improved. Check the live reading below before you head outside, especially if you have asthma, a heart condition, or young kids at home. During wildfire smoke season, Filterbuy's live wildfire and smoke map tracks active fires and smoke plumes alongside the AQI shown here.
Key Takeaways
Newark's air quality is measured through the national Air Quality Index (AQI), a 0 to 500 scale built on five pollutants, with ozone and fine particle pollution (PM2.5) driving most unhealthy days in New Jersey.
The New York-Newark metro area earned an F grade for ozone smog in the American Lung Association's 2026 State of the Air report, its third consecutive failing grade and the 12th worst ozone ranking in the country.
New Jersey's Department of Environmental Protection operates a statewide air monitoring network, and the closest active stations feed the real-time data shown in the live map above.
Wildfire smoke from Canadian and Western U.S. fires can raise Newark's PM2.5 levels during spring and summer, even when local emissions stay steady.
People with asthma, heart disease, or lung disease, along with children and older adults, should check the AQI before extended time outdoors on orange, red, purple, or maroon days.
Filterbuy can help Newark residents reduce their exposure to indoor particle pollution between outdoor AQI checks with a properly sized, higher-MERV HVAC filter.
Pollution is not even across Newark: neighborhoods near the port, airport, and highway corridor, including the Ironbound, carry a heavier burden than the citywide average.
Newark's air quality follows a seasonal pattern: ozone climbs on hot summer afternoons, wildfire smoke can spike PM2.5 from June through October, and cold, calm winter days can trap emissions closer to the ground.
What Newark's Air Quality Index Means Today
The reading on the live map above places Newark's air into one of six color-coded AQI categories, from Green (Good) to Maroon (Hazardous), based on whichever pollutant, ozone or fine particles, is highest at that hour. The U.S. Environmental Protection Agency built the AQI so residents in any city can read the same 0 to 500 scale and immediately understand the health risk, without needing to interpret raw pollutant concentrations.
Newark's real-time number is a NowCast AQI, a calculation method the EPA uses to blend several hours of monitoring data into a single current reading. NowCast reacts faster than a simple daily average, which matters on days when a wildfire smoke plume or a traffic-heavy rush hour changes conditions within a matter of hours.
We cross-checked how AirNow's NowCast reading compares with NJDEP's station data for Newark while building this page, rather than trusting a single feed, since relying on just one source can miss a short-lived spike during a fast-moving event like wildfire smoke.
It's also the same reading Filterbuy points customers toward before recommending a MERV upgrade. Guessing at outdoor conditions from an app icon or the color of the sky is far less reliable than checking the actual number.
Source: U.S. EPA Air Quality Index categories. Newark's live reading appears in the map at the top of this page.
What Is Driving Air Quality In Newark
Newark's air quality problems come mainly from two pollutants: ground-level ozone and fine particle pollution (PM2.5). Ground-level ozone forms when heat and sunlight react with emissions from vehicles, industrial facilities, and the dense highway network that surrounds the city, which is why ozone readings tend to climb on hot, sunny afternoons. PM2.5 comes from a mix of local vehicle and industrial emissions plus regional sources that blow in from outside New Jersey, including seasonal wildfire smoke.
Newark's location inside the New York-Newark, NY-NJ-CT-PA metro area places it among a group of 13 New Jersey counties that the American Lung Association's 2026 State of the Air report graded an F for ozone smog, the metro area's third straight failing grade and its 12th worst ozone ranking nationwide. The same report found the metro area's particle pollution had improved on both measures it tracks: a D grade for short-term (daily) particle spikes, up from an F the year before, and a passing grade for year-round particle levels, even as ozone continued to worsen.
We didn't stop at that single headline grade. Reading across all three years behind the 2026 report shows Newark's ozone problem worsening steadily rather than spiking once and recovering, which is the more useful signal if you're deciding whether this is a bad summer or a pattern worth planning your allergy or asthma medication schedule around.
Knowing which pollutant is behind a bad day matters for more than planning your afternoon. Filterbuy builds its MERV 8, 11, and 13 lineup around this same distinction, since a filter tuned for everyday dust behaves differently from one built to catch the fine particles that ozone and wildfire smoke leave behind.
Newark's Air Quality Calendar: What To Expect Each Season
The live map above tells you what's happening right now. This section, built from the same seasonal patterns Filterbuy tracks across the filters we ship nationwide, tells you what to expect before it shows up on the map, so you can stock the right filter and plan around your household's worst months instead of reacting the day AQI spikes.
Summer Ozone Season (Roughly May Through September)
Heat and sunlight cook vehicle and industrial emissions into ground-level ozone, so readings tend to climb on hot, sunny afternoons and ease overnight. This is the driver behind Newark's F grade for ozone smog, and it is the most predictable of the four seasonal patterns here.
Wildfire Smoke Season (Roughly June Through October)
Canadian and Western wildfire smoke can drift into the Northeast and spike Newark's PM2.5 reading within hours, even on a day that starts out clear. Unlike ozone, smoke-driven spikes do not follow a daily heat pattern, which is why we recommend checking the live map more than once a day during this window.
Winter Stagnant Air (Roughly November Through February)
Cold, calm days can trap vehicle and home heating emissions closer to the ground in dense urban areas like Newark, though this pattern is typically milder here than in mountain or valley cities where it gets more attention. It is still worth a second look at the map on windless winter days.
Spring Transition (Roughly March Through April)
Rising temperatures start the ozone season early in some years, and tree and grass pollen can overlap with lingering winter particle pollution. If you manage seasonal allergies as well as asthma, this is the stretch to watch both the AQI and the pollen count together.
Why Newark's Air Quality Varies By Neighborhood
Newark's air is not uniform across the city. Its industrial waterfront sits where Port Newark-Elizabeth, one of the busiest seaports on the East Coast, meets Newark Liberty International Airport, plus the convergence of the New Jersey Turnpike, Interstate 78, and Routes 1 and 9. That mix of diesel truck traffic, jet emissions, and highway congestion feeds directly into the citywide readings this page tracks.
Neighborhoods closer to that corridor, including the Ironbound section along the Passaic River, carry a heavier pollution burden than the city average. New Jersey's 2020 Environmental Justice Law recognizes this pattern directly: it requires an added health-impact review before state regulators can approve new industrial permits in a neighborhood already classified as overburdened.
That local burden shows up in the health data, too. Rutgers Health estimates that roughly 1 in 4 Newark children has asthma, compared with a national average near 1 in 11, one more reason this page treats children as a standing sensitive group rather than a footnote.
Wherever you are in Newark, Filterbuy's live map and MERV guidance below apply the same way: check the reading for your own ZIP code rather than assuming the citywide number matches your block.
How Wildfire Smoke Affects Newark's Air Quality
Newark does not need a nearby wildfire to feel the effects of one. Smoke plumes from Canadian wildfires and Western U.S. fire seasons can travel hundreds of miles and settle over the Northeast, pushing PM2.5 readings up even when local traffic and industrial emissions stay flat. Research from Scripps Institution of Oceanography found that PM2.5 from wildfire smoke harms respiratory health more than an equal concentration of PM2.5 from other sources, which is one reason health officials treat smoke-driven spikes as a distinct concern rather than a routine pollution day. That study is linked in the Supporting Statistics section below.
When a smoke plume moves through the region, the live map above will show the change within hours, since the NowCast calculation responds quickly to rapidly shifting conditions. Checking the map before outdoor plans is more reliable than judging air quality by sight, since fine particles can remain harmful even on days that look clear.
This is also why Filterbuy recommends stepping up to a MERV 13 filter specifically during smoke-driven spikes, rather than treating every high-AQI day the same. Ozone and everyday dust respond well to a MERV 8 or 11 filter, but wildfire smoke calls for the finer capture a MERV 13 rating provides.
Out Of Filters When Smoke Hits? Build A Box Fan Air Cleaner
If a smoke advisory catches you before a fresh filter arrives, the EPA has researched a low-cost stopgap. Taping four MERV 13 furnace filters and a newer-model box fan into a cube, sometimes called a Corsi-Rosenthal box, is the basic design. EPA lab testing found this design meaningfully reduces indoor smoke particles, especially with a cardboard shroud added, though a loaded filter stops working, so swap it out as soon as it looks dark or dirty. It is not a replacement for your HVAC filter, just a bridge until your regular filtration is back in place.
For full placement, sizing, and safety guidance, see Filterbuy's guide to running an air purifier during wildfire season, which walks through setting up a cleaner-air room for the heaviest smoke days.
How To Protect Your Health When Newark's AQI Rises
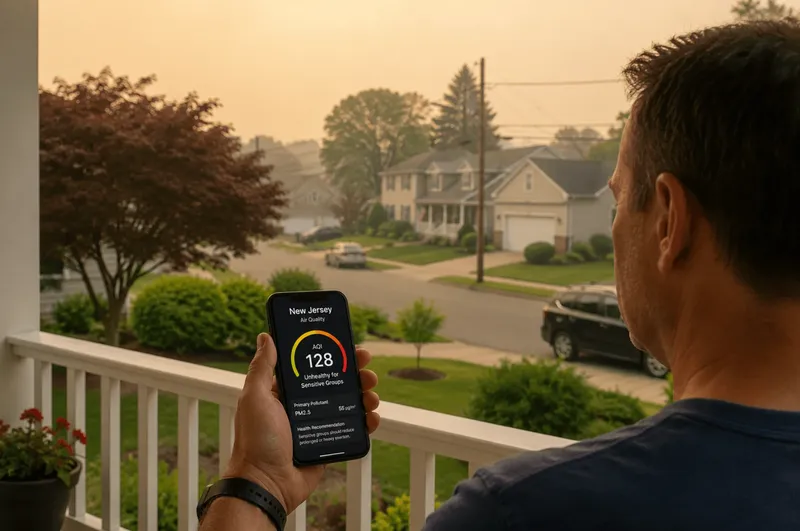
We built the guidance below around the same thresholds public health agencies use, then layered in what a decade of manufacturing filters for households like yours has taught us about which precautions actually get followed. Sensitive groups, including people with asthma, heart disease, or lung disease, along with children, older adults, and pregnant women, should check the live map before planning extended time outdoors. On Orange days and above, sensitive groups should shorten or reschedule strenuous outdoor activity. On Red days and above, the general public should also reduce prolonged outdoor exertion.
Check the live AQI reading above before outdoor exercise, yard work, or letting kids play outside for an extended period.
Keep windows and doors closed on Orange days and above, especially during wildfire smoke events.
Run your HVAC system's fan to circulate and filter indoor air, and confirm your filter is rated to capture fine particles.
Use a portable air cleaner in bedrooms or main living spaces if your home lacks central air filtration.
Reschedule strenuous outdoor activity for sensitive household members when the map shows Red, Purple, or Maroon.
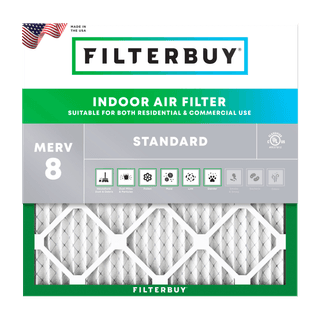
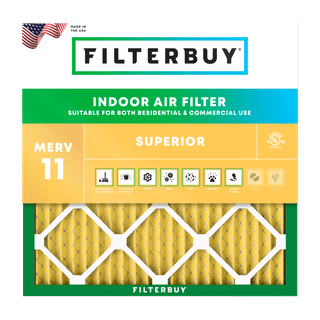
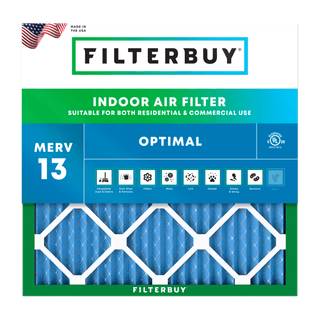
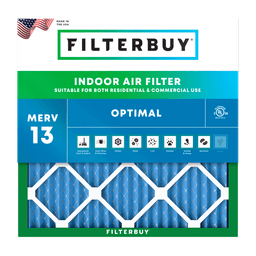
For a level-by-level breakdown, see which MERV rating to use on high-AQI days: Shop MERV 8 for everyday days, Shop MERV 11 for Moderate readings, and Shop MERV 13 once the map shows Unhealthy for Sensitive Groups or worse, provided your HVAC system can handle it.
How Filterbuy Helps Protect Newark Homes From Poor Air Quality
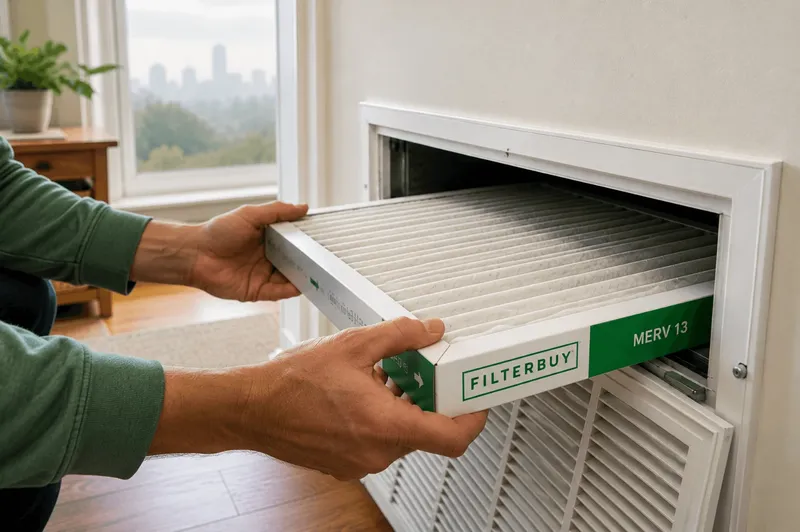
Outdoor air quality is only half the picture. On days when Newark's AQI climbs into Orange or higher, the air inside a home becomes the more controllable variable. We've spent more than a decade manufacturing HVAC filters, which gives us a different vantage point than a general news or weather site: we see which MERV ratings actually hold up in real return vents, not just on a lab spec sheet, and a properly sized, higher-MERV filter is one of the most direct ways a household can reduce its exposure to fine particles between outdoor AQI checks.
We ship filters into some of the most polluted metro corridors in the country, and Newark’s mix of port traffic, airport emissions, and highway congestion is a real stress test for any residential filter. The households that do best aren’t the ones buying the highest MERV rating they can find. They’re the ones matching the rating to what their system can actually handle, then changing it before it looks dirty.
David Heacock, Founder and CEO, Filterbuy
Working on this page, the thing that surprised me most wasn't the AQI number itself. It was how much Newark's air quality depends on which block you're standing on. The Ironbound carries a heavier load than the citywide average, and that's not a guess. It's written directly into how New Jersey's environmental justice law defines an overburdened community.
Michelle Wan, Brand Manager & Air Quality Writer, Filterbuy
After manufacturing filters for over a decade and serving more than two million households, Filterbuy designs its residential filters to capture the fine particles that matter most on high-AQI days, without restricting airflow more than a system is built to handle.
Frequently Asked Questions About Newark's Air Quality
Glossary
AQI (Air Quality Index): A 0 to 500 scale the EPA uses to report how polluted the air currently is or is forecast to become, and what health effects might be a concern.
PM2.5: Fine particulate matter with a diameter of 2.5 micrometers or smaller, small enough to travel deep into the lungs and, in some cases, the bloodstream.
Ozone (ground-level): A gas that forms when heat and sunlight react with vehicle and industrial emissions, causing lung irritation and inflammation at ground level.
NowCast: An EPA calculation method that blends several hours of recent monitoring data into a single current AQI reading, updating faster than a standard daily average.
Sensitive Groups: People with a higher risk of health effects from air pollution, including those with asthma, heart disease, or lung disease, along with children and older adults.
NAAQS: National Ambient Air Quality Standards, the EPA's legally enforceable limits for six major air pollutants under the Clean Air Act.
MERV Rating: Minimum Efficiency Reporting Value, the 1-to-16 scale Filterbuy uses to grade its residential filter lineup (MERV 8, 11, and 13) by how effectively each captures airborne particles.
Overburdened Community: A New Jersey Environmental Justice Law term for a neighborhood already carrying a heavy pollution burden, which triggers an added health-impact review before new industrial permits can be approved there.
The 7 Sources We Trust To Back Every Fact On This Page
We're obsessed with clean air, so we're just as obsessed with where our facts come from. Every claim on this page traces back to one of the seven sources below, each pulled from a distinct .gov or .org domain so you're never getting the same source twice.
Decode Today's AQI Color Before You Head Outside
We lean on the EPA's guide to using the Air Quality Index to explain what each color category means and how the NowCast calculation behind Newark's live reading actually works, so the number above stops being a mystery.
See Exactly How Fine Particles Affect Your Lungs And Heart
We turn to the EPA's page on the health and environmental effects of particulate matter for the specific outcomes, from aggravated asthma to heart attacks, tied to the fine particles driving most of Newark's unhealthy air days.
Check The Official Monitoring Stations Watching Newark's Air
We pull straight from the New Jersey Department of Environmental Protection's air monitoring network, the state agency running the fixed stations that feed the live map above, so you're getting Newark's air quality straight from the source.
Track How Air Pollution Shapes Public Health Nationwide
We reference the CDC's outdoor air quality tracking program to show how agencies use monitoring and modeled data together to flag the asthma and cardiovascular risks tied to poor air quality, in Newark and everywhere else.
Compare Newark's Grade To Cities Across The Country
We cite the American Lung Association's 2026 State of the Air report for New Jersey, which ranks the New York-Newark metro area against every other metro in the nation, so you can see exactly where Newark's ozone problem stands.
Understand How Air Quality Indexes Work Around The World
We include Wikipedia's overview of air quality indexes for readers who want the bigger picture, comparing how the 0 to 500 U.S. scale stacks up against the systems other countries use.
See Who Calls Newark Home And Why This Data Matters Here
We ground this page in the U.S. Census Bureau's QuickFacts profile of Newark, New Jersey, because knowing how many households a given AQI reading affects is part of taking air quality seriously.
3 Studies That Back What We're Telling You Above
We back our guidance with research. Here are the three studies behind it, each from a distinct .gov or .org source.
1. Wildfire Smoke Hits Your Lungs Harder Than Everyday Pollution
A 10 µg/m³ rise in wildfire-specific PM2.5 raises respiratory hospitalizations 1.3% to 10%.
The same rise from other PM2.5 sources raises hospitalizations only 0.67% to 1.3%.
Why it matters: it's why we treat wildfire smoke as a distinct concern, not routine pollution.
Source: Scripps Institution of Oceanography, published in Nature Communications, hosted on the National Institutes of Health's PMC archive.
2. Rising Fine Particle Pollution Drives Up Stroke Hospitalizations
Stroke admissions rose 2,536 cases for every additional 1 µg/m³ of annual PM2.5 exposure.
The finding is based on more than 63 million Medicare enrollee records, 2000 to 2016.
Why it matters: it's the research behind treating PM2.5 spikes as a heart risk, not just a lung risk.
3. Nearly 5 Million U.S. Kids Live With Asthma
An estimated 4.9 million children in the United States have asthma.
The figure traces back to CDC survey data.
Why it matters: kids' still-developing lungs make them more sensitive to the ozone and PM2.5 spikes described above.