
Bridgeport Real-Time AQI Tracker


Get Alerts For Unhealthy AQI In Your Area
When air quality in your area reaches unhealthy levels, we'll send you a quick alert, along with expert tips on how to reduce your exposure.
What's Actually In Bridgeport Air Today?
What High AQI Means for Your Lungs in Bridgeport
How to Read AQI
The Air Quality Index (AQI) measures how polluted the air is and how it may affect your health.
0–50 (Good): Air quality is satisfactory.
51–100 (Moderate): Acceptable, but some pollutants may pose minor concerns.
101–150 (Unhealthy for Sensitive Groups)
151–200 (Unhealthy)
201–300 (Very Unhealthy)
301+ (Hazardous)
Moderate
Still okay for most, but if you have asthma or allergies, take it easy and avoid long outdoor workouts.
Shop MERV 11 filters→What's the Right Filter for Your AQI Level?



Check Today's Live Real Time Air Quality Index AQI Map in Bridgeport, CT Now
Reviewed and updated August 18, 2026 by Michelle Wan. Technical review by David Clark.
Bridgeport, Connecticut’s air quality is measured at the Bridgeport Roosevelt School station run by the Connecticut Department of Energy and Environmental Protection, and reported on the federal Air Quality Index scale of 0 to 500. Fairfield County holds an F grade for ozone smog. Check the live map above, then handle the air inside your home.
TL;DR
Two pollutants drive Bridgeport’s air in two seasons: PM2.5, which the city’s monitor measures year-round, and ground-level ozone, which peaks in summer and is not measured in Bridgeport at all. Fairfield County earned an F for ozone in the American Lung Association’s 2026 State of the Air report, the most ozone-polluted county east of Texas. Check the live map before outdoor exercise, and run a properly rated filter indoors.
Key Takeaways
Bridgeport’s regulatory data comes from the Roosevelt School station at 680 Park Avenue, EPA site 09-001-0010, established 1982, sitting 23 feet above sea level and 50 meters north of I-95.
The station measures PM2.5, PM10, and sulfur dioxide but not ozone, so a Bridgeport ozone value is a forecast, not a local reading.
DEEP reports the Bridgeport site records some of the highest sulfur dioxide and PM2.5 levels in the state network.
Every Bridgeport pollutant meets its federal standard, yet the whole state is in serious nonattainment for ozone, because ozone arrives from outside Connecticut.
An AQI of 0 to 50 is Good and 51 to 100 is Moderate. Above 100 the air turns unhealthy for sensitive groups first, then for everyone.
What Is The Air Quality In Bridgeport, CT Today?
The live map above shows Bridgeport’s current Air Quality Index reading, updated hourly. The AQI is the EPA’s tool for outdoor air quality and health risk, in six color-coded categories.
The AQI reports the single worst pollutant, not an average. That matters more in Bridgeport than most cities, because the pollutant driving a July afternoon is rarely the one driving a January morning. For the arithmetic, see how the Air Quality Index is calculated.
Connecticut DEEP publishes a town-level AQI forecast that lists Bridgeport separately, with PM2.5 and ozone values apart. It is issued once daily and skips weekends and holidays, so for a Saturday reading the federal AirNow interactive map is better. DEEP also staffs a hotline at (800) 249-1234.
Where Bridgeport’s Air Quality Numbers Actually Come From
Bridgeport’s official data originates at one location: the Roosevelt School station, one of 14 in the DEEP network. Its siting explains much about the readings.
Source: Connecticut DEEP, 2026 Draft Annual Air Monitoring Network Plan, May 2026.
Source: Connecticut DEEP, 2026 Draft Annual Air Monitoring Network Plan, with site history on the DEEP record for Bridgeport Roosevelt School. The plan places the station 50 meters north of I-95 and 200 meters west of the Route 8 interchange, in a schoolyard ringed by homes, and states that Bridgeport records some of the highest sulfur dioxide and PM2.5 levels in the DEEP network. A monitor that close to a major interchange is measuring traffic, and the readings reflect it.
Why Bridgeport Has No Ozone Monitor
The Bridgeport Roosevelt School station does not measure ozone. DEEP runs 11 ozone sites statewide and none is in Bridgeport, so a Bridgeport ozone forecast is modeled from the regional network, not measured in the city.
Those monitors record Connecticut’s highest ozone. Preliminary 2025 design values put Stratford and Westport at 80 parts per billion and Greenwich at 79, against a standard of 70. Nine of the twelve sites in the 2025 ozone table, DEEP’s 11 plus an EPA site in Pomfret, exceed it.
Source: Connecticut DEEP, 2026 Draft Annual Air Monitoring Network Plan. Design values are preliminary and will be reconciled with EPA figures in the final plan.
Filterbuy went looking for a Bridgeport ozone measurement and there is not one. That absence is the useful finding, not the forecast number. Treat a summer ozone value as a regional signal and the PM2.5 value as locally measured.
Why Fairfield County Has The Worst Ozone East Of Texas
In the American Lung Association’s 2026 State of the Air report, Fairfield County was worst in Connecticut on all three measures: an F for ozone, a D for daily fine particles, a pass for the year-round average. Its ozone worsened a third straight year, ranking it the most ozone-polluted county east of Texas. The report counted 707,181 Connecticut children breathing unhealthy air.
The mechanism is geographic. Per the EPA, New York City pollutants drift over Long Island Sound, where cooler water chills the air above and traps the plume like a lid on a pot. Afternoon heating onshore drives a sea breeze that carries that ozone-rich air inland. The Long Island Sound Tropospheric Ozone Study measured exactly this. Read the EPA on ozone transport across Long Island Sound.
Bridgeport sits on that shoreline. DEEP says the whole state is in serious nonattainment for ozone and cannot attain the standard without federal action on interstate transport.
Three Findings From The Monitoring Record
Filterbuy pulled these from DEEP’s monitoring data, not the live map.
Bridgeport has the state’s worst coarse-dust problem. Its three-year fourth-highest PM10 reading is 91 micrograms per cubic meter against 34 in New Haven, and it is the only Connecticut site with any estimated annual exceedance. That is road dust off I-95, not smoke, and a MERV 8 already catches particles that size. Not a reason to upgrade.
DEEP keeps a sulfur dioxide monitor here by choice. Federal rules no longer require one. The 2026 plan says DEEP keeps it because local sulfur dioxide runs high and nearby residents are vulnerable and sensitive.
The closest ozone monitor may not survive. Stratford Lighthouse sits on federal land the GSA has listed for sale. DEEP says it will seek an alternative site if it cannot keep this one. A reason to check AirNow rather than a single station.
Bridgeport Against The Federal Standards
Every pollutant measured here meets its standard. 2025 values against the national ambient air quality standards:
Source: Connecticut DEEP, 2026 Draft Annual Air Monitoring Network Plan. Values are preliminary. Meeting a long-term standard does not mean every individual day is clean.
How To Read Today’s Bridgeport AQI Number
Source: U.S. EPA and AirNow, Air Quality Index Basics.
Source: EPA, AQI Basics. In 2024 the EPA lowered the annual PM2.5 standard from 12.0 to 9.0 micrograms per cubic meter and adjusted the breakpoints, so any chart still showing 12.0 as the edge of Good air is stale. Our AQI scale explainer covers that revision.
Bridgeport Air Quality Through The Year
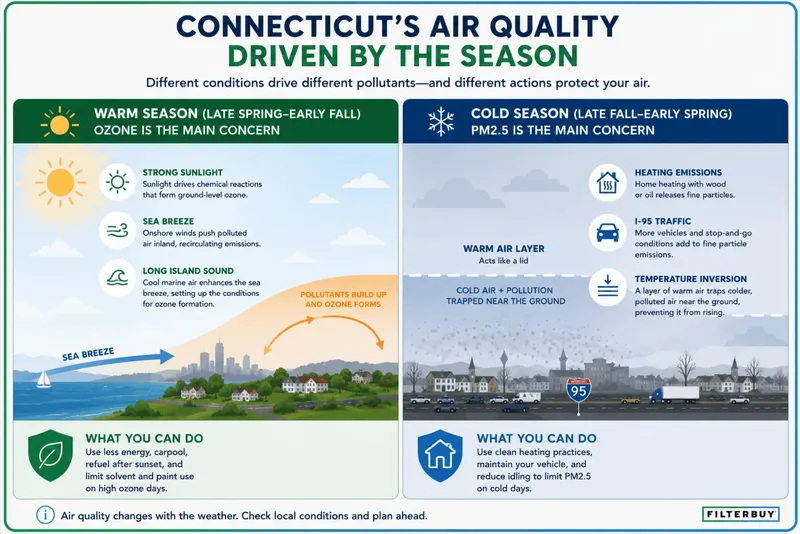
Source: Connecticut monitors ozone from March 1 through September 30. DEEP forecasts ozone from May 1 through September 30 and PM2.5 year-round.
During smoke episodes the AirNow Fire and Smoke Map responds faster than a standard AQI page, because it blends regulatory monitors with low-cost sensors. DEEP feeds that map and runs an air sensor loan program with roughly 70 PurpleAir sensors placed statewide.
How Filterbuy Checked This Page
Filterbuy’s editorial process changed the conclusions here.
We took the pollutant list from DEEP’s 2026 network plan, not the older site page. The old page lists carbon monoxide at Bridgeport. The plan does not.
That cross-check surfaced the missing ozone monitor. None of the live-widget pages we reviewed names the station.
Every source linked here was opened and read, not cited from a summary.
Supporting Statistics
Three agency findings behind this page, each linked to source.
1. Connecticut Children Reach The ER For Asthma At Twice The Adult Rate
Children: 69.9 asthma emergency department visits per 10,000 (2023)
Adults: 33.6 per 10,000
Connecticut children with asthma: 8.2 percent, against 6.2 percent nationally
Connecticut ranked 4th nationally for adult asthma prevalence (2022)
Bridgeport: Fairfield County’s F ozone grade lands on a population already carrying an above-average asthma burden.
Source: Connecticut Department of Public Health, Asthma Program
2. More Than 45 Million Americans Live Within 300 Feet Of A Major Road
Motor-vehicle pollutants are measurably concentrated inside that band
Highest risk: children, adults 65+, existing heart or lung disease
Bridgeport: the Roosevelt School monitor sits about 164 feet from I-95. The station and its neighborhoods are inside the band.
Source: EPA research on near-roadway air pollution
3. Indoor Levels Of Some Pollutants Run Two To Five Times Outdoor Levels
Time Americans spend indoors: roughly 90 percent
The most susceptible people spend even more time inside
Bridgeport: the AQI above measures outdoor air. Indoors is where your filter decides the outcome.
Source: EPA Report on the Environment, indoor air quality
What To Do Inside When Bridgeport’s AQI Climbs
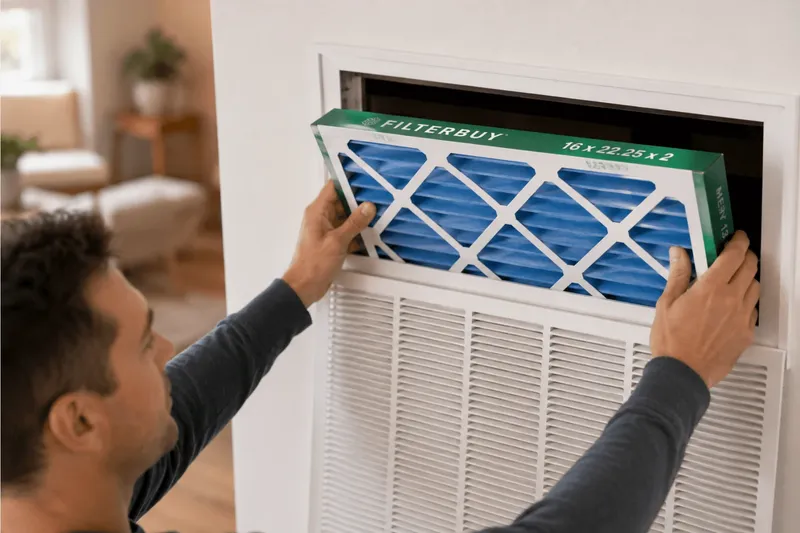
Outdoor air enters a Bridgeport home through windows, doors, envelope gaps, and the HVAC system. Your filter is the part of that path you control.
When The AQI Is 0 To 100
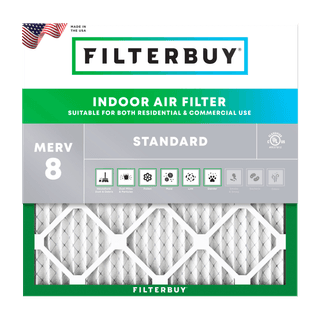
A MERV 8 filter handles routine dust, pollen, and lint. Just do not let it go overdue.
When The AQI Is 101 To 150
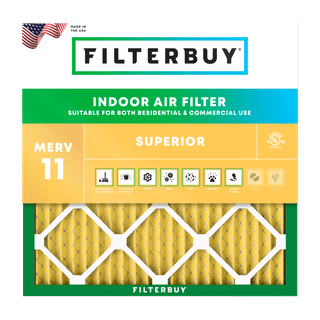
Close the windows and run the fan or recirculation setting. A MERV 11 filter captures more fine particles and is a sensible step up for moderate shoreline days.
When The AQI Is Above 150
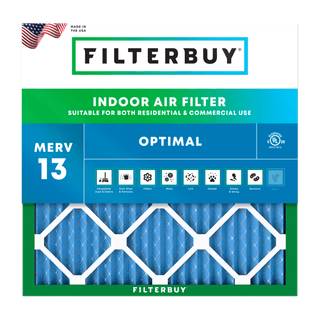
The EPA recommends upgrading to a filter rated MERV 13 or higher during smoke events and high particulate days, noting most residential systems can accommodate one if it is replaced frequently. A MERV 13 filter captures fine particulate matter including PM2.5. Two cautions: check your manual for a maximum MERV rating, and seat the filter fully, because air bypassing a loose edge is not filtered at all.
Ozone days call for a different response than smoke days. Pleated filters capture particles, not gases, so a MERV upgrade does little for ozone. On high-ozone afternoons the effective steps are closing windows, avoiding outdoor exertion from midday through early evening, and not adding indoor pollutants.
Expert Perspective
A pleated filter is a particle trap. Smoke is particles. Smog is gas. That distinction decides whether upgrading your filter does anything on a given day, and most people have never been told it.
David Heacock, Founder and CEO, Filterbuy
Frequently Asked Questions
Glossary Of Bridgeport Air Quality Terms
Air Quality Index (AQI). The EPA’s 0-to-500 scale for outdoor air quality and health risk, in six color-coded categories.
PM2.5. Fine particles 2.5 micrometers or smaller, small enough to reach deep into the lungs. From exhaust, heating, and smoke.
Ground-level ozone. The main component of smog, formed when sunlight reacts with emissions. A respiratory irritant peaking on hot afternoons.
MERV. Minimum Efficiency Reporting Value, the scale for how well a filter captures airborne particles. Higher numbers catch smaller particles.