Residents in These States Are Most Likely to Face Eviction or Foreclosure

Photo Credit: Alamy Stock Photo

By David Heacock

When the economy spiraled down into a recession in 2020, the nation’s unemployment rate skyrocketed to 14.8% in April. A total of 22 million jobs were lost between January and April.

Amid a foundering economy and the uncertainty of a pandemic, millions of laid-off workers had to face another stark reality: how would they pay rent? The housing bubble of 2008 brought to mind the possibility of millions of homeowners defaulting on their mortgages, compounding the sting of an already painful recession. Fortunately, the CARES Act helped divert what would undoubtedly be a flash flood of foreclosures and evictions by imposing moratorium provisions. Over time, those measures evolved and were extended (including through a recent Supreme Court decision to maintain a separate eviction moratorium issued by the Centers for Disease Control and Prevention), providing ongoing relief for homeowners and renters.

As a result, the number of foreclosures reached an all-time low, plunging to just 11,000 in Q1 2021, a figure that the Federal Reserve Bank of New York said was “by far the lowest number of foreclosures we have seen since the beginning of our series in 1999.” However, the decline in foreclosures didn’t tell the whole story. While foreclosure numbers remained at unprecedented low levels due to moratoriums, renters and homeowners fell further behind on payments, according to the U.S. Census Bureau’s new Household Pulse Survey.
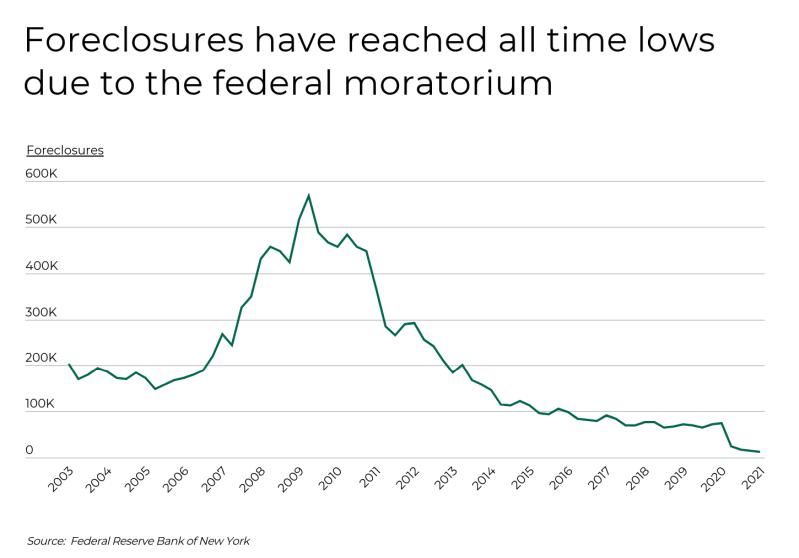
Infographic data of Foreclosure have reached time lows due to the federal moratorium/

Census data collected between August 2020 and June 2021 shows that at any given time, about 6.6% of Americans were behind on their housing payments; and of those, 32.4% felt they were at risk of foreclosure or eviction in the coming months. Notably, minority populations were at the greatest risk of both missing their housing payments and facing foreclosure or eviction. During that time period, 5.8% of non-Hispanic White adults reported falling behind on their rent or mortgage payments, compared to 12.0% of Asians, 14.4% of Hispanics, and 18.5% of Blacks.

Even with moratoriums in place, not all households met the criteria required to be eligible for such programs. Similar to payment status, non-Hispanic White and Asian residents were least likely to report eviction or foreclosure risk, while Hispanic and Black residents were the most likely.
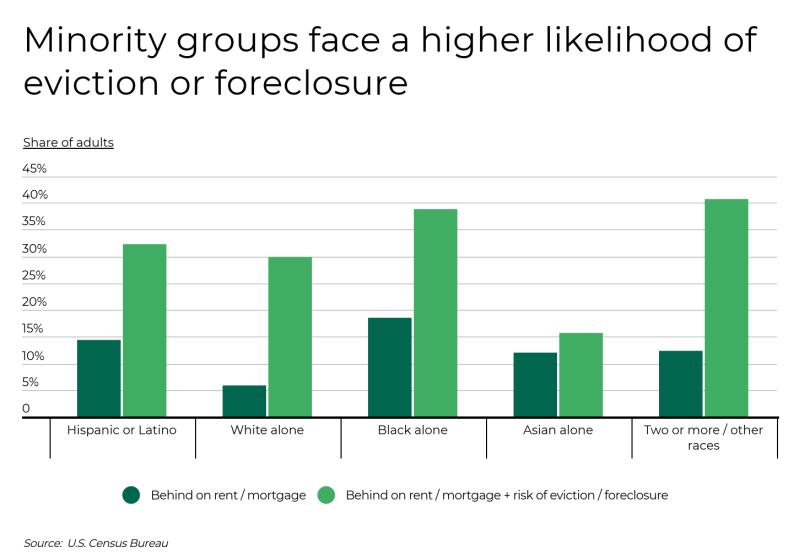
Minority groups face likelihood of eviction or foreclosure.

TRENDING
You can keep the air inside your home clean and healthy to breathe by replacing your home air filters every three to six months. For the best protection, consider Filterbuy’s MERV 13 air filters.

At the state level, residents in the South and Midwest reported the highest rates of foreclosure or eviction risk. Forty-one percent of adults in Louisiana who were behind on their housing payments also felt they were at risk of eviction or foreclosure, with those in Wyoming, Nevada, New Mexico, and Oklahoma close behind. All five states were at least five percentage points higher than the national rate of 32.4%.

Meanwhile, the Northeast fared the best among all regions. Seven of the 10 states with the lowest eviction or foreclosure risk were located in the Northeast, with Vermont leading the way with a nationwide low of 23.4%.

To determine the states where residents are most likely to face eviction or foreclosure, researchers at Filterbuy analyzed data from the U.S. Census Bureau’s Household Pulse Survey. The researchers calculated the percentage of adults living in households behind on their rent or mortgage where eviction or foreclosure in the coming months was likely. The statistics shown are averages from August 2020 through June of 2021. In the event of a tie, the state with the higher share of adults behind on their rent or mortgage payment was ranked higher.

Here are the states where residents are most likely to face eviction or foreclosure.

States Most Likely to Face Eviction or Foreclosure

  1. An image of collection of buildings with trees on the foreground.Photo Credit: Alamy Stock Photo

    Iowa

    • Share of adults behind on payments at risk of eviction/foreclosure: 35.1%
    • Share of adults behind on rent/mortgage payments: 4.7%
    • Total adults behind on payments at risk of eviction/foreclosure: 38,093
    • Total adults behind on rent/mortgage payments: 110,604
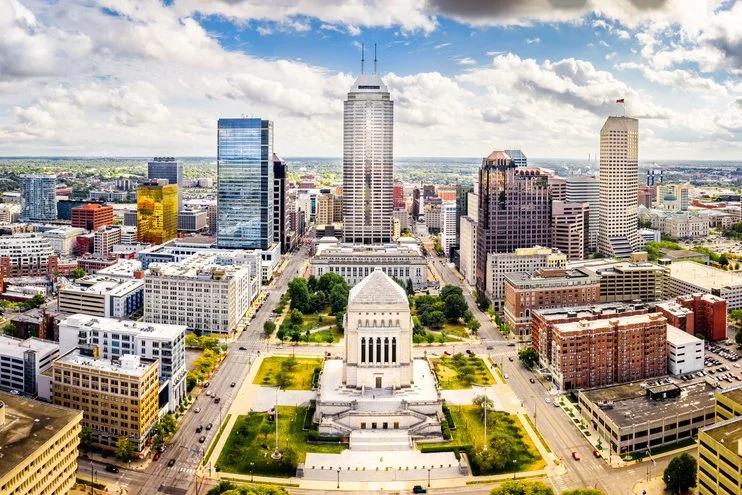
  2. An image featuring a river, a bridge leading to the tall buildings.Photo Credit: Alamy Stock Photo

    Ohio

    • Share of adults behind on payments at risk of eviction/foreclosure: 35.1%
    • Share of adults behind on rent/mortgage payments: 6.3%
    • Total adults behind on payments at risk of eviction/foreclosure: 200,969
    • Total adults behind on rent/mortgage payments: 558,584
  3. An aerial view of collection of buildings in the city.Photo Credit: Alamy Stock Photo

    Texas

    • Share of adults behind on payments at risk of eviction/foreclosure: 35.1%
    • Share of adults behind on rent/mortgage payments: 7.3%
    • Total adults behind on payments at risk of eviction/foreclosure: 555,763
    • Total adults behind on rent/mortgage payments: 1,557,612
  4. A park with trees sits in front of a group of buildings.Photo Credit: Alamy Stock Photo

    Indiana

    • Share of adults behind on payments at risk of eviction/foreclosure: 35.6%
    • Share of adults behind on rent/mortgage payments: 6.2%
    • Total adults behind on payments at risk of eviction/foreclosure: 109,025
    • Total adults behind on rent/mortgage payments: 309,783
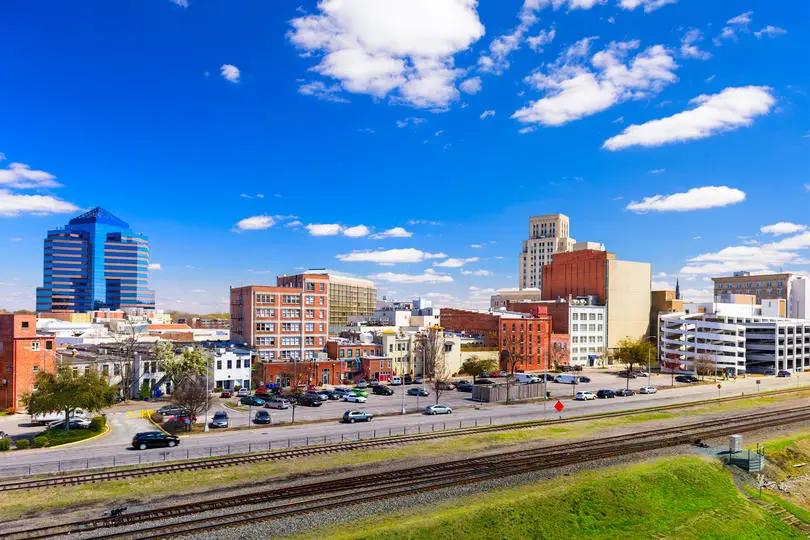
  5. An image of buildings in the background with cars parked in front. A green vacant area is in the foreground, and a clear blue sky is above.Photo Credit: Alamy Stock Photo

    North Carolina

    • Share of adults behind on payments at risk of eviction/foreclosure: 35.7%
    • Share of adults behind on rent/mortgage payments: 6.2%
    • Total adults behind on payments at risk of eviction/foreclosure: 177,934
    • Total adults behind on rent/mortgage payments: 499,571
  6. A park with lush greenery under a clear blue sky.Photo Credit: Alamy Stock Photo

    Nebraska

    • Share of adults behind on payments at risk of eviction/foreclosure: 35.9%
    • Share of adults behind on rent/mortgage payments: 4.5%
    • Total adults behind on payments at risk of eviction/foreclosure: 22,751
    • Total adults behind on rent/mortgage payments: 63,679
  7. An image of a city with trees, tall buildings and a tall tower.Photo Credit: Alamy Stock Photo

    Tennessee

    • Share of adults behind on payments at risk of eviction/foreclosure: 36.0%
    • Share of adults behind on rent/mortgage payments: 6.2%
    • Total adults behind on payments at risk of eviction/foreclosure: 114,266
    • Total adults behind on rent/mortgage payments: 323,852
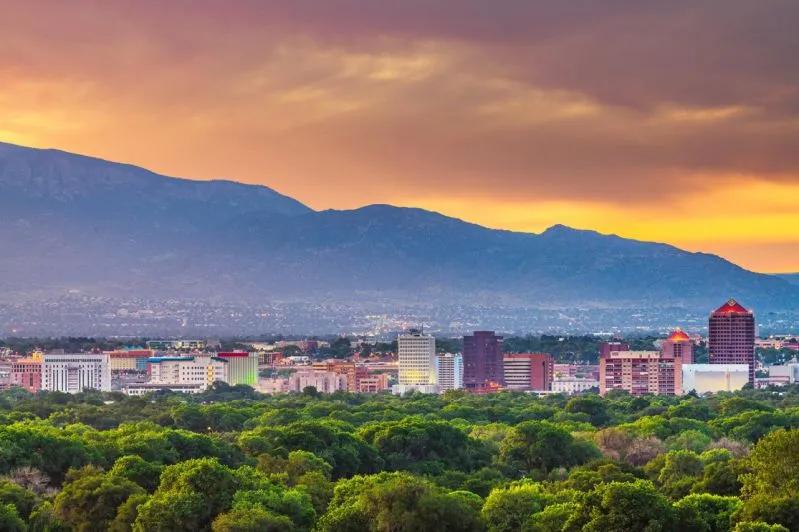
  8. A cityscape with trees in the foreground and mountains in the distance.Photo Credit: Alamy Stock Photo

    Oregon

    • Share of adults behind on payments at risk of eviction/foreclosure: 36.5%
    • Share of adults behind on rent/mortgage payments: 5.6%
    • Total adults behind on payments at risk of eviction/foreclosure: 69,410
    • Total adults behind on rent/mortgage payments: 185,556
  9. Buildings surrounded by trees, with clear sky above.Photo Credit: Alamy Stock Photo

    Mississippi

    • Share of adults behind on payments at risk of eviction/foreclosure: 37.0%
    • Share of adults behind on rent/mortgage payments: 7.4%
    • Total adults behind on payments at risk of eviction/foreclosure: 59,993
    • Total adults behind on rent/mortgage payments: 161,593
  10. A view of collection of buildings.Photo Credit: Alamy Stock Photo

    Georgia

    • Share of adults behind on payments at risk of eviction/foreclosure: 37.8%
    • Share of adults behind on rent/mortgage payments: 7.9%
    • Total adults behind on payments at risk of eviction/foreclosure: 244,102
    • Total adults behind on rent/mortgage payments: 629,117
  11. Buildings surrounded by trees, with a park in front.Photo Credit: Alamy Stock Photo

    Oklahoma

    • Share of adults behind on payments at risk of eviction/foreclosure: 37.8%
    • Share of adults behind on rent/mortgage payments: 6.3%
    • Total adults behind on payments at risk of eviction/foreclosure: 70,412
    • Total adults behind on rent/mortgage payments: 185,362
  12. A cityscape with trees in the foreground and mountains in the distance.Photo Credit: Alamy Stock Photo

    New Mexico

    • Share of adults behind on payments at risk of eviction/foreclosure: 38.0%
    • Share of adults behind on rent/mortgage payments: 6.7%
    • Total adults behind on payments at risk of eviction/foreclosure: 40,960
    • Total adults behind on rent/mortgage payments: 106,617
  13. Towering structures frame a grand fountain park, bustling with activity next to a busy road. The iconic Eiffel Tower stands majestically to the right.Photo Credit: Alamy Stock Photo

    Nevada

    • Share of adults behind on payments at risk of eviction/foreclosure: 38.9%
    • Share of adults behind on rent/mortgage payments: 8.3%
    • Total adults behind on payments at risk of eviction/foreclosure: 76,840
    • Total adults behind on rent/mortgage payments: 200,206
  14. A bird's-eye view of a quaint village nestled against a majestic mountain range.Photo Credit: Alamy Stock Photo

    Wyoming

    • Share of adults behind on payments at risk of eviction/foreclosure: 40.9%
    • Share of adults behind on rent/mortgage payments: 5.4%
    • Total adults behind on payments at risk of eviction/foreclosure: 9,877
    • Total adults behind on rent/mortgage payments: 23,627
  15. A lush green park contrasts with the towering skyscrapers beyond, all under a clear blue sky.Photo Credit: Alamy Stock Photo

    Louisiana

    • Share of adults behind on payments at risk of eviction/foreclosure: 41.0%
    • Share of adults behind on rent/mortgage payments: 7.8%
    • Total adults behind on payments at risk of eviction/foreclosure: 110,241
    • Total adults behind on rent/mortgage payments: 267,943

Detailed Findings & Methodology

The data used in this analysis is from the U.S. Census Bureau’s Household Pulse Survey. To determine the states where residents are most likely to face eviction or foreclosure, researchers calculated the percentage of adults living in households not current on their rent or mortgage where eviction or foreclosure in the next two months was self-reported to be either very likely or somewhat likely. The statistics shown are averages from August of 2020 through June of 2021. In the event of a tie, the state with the higher share of adults behind on their rent or mortgage payment was ranked higher.

 
Preloader