May 5, 2026

By David Heacock
While public attention on the environment has recently focused on the acceleration of global climate change, another important and closely related issue is air quality. Climate change and air pollution share many of the same causes, with reliance on fossil fuels for energy and transportation being a major contributor to both. And the two phenomena also impact and reinforce one another: climate-driven events like wildfires can increase the volume of air pollutants including particulate matter, while the emission of pollutants like ozone increases the atmosphere’s capacity to retain heat.
Air quality is a significant issue for both environmental and human health. In the environment, air pollution negatively affects soil and water quality through smog and acid rain, harming animals and plant life. The latter effects can have consequences for humans by disrupting crop yields and other sources of food, but air pollution also has direct effects on human health. High concentrations of pollutants like particulate matter, carbon monoxide, and nitrous oxides can contribute to health risks like asthma, emphysema, and cardiovascular disease.
Fortunately, while the effect of climate change remains a worrying trend for air quality, data from the Environmental Protection Agency shows that the concentration of air pollutants has shown a steep decline over the past few decades. Much of this decline can be attributed to stricter pollution regulations that were first created with the enactment of the Clean Air Act in the 1970s and amended in the 1990s. This legislation introduced restrictions on air pollution from major sources like industry, energy production, and vehicles. Since then, the concentration of major pollutants has dropped significantly, and in 2013, the concentration of every pollutant tracked by the EPA dropped below the levels established in the National Ambient Air Quality Standards for the first time.
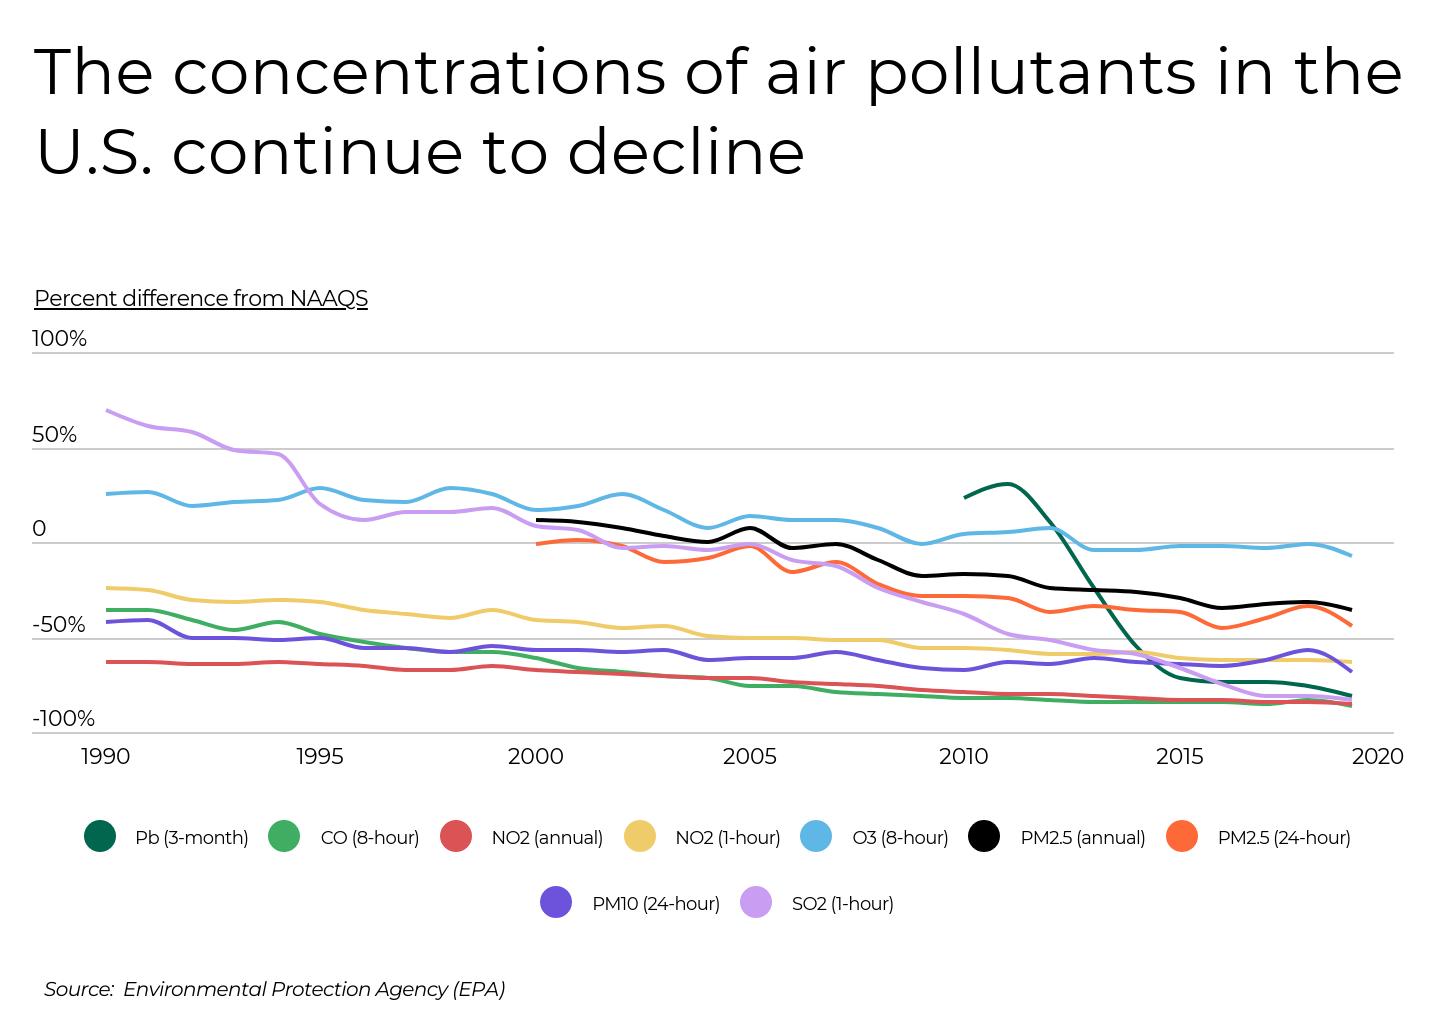
Recent evidence suggests that COVID-19 shutdowns in 2020 also had a positive but short-lived effect on air quality. When large parts of economic and social life worldwide halted at the beginning of the pandemic, there was a sharp drop-off in major sources of pollution like industrial production and vehicle usage. This meant that the atmosphere saw a temporary reduction in emissions of pollutants. A recent UN report estimated that concentrations of particulate matter dropped by as much as 40% in some parts of the world, though much of the benefit was wiped out by extreme weather events like dust storms and wildfires later in the year.
U.S. data also confirms that there were major changes in air quality in many parts of the country during the first year of the COVID-19 pandemic. Cities that had fewer people driving and less industrial activity saw lower levels of pollution. As a result, many cities across the country saw improvements in air quality, both in terms of Air Quality Index (AQI)—an overall assessment of air pollution levels—and in the number of days with good air quality based on AQI measurements.
RELATED Filterbuy’s MERV 13 air filters trap 98% of airborne particles, including mold, bacteria, and those that carry viruses. Keep the air in your home clean and safe, and replace your home air filters today.
To determine the locations with the biggest improvement in air quality during COVID-19, researchers at Filterbuy used data from the U.S. Environmental Protection Agency to calculate the percentage change in median AQI from 2019 to 2020. Locations with the larger decrease in median AQI were ranked higher. In the event of a tie, the median AQI for 2020 and 2019 were used, with lower values being ranked higher. Researchers also calculated the percentage of days each year in which the air quality was considered to be good, defined as having an AQI below 50.
Here are the cities with the biggest improvement in air quality during 2020.
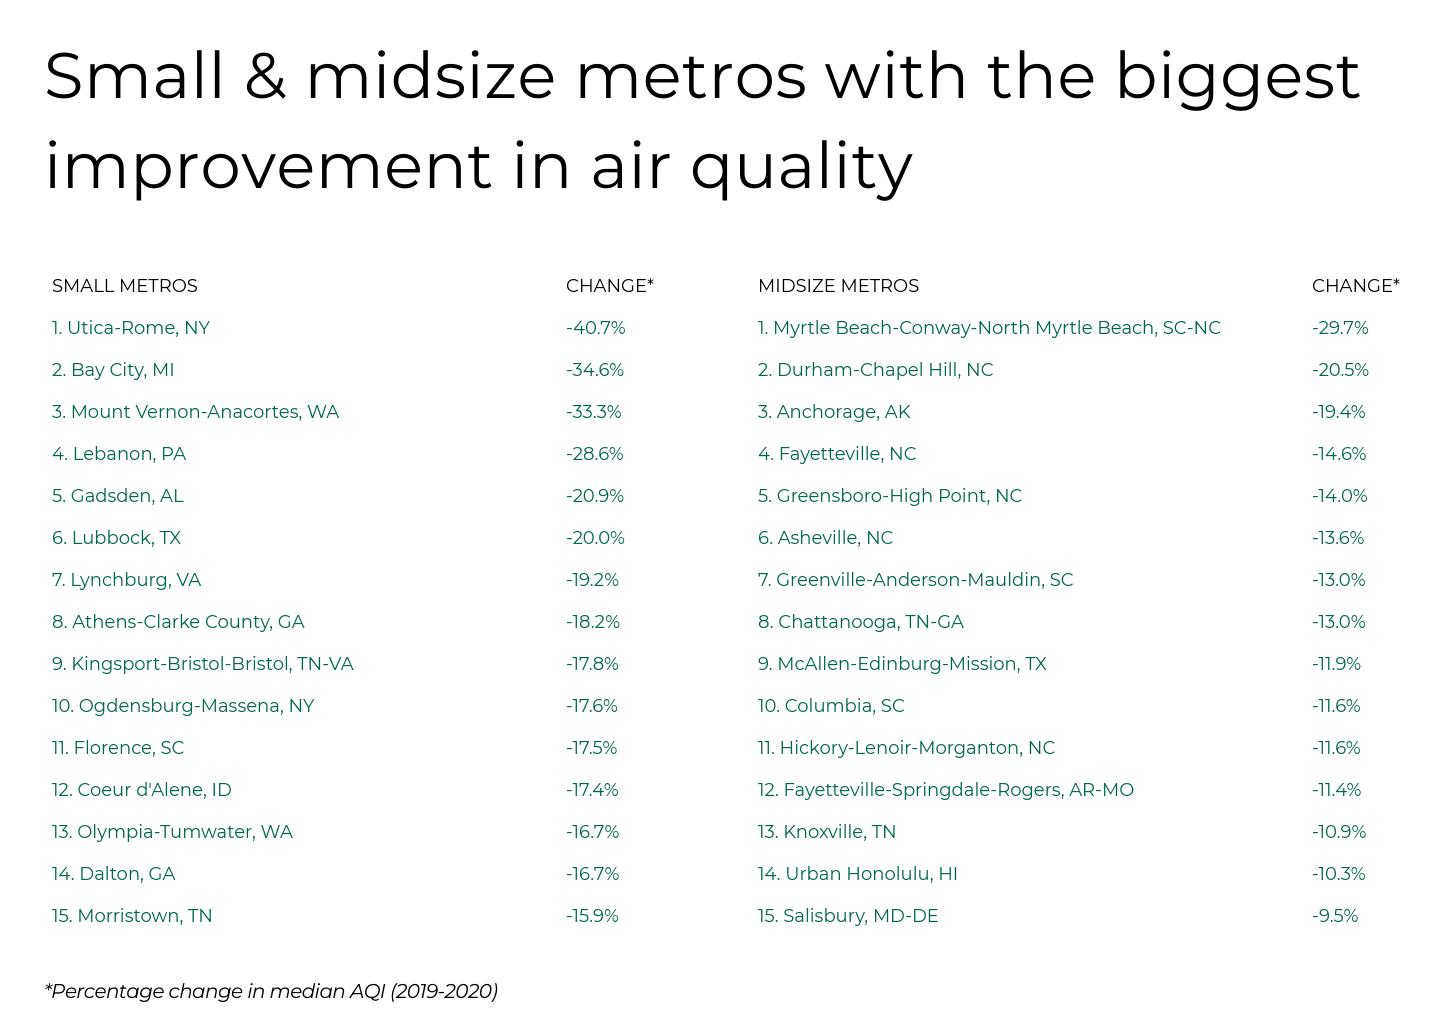

Photo Credit: Sean Pavone / Shutterstock
Percentage change in median AQI (2019-2020): -6.8%
Median AQI (2020): 41
Median AQI (2019): 44
Percentage of days with good air quality (2020): 69.1%
Percentage of days with good air quality (2019): 69.6%

Photo Credit: doma / Shutterstock
Percentage change in median AQI (2019-2020): -7.4%
Median AQI (2020): 50
Median AQI (2019): 54
Percentage of days with good air quality (2020): 53.0%
Percentage of days with good air quality (2019): 38.1%

Photo Credit: dibrova / Shutterstock
Percentage change in median AQI (2019-2020): -7.8%
Median AQI (2020): 47
Median AQI (2019): 51
Percentage of days with good air quality (2020): 60.4%
Percentage of days with good air quality (2019): 46.3%

Photo Credit: Sean Pavone / Shutterstock
Percentage change in median AQI (2019-2020): -8.5%
Median AQI (2020): 43
Median AQI (2019): 47
Percentage of days with good air quality (2020): 77.9%
Percentage of days with good air quality (2019): 57.3%

Photo Credit: Olivier Le Queinec / Shutterstock
Percentage change in median AQI (2019-2020): -8.7%
Median AQI (2020): 42
Median AQI (2019): 46
Percentage of days with good air quality (2020): 78.1%
Percentage of days with good air quality (2019): 61.1%

Photo Credit: Sean Pavone / Shutterstock
Percentage change in median AQI (2019-2020): -9.3%
Median AQI (2020): 49
Median AQI (2019): 54
Percentage of days with good air quality (2020): 51.9%
Percentage of days with good air quality (2019): 40.5%

Photo Credit: Sean Pavone / Shutterstock
Percentage change in median AQI (2019-2020): -9.4%
Median AQI (2020): 48
Median AQI (2019): 53
Percentage of days with good air quality (2020): 56.8%
Percentage of days with good air quality (2019): 41.1%
Photo Credit: Ivan Cholakov / Shutterstock
Percentage change in median AQI (2019-2020): -10.7%
Median AQI (2020): 50
Median AQI (2019): 56
Percentage of days with good air quality (2020): 51.4%
Percentage of days with good air quality (2019): 37.0%

Photo Credit: Zack Frank / Shutterstock
Percentage change in median AQI (2019-2020): -10.9%
Median AQI (2020): 41
Median AQI (2019): 46
Percentage of days with good air quality (2020): 79.8%
Percentage of days with good air quality (2019): 64.9%

Photo Credit: Sean Pavone / Shutterstock
Percentage change in median AQI (2019-2020): -12.5%
Median AQI (2020): 49
Median AQI (2019): 56
Percentage of days with good air quality (2020): 53.8%
Percentage of days with good air quality (2019): 35.3%

Photo Credit: Sean Pavone / Shutterstock
Percentage change in median AQI (2019-2020): -13.0%
Median AQI (2020): 40
Median AQI (2019): 46
Percentage of days with good air quality (2020): 77.5%
Percentage of days with good air quality (2019): 65.5%

Photo Credit: Sean Pavone / Shutterstock
Percentage change in median AQI (2019-2020): -13.6%
Median AQI (2020): 38
Median AQI (2019): 44
Percentage of days with good air quality (2020): 89.9%
Percentage of days with good air quality (2019): 74.5%

Photo Credit: Jon Bilous / Shutterstock
Percentage change in median AQI (2019-2020): -14.3%
Median AQI (2020): 42
Median AQI (2019): 49
Percentage of days with good air quality (2020): 77.0%
Percentage of days with good air quality (2019): 54.8%

Photo Credit: Alexandr Junek Imaging / Shutterstock
Percentage change in median AQI (2019-2020): -15.0%
Median AQI (2020): 34
Median AQI (2019): 40
Percentage of days with good air quality (2020): 94.8%
Percentage of days with good air quality (2019): 86.8%

Photo Credit: f11photo / Shutterstock
Percentage change in median AQI (2019-2020): -15.4%
Median AQI (2020): 44
Median AQI (2019): 52
Percentage of days with good air quality (2020): 65.8%
Percentage of days with good air quality (2019): 44.4%
The data used in this analysis is from the U.S. Environmental Protection Agency Air Data. To determine the locations with the biggest improvement in air quality during COVID, researchers calculated the percentage change in median AQI from 2019 to 2020. Locations with the larger decrease in median AQI were ranked higher. In the event of a tie, the median AQI for 2020 and 2019 were used, with lower values being ranked higher. Researchers also calculated the percentage of days each year in which the air quality was considered to be good, defined as having an AQI below 50.
To improve relevance, only metropolitan areas with at least 100,000 residents were included. Additionally, metros were grouped into cohorts based on population size: small (100,000–349,999), midsize (350,000–999,999), and large (1,000,000 or more).