
Rancho Cucamonga Real-Time AQI Tracker


Get Alerts For Unhealthy AQI In Your Area
When air quality in your area reaches unhealthy levels, we'll send you a quick alert, along with expert tips on how to reduce your exposure.
What's Actually In Rancho Cucamonga Air Today?
What High AQI Means for Your Lungs in Rancho Cucamonga
How to Read AQI
The Air Quality Index (AQI) measures how polluted the air is and how it may affect your health.
0–50 (Good): Air quality is satisfactory.
51–100 (Moderate): Acceptable, but some pollutants may pose minor concerns.
101–150 (Unhealthy for Sensitive Groups)
151–200 (Unhealthy)
201–300 (Very Unhealthy)
301+ (Hazardous)
Moderate
Still okay for most, but if you have asthma or allergies, take it easy and avoid long outdoor workouts.
Shop MERV 11 filters→What's the Right Filter for Your AQI Level?


Check Today's Live Real Time Air Quality Index AQI Map in Rancho Cucamonga, CA Now
Author: Michelle Wan, Brand Manager and Air Quality Writer, Filterbuy · Reviewed By: David Clark, Licensed HVAC Technician · Published: July 31, 2026 · Updated: July 31, 2026
TL;DR
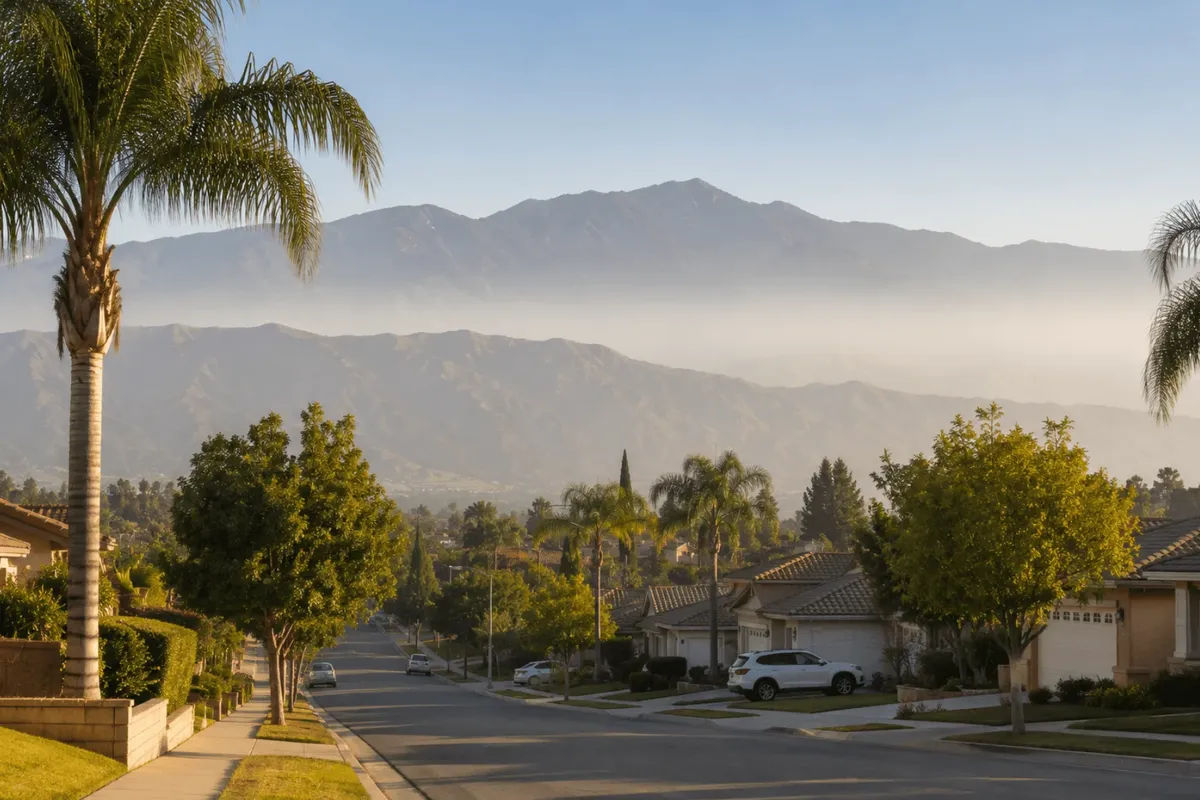
The air quality index in Rancho Cucamonga changes hour by hour, and the live map on this page shows the city’s current AQI reading. Rancho Cucamonga typically runs from Good to Moderate, with summer afternoons pushing ozone higher because the San Gabriel Mountains hold smog against the foothills. Santa Ana wind events can raise smoke and dust within hours. Filterbuy, a U.S. air filter manufacturer producing pleated filters domestically since 2013, publishes this page and the tracker above.
Key Takeaways
Rancho Cucamonga sits in South Coast AQMD forecast subregion 32, Northwest San Bernardino Valley, which covers the western foothill communities.
Ozone drives most high-AQI days here, and it peaks in the afternoon between roughly May and October.
Fine particles, labeled PM2.5, drive the sharpest spikes, and those arrive with wildfire smoke or Santa Ana dust rather than on a schedule.
San Bernardino County recorded the highest county total of unhealthy ozone days in the nation in the American Lung Association 2026 State of the Air report.
MERV 13 captures fine particulate matter including smoke, and the EPA recommends it during smoke events for compatible systems. Filterbuy manufactures MERV 8, 11, and 13 pleated filters in more than 600 sizes.
Our Air Quality Writer On Reading The Number
I pull AQI readings for cities across the country every morning, and Rancho Cucamonga is one where the number alone will steer you wrong. A reading of 130 here in July is usually ozone, meaning a rough afternoon and a normal evening. The same 130 in October with a Santa Ana blowing is smoke, meaning a rough week and a filter that will not survive the month. Same number on the screen, two different plans for your household.
Michelle Wan, Brand Manager and Air Quality Writer, Filterbuy
What’s Actually In Rancho Cucamonga Air Today?
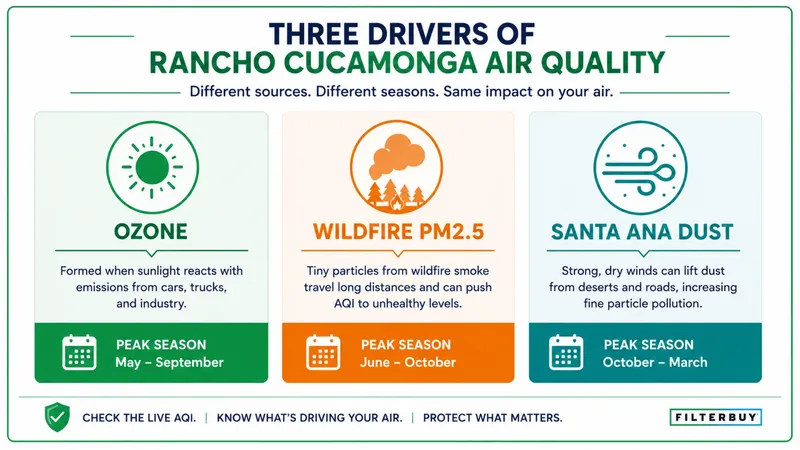
Rancho Cucamonga air carries three distinct pollutants, and the AQI number only reports whichever is worst right now. That single-number design is why we built this section instead of stopping at the live map. Ground-level ozone dominates warm afternoons, fine particulate matter dominates smoke and haze events, and coarse dust spikes during high wind. Read the number without knowing which pollutant produced it and you will take the wrong action about half the year.
Ozone forms when tailpipe and industrial emissions react in sunlight, so it builds through the afternoon and fades after sunset. Rancho Cucamonga collects more of it than coastal cities because onshore wind carries the Los Angeles basin’s emissions inland all day and the San Gabriel Mountains stop that air at the foothills. Freight traffic on Interstate 15, Interstate 10, and the warehouse corridor adds diesel year-round. Our explainer on why air quality goes bad on a given day covers how these sources interact.
Particle pollution behaves differently. It arrives suddenly and comes from fires and wind rather than from the afternoon sun. The city’s northern boundary along Alta Loma and Etiwanda borders a Very High Fire Hazard Severity Zone, with a record that includes the 2003 Grand Prix Fire, the 2014 Etiwanda Fire, and the 2020 Thorpe Fire. Smoke particles also behave differently inside the body. One Southern California study of wildfire-specific PM2.5 found respiratory hospitalizations rising 1.3 to 10 percent per 10 micrograms per cubic meter, against 0.67 to 1.3 percent for PM2.5 from other sources. During an active fire the California wildfire and smoke tracker shows plume direction, and our guide to how to read a wildfire smoke map explains it.
Table 1: Three Drivers Of Rancho Cucamonga Air Quality
Peak seasons reflect typical Inland Empire patterns. Check the live AQI reading on this page for current conditions.
Why A Higher MERV Filter Will Not Fix An Ozone Day
Here is the thing most air quality pages will not tell you, and it matters more in Rancho Cucamonga than in almost any other city we cover. MERV measures how well a filter captures particles. Ozone is not a particle. It is a gas. When the AQI here hits 150 on a hot July afternoon, the pollutant behind that number is ozone, and swapping in a higher-MERV filter does very little about it. You still want a good filter. You just want to know which kind of day you are having before you decide what it can do for you.
On An Ozone Day, Roughly May Through October
Keep windows closed, run the air conditioner, and move exercise to early morning before ozone builds
Filtration is not the lever here. Exposure timing is
Consider activated carbon filtration, which uses a sorbent rather than a particle media, if gases and odors are a standing concern
On A Particle Day, Meaning Wildfire Smoke Or Santa Ana Dust
This is where MERV 13 earns its place. Close windows, run the fan continuously, and use recirculate if your system has it
Check the filter weekly rather than monthly
We would rather tell you when our product is not the answer than sell a filter for a problem it cannot solve. It is why our resource library covers gas-phase pollutants at all. EPA’s guide to air cleaners in the home sets out the same particle-versus-gas distinction.
Table 2: AQI Action Guide By Pollutant
Ozone is a gas and MERV rates particle capture, so a higher MERV filter does little on an ozone day. Confirm your system accepts a higher MERV rating before upgrading.
What High AQI Means For Your Lungs In Rancho Cucamonga
A rising AQI reading here means the air is carrying enough pollution to irritate airways, and the people who feel it first are children, adults over 65, and anyone managing asthma, COPD, or heart disease. Ozone inflames the lining of the airways. Fine particles travel deeper, reaching the lower lungs and sometimes the bloodstream.
Between 51 and 100, most people notice nothing while sensitive individuals may shorten a hard workout. Above 100 the category becomes Unhealthy for Sensitive Groups, the point to move exercise indoors or to early morning. Above 150, everyone should limit time outside.
This is not a small slice of the city. Per the Census Bureau QuickFacts profile for Rancho Cucamonga, 22.5 percent of residents are under 18 and 14.5 percent are 65 or older, which covers the two groups that respond first.
Where Rancho Cucamonga’s Live AQI Reading Actually Comes From
Most air quality pages show you a number and move on. We built this section because here the answer changes how much weight the number deserves. Rancho Cucamonga appears to have no regulatory air monitor inside city limits. The reading is contoured from nearby South Coast AQMD stations across the Northwest San Bernardino Valley subregion. That is standard practice and gives a sound regional picture, but it is not a street-level measurement, and no widget on the first page of results will tell you that.
To find out which pollutant is driving today’s number, South Coast AQMD publishes current readings by air monitoring subregion, broken out by pollutant, so you can tell an ozone afternoon from a smoke event.
One more wrinkle. The AQMD site at Upland, the station that had characterized foothill ozone and particulates closest to this city, closed in March 2023 after a lease ended. In its July 2025 monitoring network plan appendix, the district asked the EPA to approve discontinuing measurement there and stated that it is actively seeking a replacement site to maintain foothill ozone coverage.
Trust the number as a regional signal and your own senses for the last mile. If you can smell smoke while the map reads Moderate, your nose is the more current instrument. Filterbuy would rather publish that caveat than imply the map is perfect.
Table 3: Where Rancho Cucamonga Air Quality Data Comes From
Rancho Cucamonga has no regulatory monitor inside city limits, so city-level readings are contoured from surrounding stations.
How To Protect Your Indoor Air When Rancho Cucamonga AQI Rises
Indoor air is where a household actually controls exposure. When a particle event pushes the reading up, close the windows, set the system fan to run continuously, and make sure the filter can capture what is outside. EPA guidance on wildfires and indoor air quality sets out the same sequence.
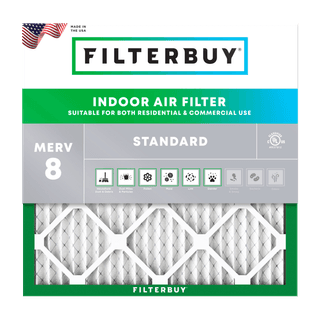
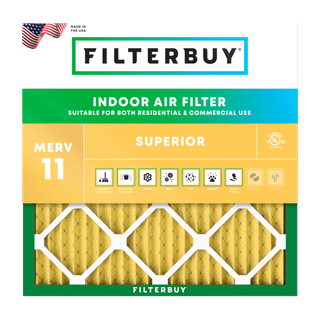
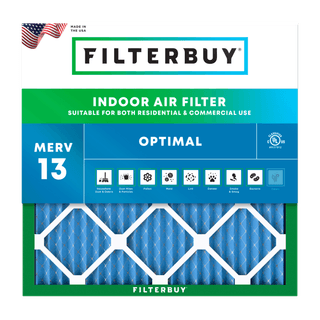
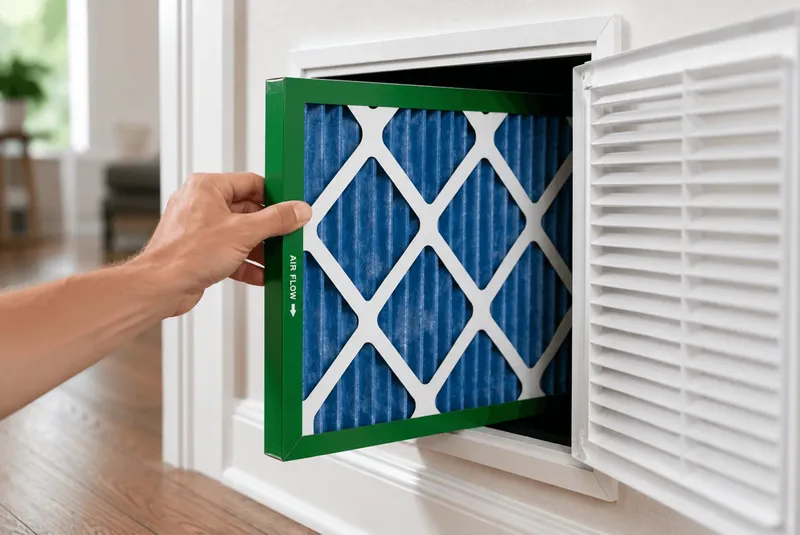
Filter selection tracks the pollutant, and this is the part we can speak to directly. Our manufacturing team builds pleated filters across factories in Alabama, Florida, Pennsylvania, and Utah, so our guidance reflects how those filters perform in real homes rather than a spec sheet. For ordinary Good to Moderate days, MERV 8 pleated filters handle dust, pollen, and lint. For the stretch between Moderate and Unhealthy this city sees through summer, MERV 11 filters add finer dust and pet dander. When smoke is in the air, MERV 13 air filters capture fine particulate matter. Our breakdown of which MERV rating to use on high-AQI days maps each tier to a capture efficiency.
Two honest limits. MERV 13 is not HEPA, and it reduces indoor particulate exposure rather than eliminating it. Filters also load faster in smoke and dust season, which is why our guidance on how often to change a filter when the AQI is high shifts the interval from 60 to 90 days down to 30 to 45. For non-standard returns, common in older Rancho Cucamonga homes, Filterbuy.com makes custom filter sizes.
Rather than checking every morning, use the unhealthy-AQI alert signup above. Filterbuy notifies you when your ZIP code crosses into unhealthy territory. Our live wildfire and smoke map covers conditions nationwide, our California statewide air quality index page tracks readings statewide, and our roundup of U.S. cities with the worst and best air quality shows where the Inland Empire ranks.
Expert Perspective
After manufacturing filters for over a decade and serving more than two million households, the pattern we see on the Inland Empire foothill side is consistent. Filters that carry a ninety-day label do not last ninety days here through ozone season. Check yours monthly from June through October and replace on what you see, not on the calendar.
David Clark, Licensed HVAC Technician
What This Page Cannot Tell You
Whether the air on your street matches the regional reading, since the nearest regulatory monitors sit miles away
Whether your specific HVAC system can handle MERV 13 without an airflow penalty
Anything about your personal health risk, which is a conversation for your doctor
Frequently Asked Questions
Seven Trusted Sources To Verify Rancho Cucamonga Air Quality Yourself
Every source below is a primary government or nonprofit source, cited at the article level, so you can confirm anything on this page yourself.
Decode Any AQI Number In Under A Minute
AirNow, the federal air quality reporting site run by the U.S. Environmental Protection Agency, explains the 0 to 500 scale and all six health categories.
Best For: Interpreting today’s number
Source: https://www.airnow.gov/aqi/aqi-basics/
Learn What PM2.5 And PM10 Actually Do Inside Your Lungs
The EPA defines both particle sizes and explains why particles under 2.5 micrometers travel deepest into the respiratory system.
Best For: Understanding particle pollution
Source: https://www.epa.gov/pm-pollution/particulate-matter-pm-basics
Follow The Regional Playbook When Smoke Reaches The Basin
South Coast AQMD, the air pollution control agency covering Rancho Cucamonga, publishes step-by-step guidance for smoke and ash events. Bookmark it before fire season rather than during one.
Best For: Local smoke episode response
Source: https://www.aqmd.gov/home/air-quality/wildfire-health-info-smoke-tips
Protect Children And Anyone With Asthma During A Smoke Event
The Centers for Disease Control and Prevention lists the exposure-reduction steps that matter most for children, older adults, and people managing chronic conditions, and clarifies which masks help.
Best For: Households with sensitive members
Source: https://www.cdc.gov/wildfires/safety/how-to-safely-stay-safe-during-a-wildfire.html
Understand Why Santa Ana Winds Change Your Air Overnight
The National Weather Service explains how dry offshore desert winds form and why they run September through May. Rancho Cucamonga sits downwind of the passes that funnel them.
Best For: Anticipating wind-driven dust and fire weather
Source: https://www.weather.gov/safety/wind-mountain-valley
Build A Wildfire Plan Before Evacuation Becomes Urgent
Ready.gov covers evacuation routes and go-bag contents, plus how to keep a household in contact if you have to leave. Most relevant along the Alta Loma and Etiwanda wildland-urban interface.
Best For: Foothill households in the fire hazard zone
Source: https://www.ready.gov/wildfires
Cut Indoor Triggers If Someone In Your Home Has Asthma
The Asthma and Allergy Foundation of America covers ventilation and filtration, plus keeping humidity where dust mites and mold do not thrive, and explains why indoor air can be worse than outdoor air.
Best For: Year-round indoor air management
Source: https://aafa.org/asthma/asthma-triggers-causes/air-pollution-smog-asthma/indoor-air-quality/
Supporting Statistics: What The Data Shows For Rancho Cucamonga Air
All three figures come from government sources, and they point the same direction. Most days here are Moderate, ozone is the structural problem, and smoke is the variable.
1. 57 Percent Of Days Were Moderate In 2025
San Bernardino County spent more than half of 2025 in the Moderate band
Median AQI improved to 77, down from a ten-year high of 93 in 2020
Fewer Unhealthy for Sensitive Groups days since 2016, and more Good days
Supports: Rancho Cucamonga runs Good to Moderate, with summer spikes
Source: https://indicators.sbcounty.gov/environment/air-quality/
2. Extreme Ozone Rating Applies Across Four Federal Standards
EPA classifies the South Coast Air Basin as Extreme nonattainment for ozone
Covers the 1-hour standard plus the 1997, 2008, and 2015 8-hour standards
Extreme is the highest of five severity levels under the Clean Air Act
The basin includes southwestern San Bernardino County and Rancho Cucamonga
Supports: Ozone is the structural driver of high-AQI days here
3. 77,850 Wildfires Burned 5.1 Million Acres In 2025
5,131,474 acres burned nationally
18,385 structures destroyed
Southern California led the nation in structures destroyed
Supports: Smoke is a live risk on the Alta Loma and Etiwanda foothill edge
Glossary
AQI (Air Quality Index): The EPA scale from 0 to 500 that reports how polluted outdoor air is and what health effects to expect, divided into six color-coded categories.
PM2.5: Fine particulate matter 2.5 micrometers in diameter or smaller, small enough to reach deep into the lungs. It is the main component of wildfire smoke.
Ground-Level Ozone: A corrosive gas formed when nitrogen oxides and volatile organic compounds react in sunlight. It is the main ingredient of smog and the leading cause of high-AQI days in Rancho Cucamonga.
MERV: Minimum Efficiency Reporting Value, the 1 to 16 scale rating how effectively a filter captures particles of given sizes. It measures particle capture only, not gases.