
Port St Lucie Real-Time AQI Tracker


Get Alerts For Unhealthy AQI In Your Area
When air quality in your area reaches unhealthy levels, we'll send you a quick alert, along with expert tips on how to reduce your exposure.
What's Actually In Port St Lucie Air Today?
What High AQI Means for Your Lungs in Port St Lucie
How to Read AQI
The Air Quality Index (AQI) measures how polluted the air is and how it may affect your health.
0–50 (Good): Air quality is satisfactory.
51–100 (Moderate): Acceptable, but some pollutants may pose minor concerns.
101–150 (Unhealthy for Sensitive Groups)
151–200 (Unhealthy)
201–300 (Very Unhealthy)
301+ (Hazardous)
Moderate
Still okay for most, but if you have asthma or allergies, take it easy and avoid long outdoor workouts.
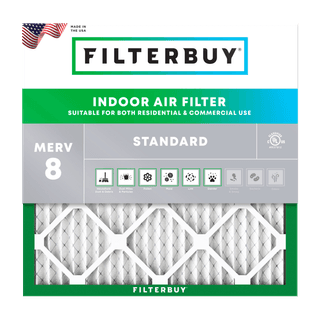
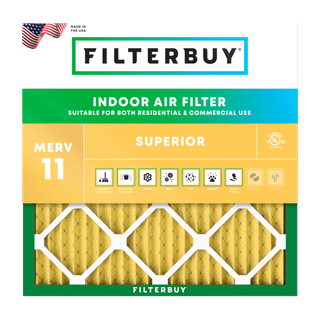
Shop MERV 11 filters→What's the Right Filter for Your AQI Level?


Check Today's Live Real Time Air Quality Index AQI Map in Port St. Lucie, FL Now
By Michelle Wan. Reviewed by David Clark, Licensed HVAC Technician. Published July 31, 2026. Updated July 31, 2026.
TL;DR
Port St. Lucie's air quality is Good (AQI 0–50) on most days of the year, with Moderate (51–100) readings showing up on hot, still afternoons and during summer Saharan dust events. The live Filterbuy air quality map above shows the current number and the pollutant driving it. One thing worth knowing: St. Lucie County operates a single regulatory air monitor, and it measures ozone only, so the PM2.5 figure most apps show for Port St. Lucie is a modeled estimate rather than a local measurement.
What Is the Air Quality in Port St. Lucie Today?
Today's Port St. Lucie air quality reads live from the Filterbuy map at the top of this page. Port St. Lucie typically records AQI in the Good range, at or below 50. Moderate readings show up on hot afternoons and through Saharan dust season, or when regional smoke drifts in. Check the number and the dominant pollutant before extended outdoor time.
Key Takeaways
St. Lucie County has one regulatory air monitor: the Savannahs site in Fort Pierce (AQS ID 12-111-0013), and it measures ozone only, according to the Florida DEP's St. Lucie County air monitoring record.
No regulatory PM2.5 monitor operates in St. Lucie County, so fine-particle readings labeled "Port St. Lucie" are modeled from satellite data and nearby stations. IQAir labels its value as modeled.
The Miami–Fort Lauderdale–Port St. Lucie region earned a C for ozone and a C for short-term particle pollution in the American Lung Association "State of the Air" report card for 2022–2024. Those grades are set by Miami-Dade and Broward, over 100 miles south.
The EPA tightened the AQI's PM2.5 scale on May 6, 2024. "Good" now tops out at 9.0 micrograms per cubic meter instead of 12.0, so older charts read incorrectly. See the current EPA AQI categories on AirNow.
Ozone and PM2.5 call for opposite responses. An HVAC filter meaningfully reduces indoor fine particles (PM2.5). It does not remove ozone.
Why We Built This Page the Way We Did
Filterbuy manufactures air filters in the United States, including at a Florida facility, and our sister company Filterbuy HVAC Solutions runs service branches across Florida, including the Treasure Coast region that Port St. Lucie sits in. That matters for what follows. We see the filters customers send back and the equipment they came out of, in this climate, so this page separates what a filter actually fixes from what it does not rather than treating every high reading as a reason to sell you something.
Where Port St. Lucie's Air Quality Numbers Actually Come From
Most air quality apps will hand you a confident number for Port St. Lucie. Fewer will tell you where it came from. The Florida Department of Environmental Protection lists exactly one ambient monitor for St. Lucie County, the Savannahs site in neighboring Fort Pierce, AQS ID 12-111-0013, and that station measures ground-level ozone and nothing else. St. Lucie is not unusual in that. Research published in GeoHealth in July 2026 found that nearly 80 percent of U.S. counties have no ground-based PM2.5 monitor, leaving about 30 percent of the population unmonitored for fine particles.
That has a practical consequence. Ozone numbers for the Port St. Lucie area are ground truth, measured by a regulatory-grade instrument a short drive up US-1 and reported through EPA's AirNow. Fine-particle numbers are estimates. They come from satellite retrievals and atmospheric models, blended with monitors sitting in other counties. IQAir marks its Port St. Lucie reading as modeled from satellite data. Weather Underground draws its figure from the Copernicus Atmosphere Monitoring Service.
The estimates are still useful. Modeled PM2.5 catches regional events well, a dust plume or a smoke layer, because those cover hundreds of miles at once. It is far weaker on what happens at street level: a neighbor's yard burn, or the difference between St. Lucie West and a home near the river.
The first thing I check on any city page is where the number came from. In St. Lucie County there is one regulatory monitor and it reads ozone only, so the PM2.5 figure on your phone is a model’s best estimate, not a measurement from your street. That does not make it useless. It makes it a starting point rather than a verdict.
Michelle Wan, Brand Manager and Air Quality Writer, Filterbuy
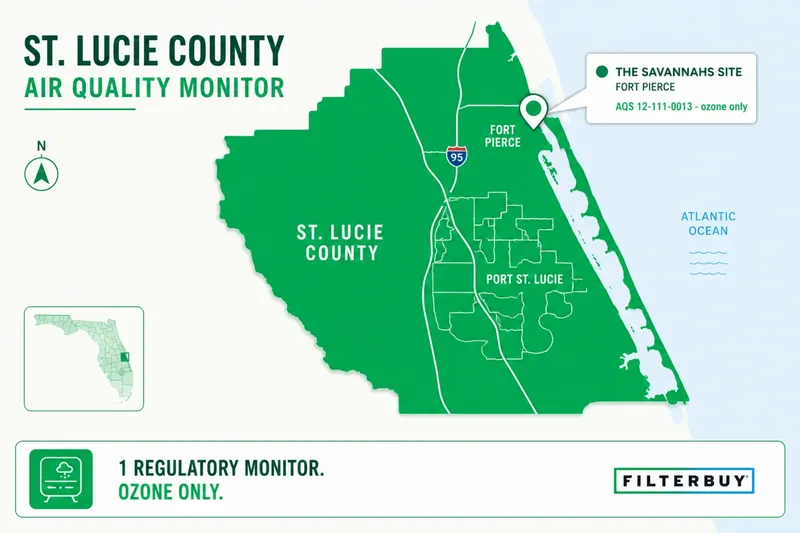
No PM2.5 Monitor in Your County? Here Is the Nearest One That Has One.
The closest regulatory PM2.5 monitor to Port St. Lucie sits in Stuart, just across the Martin County line. Florida DEP operates that site at 950 SE Monterey Road (AQS ID 12-085-0007), and unlike the Savannahs station it measures ozone, PM2.5, and PM10. For a regional event, a dust plume or a smoke layer that covers hundreds of miles, that reading is a far better proxy for Port St. Lucie than a satellite estimate.
Use it this way:
Regional haze, dust, or smoke: the Stuart monitor is a reasonable stand-in for Port St. Lucie.
Something local, like a yard burn or nearby construction: Stuart will miss it. Trust your eyes and nose.
Ozone: the Savannahs site in Fort Pierce is closer and measures it directly.
Both sites report live through Florida DEP's Air Quality Today, and both feed the Filterbuy map at the top of this page. Statewide, Florida runs 31 continuous PM2.5 monitors across 37 of its 67 counties, so this workaround applies to most of the state, not just here. DEP also publishes guidance on portable air pollution sensors if you want a reading from your own street.
What Drives Port St. Lucie's Air Quality, Month by Month
Port St. Lucie sits on Florida's Treasure Coast, between the Atlantic and the agricultural interior, and its air quality follows a seasonal rhythm most national AQI pages never mention.
Seasonal windows per NOAA (Saharan Air Layer), UF/IFAS (sugarcane harvest), and Florida DEP (ozone monitoring).
NOAA's Atlantic Oceanographic and Meteorological Laboratory reports that Saharan Air Layer activity ramps up in mid-June and peaks from late June through mid-August, with fresh outbreaks arriving every three to five days. NOAA also notes the layer typically sits in a 2 to 2.5-mile-thick band with its base about a mile above the surface, so a dramatic sky does not always mean a dramatic surface reading. Trust the number, not the sunset.
Sugarcane in the Everglades Agricultural Area is harvested from October through April or May, per UF/IFAS, and pre-harvest burning follows that window across roughly 400,000 acres. The Florida Forest Service ties those burn permits to wind direction and speed, and denies them when smoke is projected to reach populated coastal communities, which is why Port St. Lucie sees far less of that smoke than towns near Lake Okeechobee do. For active fire and smoke tracking in South Florida, see the live South Florida wildfire and smoke map.
The Two-Number Rule: Read the AQI and the Pollutant
Read two things on the map, not one: the AQI value and the dominant pollutant. In Port St. Lucie those two pollutants call for genuinely different responses, and treating them the same is the mistake we field most often from Florida customers.
If ozone is driving the number, it is a timing and exertion problem. Ozone forms in sunlight and peaks mid-afternoon, then falls after sunset. Move the run or the yard work to early morning. Closing the house helps, since ozone breaks down quickly on indoor surfaces. An HVAC filter does not remove ozone. We would rather tell you that than sell you something that does not solve your problem.
Homeowners call us in July convinced a better filter will fix the haze. If ozone is driving the number, nothing in our catalog changes it. What a filter does change is the particle load coming in through the return, and in Florida that load is heavy enough that I tell customers to check the filter monthly instead of trusting the date printed on the box.
David Clark, Licensed HVAC Technician
If PM2.5 is driving the number, it is an infiltration problem, and this is where filtration earns its keep. Fine particles enter through gaps, doors, and normal ventilation, then circulate through your HVAC system. The EPA notes indoor concentrations of some pollutants run two to five times higher than outdoor levels. On those days, close the windows, set the HVAC fan to "on" rather than "auto," and make sure the filter in the return is clean and rated for fine particles. If the categories on the map are new to you, start with what a good AQI is and the AQI color chart.
What to Do at Each AQI Level in Port St. Lucie
Categories and colors follow the U.S. EPA Air Quality Index. PM2.5 breakpoints were updated May 6, 2024.
Which Filter Actually Matches Port St. Lucie's Air
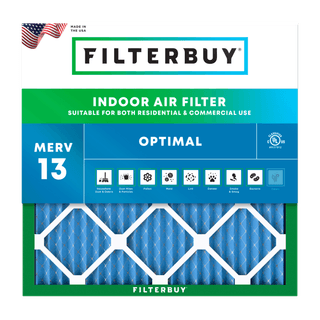
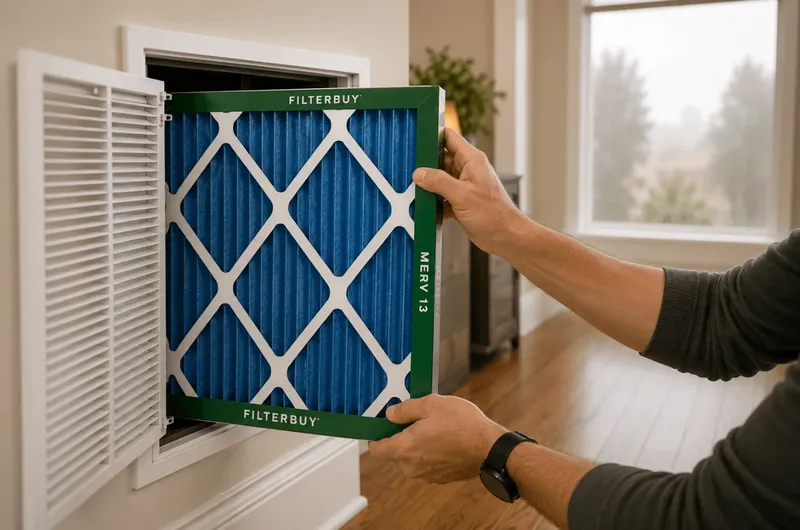
Port St. Lucie's particle load is seasonal rather than constant, which points to a straightforward setup: a good everyday filter, changed on schedule, plus a higher-efficiency filter on the shelf for dust and smoke season. The EPA's MERV reference puts MERV 13 at a minimum of 50 percent capture for particles 0.3 to 1.0 microns and 85 percent for 1.0 to 3.0 microns, the range that matters for dust and smoke. Compare ratings in our MERV rating guide for high AQI days.
The EPA recommends MERV 13, or the highest rating a system safely accommodates, during smoke events.
Here is what we see from the manufacturing side that a national guide will not tell you: filters in Florida load faster than a standard replacement schedule assumes. Tracking our own customer replacement cycles across Florida households, we find homes in this state need filter changes roughly 20 to 30 percent more often during high-AQI seasons. A 90-day filter in Port St. Lucie often behaves like a 60-day filter. Watch the filter, not just the calendar. Shop MERV 8, MERV 11, or MERV 13 air filters from Filterbuy, made in the USA and shipped factory-direct, or set up auto-delivery so the swap never gets missed.
Frequently Asked Questions
Supporting Statistics
Three findings behind the guidance on this page.
1. 80% of U.S. Counties Have No Ground-Based PM2.5 Monitor
Finding from two peer-reviewed GeoHealth studies published July 7, 2026.
Authors: University of Wisconsin-Madison, Washington University in St. Louis, and the American Lung Association. NASA-funded.
About 30% of the U.S. population is unmonitored for fine particle pollution.
St. Lucie County sits in that gap. Its PM2.5 number is modeled, not measured.
Source: American Lung Association, GeoHealth research, July 2026
2. 1 in 8 Florida Adults Has Asthma. 1 in 5 Florida Children Do.
Reported by the Florida Department of Health.
Sensitive-group AQI thresholds apply to a large share of Port St. Lucie households.
Treat Orange, 101 to 150, as an action trigger rather than a technicality.
Source: Florida Department of Health, Asthma Program
3. A High-Efficiency Filter Cuts Indoor PM2.5 by About 50%
Applies when the HVAC fan runs continuously. EPA, citing Fisk and Chan (2017).
A low-efficiency filter still cuts particles about 24% with the fan running.
The fan setting matters as much as the filter rating.
Source: U.S. EPA, Strategies to Reduce Exposure Indoors
7 Trusted Resources for Checking Port St. Lucie Air Quality Yourself
Every source below is a government agency or national health organization, and each answers a different question.
1. Confirm Whether Your Local Reading Is Measured or Modeled
Florida DEP St. Lucie County Air Monitoring · Florida Department of Environmental Protection
Florida DEP lists every regulatory air monitor in St. Lucie County and the pollutant each measures. It is the fastest way to confirm that local ozone is measured and local PM2.5 is not.
2. Check Any App Reading Against the Official EPA Scale
EPA AirNow AQI Basics · U.S. Environmental Protection Agency
AirNow is the EPA platform that defines all six AQI categories and their colors. Use it when two apps disagree about the same afternoon.
3. See Saharan Dust Coming Before It Reaches the Treasure Coast
NOAA AOML Saharan Air Layer · NOAA Atlantic Oceanographic and Meteorological Laboratory
NOAA tracks the Saharan Air Layer by satellite from Africa across the Atlantic and publishes its seasonal timing. Check it in June and July before blaming haze on a local source.
4. Get the Federal Answer on Filters During a Smoke Event
EPA Preparing for Smoke and Heat · U.S. Environmental Protection Agency
The EPA states directly that MERV 13 or higher is recommended during smoky periods and that most residential systems accommodate it. A neutral source, not a filter brand.
5. Turn a MERV Number into a Real Capture Rate
EPA What Is a MERV Rating · U.S. Environmental Protection Agency
The EPA publishes the full MERV table showing minimum capture efficiency at 0.3, 1.0, and 3.0 microns. Compare any two filters on the same standard instead of on packaging claims.
6. Track How St. Lucie County Scores Year over Year
American Lung Association State of the Air · American Lung Association
The Lung Association grades counties on ozone and particle pollution using three years of EPA data. Check each spring to see whether the local trend is improving or slipping.
7. Understand Why Indoor Air Is the Larger Exposure
EPA Indoor Air Quality, Report on the Environment · U.S. Environmental Protection Agency
EPA research finds Americans spend roughly 90 percent of their time indoors, where some pollutants run two to five times outdoor levels. This is the evidence behind treating filtration as the half you control.
Related Pages
Find your exact filter size and ship factory-direct from Filterbuy, or shop MERV 13 air filters before the next dust event.
Glossary
AQI (Air Quality Index): The EPA's 0 to 500 scale for outdoor air quality. It reports the single worst pollutant, not an average.
Dominant pollutant: The pollutant with the highest sub-index at a monitor. It sets the AQI value shown.
PM2.5: Fine particulate matter 2.5 micrometers or smaller, from smoke, dust, and combustion. Small enough to reach deep lung tissue.
Ground-level ozone: A gas formed when sunlight reacts with vehicle and industrial emissions. Peaks on hot, sunny afternoons.
Saharan Air Layer (SAL): A dry, dust-laden air mass forming over the Sahara that crosses the Atlantic to Florida each summer.
Everglades Agricultural Area (EAA): The roughly 400,000-acre sugarcane region south of Lake Okeechobee, southwest of Port St. Lucie.
MERV: Minimum Efficiency Reporting Value, the 1 to 16 scale for how well a filter captures particles.
Savannahs monitor (AQS ID 12-111-0013): St. Lucie County's only regulatory air monitoring station, in Fort Pierce, run by Florida DEP. Ozone only.