May 5, 2026

By David Heacock
While the recent wildfires in Western states have introduced new concerns about air quality, the United States has made huge strides in the reduction of air pollution in recent decades. As a result of the Clean Air Act and modern pollution control technologies, emissions of common air pollutants have dropped by more than 70 percent since 1970, according to new data from the Environmental Protection Agency (EPA).2 These reductions, which the EPA claims have significantly improved the environment and human health, occurred despite a growing population, increased energy use, and more cars on American roads.
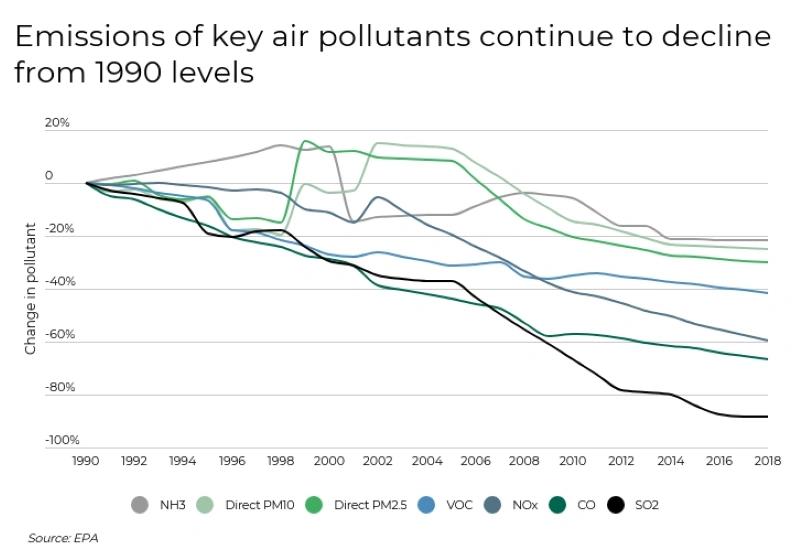
The EPA measures air quality through the Air Quality Index, or AQI. The AQI rates air quality with values between 0 and 500; an AQI over 100 is considered unhealthy for sensitive groups, and anything over 150 is unhealthy for everyone. Major pollutants accounted for by the AQI and regulated by the Clean Air Act include ground-level ozone, particle pollution (or particulate matter), carbon monoxide, sulfur dioxide, nitrogen dioxide, and lead.
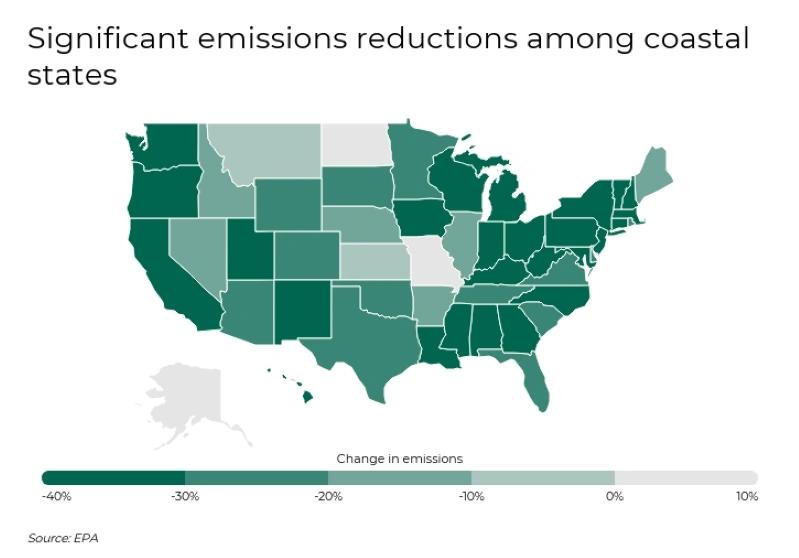
States that have witnessed the sharpest declines in air pollutant emissions (excluding wildfires) within the last decade are largely concentrated in the South, Northeast, Great Lakes, and West Coast. Ohio witnessed a 48.5 percent reduction in emissions from 2009 to 2019. This was closely followed by other states in the Great Lakes region, including Indiana, Michigan, Pennsylvania, and Wisconsin, whose emissions dropped between 47.9 and 42.1 percent. Coastal states in particular stand out among those with declines, with emissions in nearly every state on the East Coast and West Coast dropping between approximately 20 and 45 percent.
A strong reduction in emissions hasn’t entirely reduced air pollution levels in certain states. Even though California, for example, has reduced emissions by 41.1 percent, the state continues to struggle in combating smog. California’s car culture, topography, year-round mild climate, and wildfires pose a challenge to the state’s clean air standards. While 47 states reduced their emissions, Missouri, Alaska, and North Dakota actually increased emissions during the same time period.
TRENDING If you live in an area that regularly deals with poor air quality, it’s important to replace your home air filters often. For especially bad areas and/or if you suffer from a respiratory illness, consider purchasing MERV 13 air filters, which provide extra protection.
To determine the metropolitan areas with the largest decreases in air pollution over the past decade, researchers at Filterbuy ranked locations by the percentage change in median AQI between the five-year period ending in 2019 and the five-year period ending in 2009. Five-year periods were used to lessen the effects of annual variability in AQI on the overall results. To improve relevance, metropolitan areas were grouped into cohorts based on population size: large (1,000,000 or more), midsize (350,000-999,999), and small (less than 350,000).
Here are the metropolitan areas with the biggest improvement in air quality over the past decade.
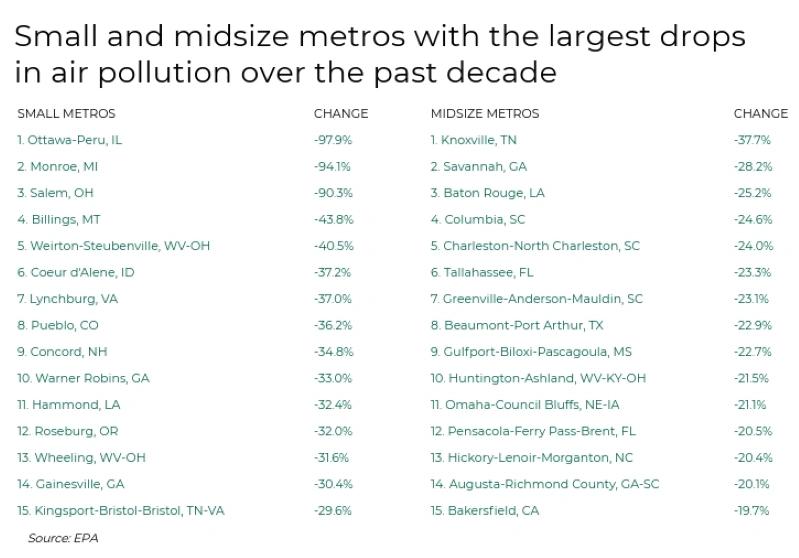

Photo Credit: Alamy Stock Photo

Photo Credit: Alamy Stock Photo

Photo Credit: Alamy Stock Photo

Photo Credit: Alamy Stock Photo

Photo Credit: Alamy Stock Photo

Photo Credit: Alamy Stock Photo

Photo Credit: Alamy Stock Photo

Photo Credit: Alamy Stock Photo

Photo Credit: Alamy Stock Photo

Photo Credit: Alamy Stock Photo

Photo Credit: Alamy Stock Photo

Photo Credit: Alamy Stock Photo

Photo Credit: Alamy Stock Photo

Photo Credit: Alamy Stock Photo

Photo Credit: Alamy Stock Photo
15. Atlanta-Sandy Springs-Roswell, GA
10-year percentage change in median AQI: -20.8%
Median AQI (2015-2019): 53
Median AQI (2005-2009): 66
Number of good AQI days per year (2015-2019): 158
Number of good AQI days per year (2005-2009): 77
14. Kansas City, MO-KS
10-year percentage change in median AQI: -21.0%
Median AQI (2015-2019): 49
Median AQI (2005-2009): 62
Number of good AQI days per year (2015-2019): 198
Number of good AQI days per year (2005-2009): 103
13. New Orleans-Metairie, LA
10-year percentage change in median AQI: -22.0%
Median AQI (2015-2019): 46
Median AQI (2005-2009): 59
Number of good AQI days per year (2015-2019): 224
Number of good AQI days per year (2005-2009): 121
12. Indianapolis-Carmel-Anderson, IN
10-year percentage change in median AQI: -22.3%
Median AQI (2015-2019): 51
Median AQI (2005-2009): 65
Number of good AQI days per year (2015-2019): 178
Number of good AQI days per year (2005-2009): 81
11. Charlotte-Concord-Gastonia, NC-SC
10-year percentage change in median AQI: -22.5%
Median AQI (2015-2019): 47
Median AQI (2005-2009): 61
Number of good AQI days per year (2015-2019): 212
Number of good AQI days per year (2005-2009): 115
10. Virginia Beach-Norfolk-Newport News, VA-NC
10-year percentage change in median AQI: -22.9%
Median AQI (2015-2019): 38
Median AQI (2005-2009): 50
Number of good AQI days per year (2015-2019): 310
Number of good AQI days per year (2005-2009): 187
9. Tampa-St. Petersburg-Clearwater, FL
10-year percentage change in median AQI: -23.4%
Median AQI (2015-2019): 44
Median AQI (2005-2009): 57
Number of good AQI days per year (2015-2019): 250
Number of good AQI days per year (2005-2009): 128
8. Chicago-Naperville-Elgin, IL-IN-WI
10-year percentage change in median AQI: -24.2%
Median AQI (2015-2019): 55
Median AQI (2005-2009): 73
Number of good AQI days per year (2015-2019): 132
Number of good AQI days per year (2005-2009): 36
7. Memphis, TN-MS-AR
10-year percentage change in median AQI: -25.6%
Median AQI (2015-2019): 44
Median AQI (2005-2009): 59
Number of good AQI days per year (2015-2019): 242
Number of good AQI days per year (2005-2009): 120
6. Cleveland-Elyria, OH
10-year percentage change in median AQI: -25.7%
Median AQI (2015-2019): 50
Median AQI (2005-2009): 67
Number of good AQI days per year (2015-2019): 185
Number of good AQI days per year (2005-2009): 109
5. Phoenix-Mesa-Scottsdale, AZ
10-year percentage change in median AQI: -26.8%
Median AQI (2015-2019): 76
Median AQI (2005-2009): 104
Number of good AQI days per year (2015-2019): 40
Number of good AQI days per year (2005-2009): 30
4. Pittsburgh, PA
10-year percentage change in median AQI: -26.8%
Median AQI (2015-2019): 57
Median AQI (2005-2009): 78
Number of good AQI days per year (2015-2019): 119
Number of good AQI days per year (2005-2009): 39
3. Birmingham-Hoover, AL
10-year percentage change in median AQI: -27.2%
Median AQI (2015-2019): 51
Median AQI (2005-2009): 71
Number of good AQI days per year (2015-2019): 169
Number of good AQI days per year (2005-2009): 54
2. Louisville/Jefferson County, KY-IN
10-year percentage change in median AQI: -27.4%
Median AQI (2015-2019): 49
Median AQI (2005-2009): 67
Number of good AQI days per year (2015-2019): 198
Number of good AQI days per year (2005-2009): 75
1. St. Louis, MO-IL
10-year percentage change in median AQI: -36.5%
Median AQI (2015-2019): 53
Median AQI (2005-2009): 84
Number of good AQI days per year (2015-2019): 154
Number of good AQI days per year (2005-2009): 36
A large majority of major American metropolitan areas observed sharp declines in air pollution, with over 78 percent indicating an improvement in their 10-year percentage change in median air quality. The 15 large metropolitan areas with the biggest improvement in air quality gained an average of 97 good AQI days per year. For example, between 2005 and 2009, the Chicago metropolitan area reported an average of 36 good days per year. That number increased to 132 good days per year over the next decade.
Better air quality has improved the lives of residents in midsize and small metros across the country. Bakersfield, California went from a median AQI of 99 in 2005–2009, very close to being regularly unhealthy for sensitive groups, down to a median AQI of 80 in 2015–2019. The city’s number of good AQI days nearly doubled from 41 to 75 over the same time period.
The data used in this analysis is from the EPA’s 2019 Air Quality Index Report. The Air Quality Index (AQI) is EPA’s method for reporting daily air quality by location based on National Ambient Air Quality Standards. Higher AQI values correspond to higher levels of pollution and worse air quality. AQI values below 50 are considered good; AQI values between 51 and 100 are considered moderate; and AQI values that exceed 100 are considered unhealthy (at first for sensitive groups and then for everyone as values increase).
To determine the locations with the largest decreases in air pollution over the past decade, metropolitan areas were ranked by the percentage change in median AQI between the five-year period ending in 2019 and the five-year period ending in 2009. Five-year periods were used to lessen the effects of annual variability in AQI on the overall results.
To improve relevance, metropolitan areas were grouped into cohorts based on population size: large (1,000,000 or more), midsize (350,000-999,999), and small (less than 350,000). Population data is from the U.S. Census Bureau’s 2018 American Community Survey 1-Year Estimates. Only metropolitan areas with at least 100,000 residents were included in the report.
Components of air pollution pose dangers to the environment and to overall health. Health effects can include reduced oxygen levels, respiratory symptoms, eye, ear, and nose irritation, damage to the nervous system, high blood pressure, and heart disease. Those most at risk from air pollution include unborn babies, children, older adults, and people with asthma, heart, and lung disease.