By David Heacock
The year 2020 marked another decennial Census, the once-a-decade federal project of counting the U.S. population. The Census collects data on a variety of demographic indicators, giving the federal government and the public alike more information on how the population has changed and what that means for the future. One of the most impactful demographic trends across the United States in the coming decades will be the growth in the population aged 65 and older.
Much of the country is graying as more Baby Boomers, who were until 2019 the U.S.’s largest generational cohort, reach retirement age. The Boomers—more than 73 million Americans born between 1946 and 1964—began hitting retirement age more than a decade ago and will continue to age into the 65-and-up bracket until the end of the 2020s. Thanks to advances in healthcare and medicine, these older Americans are projected to live longer on average than their predecessors. According to the Census Bureau, by 2030, those aged 65 and older will constitute more than 20 percent of the U.S. population, and they are projected to remain between one-fifth and one-quarter of the U.S. population through at least 2060.
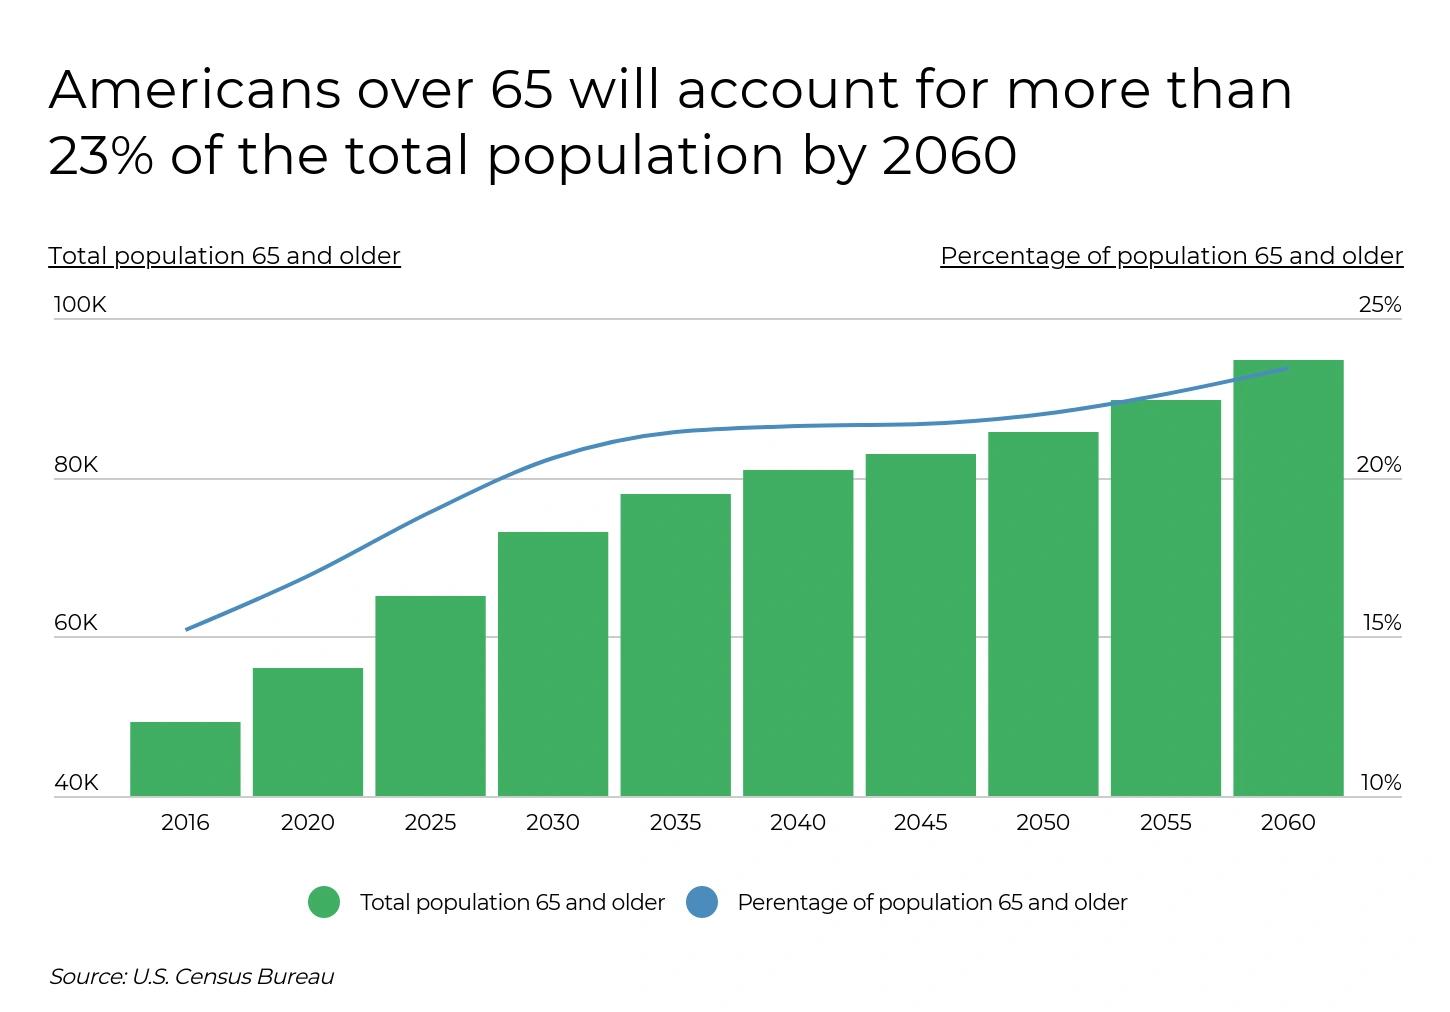
Another measure that puts this trend in context is the old-age dependency ratio, or the ratio of those aged 65 or older to the working age population (measured as those aged 15 to 64). In 2010, the national old-age dependency ratio was 20.8, meaning that there were 20.8 individuals over 65 for every 100 working age adults. By 2019, that figure had increased to 26.9. The Census Bureau projects that figure will be 41 by 2060.
A rising old-age dependency ratio means that those of working age increasingly carry the economic burden of care for the nonworking elderly. The U.S. is already seeing signs of these effects. A wave of retirements will leave labor shortages in some industries, while many of the occupations with the greatest growth potential are in health and social services, driven by the elderly’s greater need for care. Experts believe that GDP growth is likely to slow as a result of lost productivity and increasing costs of care. Government social insurance programs like Medicare and Social Security have seen their expenditures balloon as more retirees shift from paying into the system to receiving benefits from it. Nationally, within states, and at the community level, the U.S. will continue to experience the socioeconomic implications of an increasingly older population.
TRENDING
It’s a healthy habit to replace your home air filters regularly. If you’re older or suffer from a respiratory condition, you should consider purchasing MERV 13 air filters, which provide the best protection inside your home.
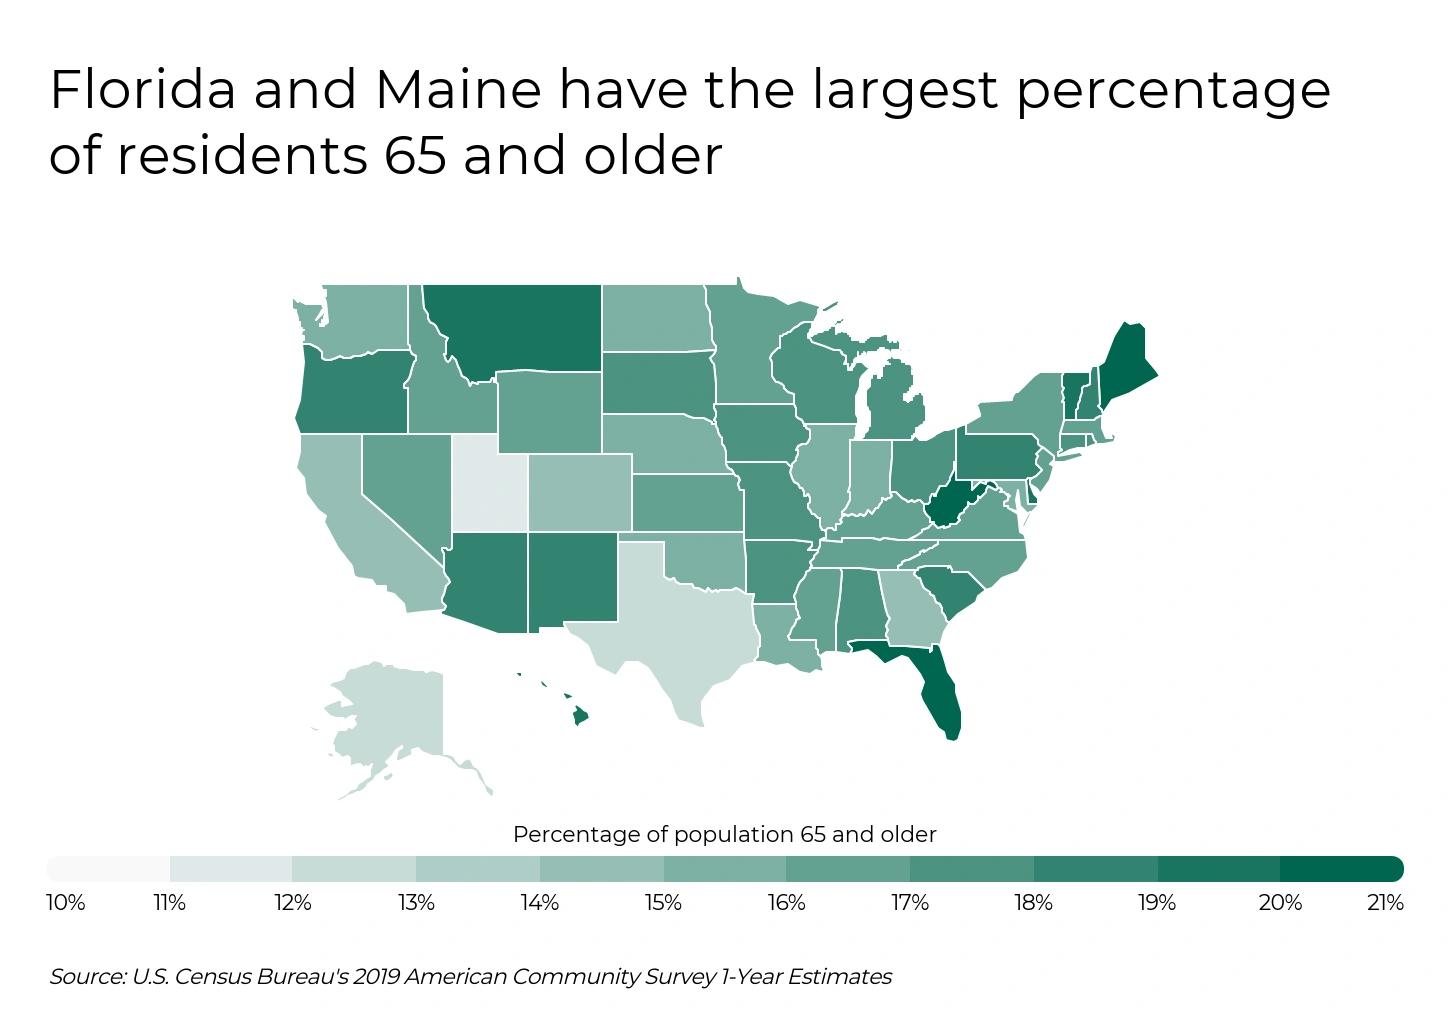
Contrary to what one might expect, it won’t just be retirement destinations like Florida—the state with the highest share of seniors currently—who will feel the effects of an aging population. The population over 65 is growing across the country, and other states leading the list of senior populations are as geographically and culturally varied as Maine, West Virginia, Hawaii, Pennsylvania, and South Carolina.
The same conditions are true of cities, and they will likewise experience the impacts of an aging population. To find the cities where these trends will be most apparent, researchers at Filterbuy used 2019 U.S. Census data to identify which metro areas have the largest share of residents over 65. The researchers also found the city-level old-age dependency ratios as well as the percentage of the senior population with a disability to understand where the burdens of care may be even higher.
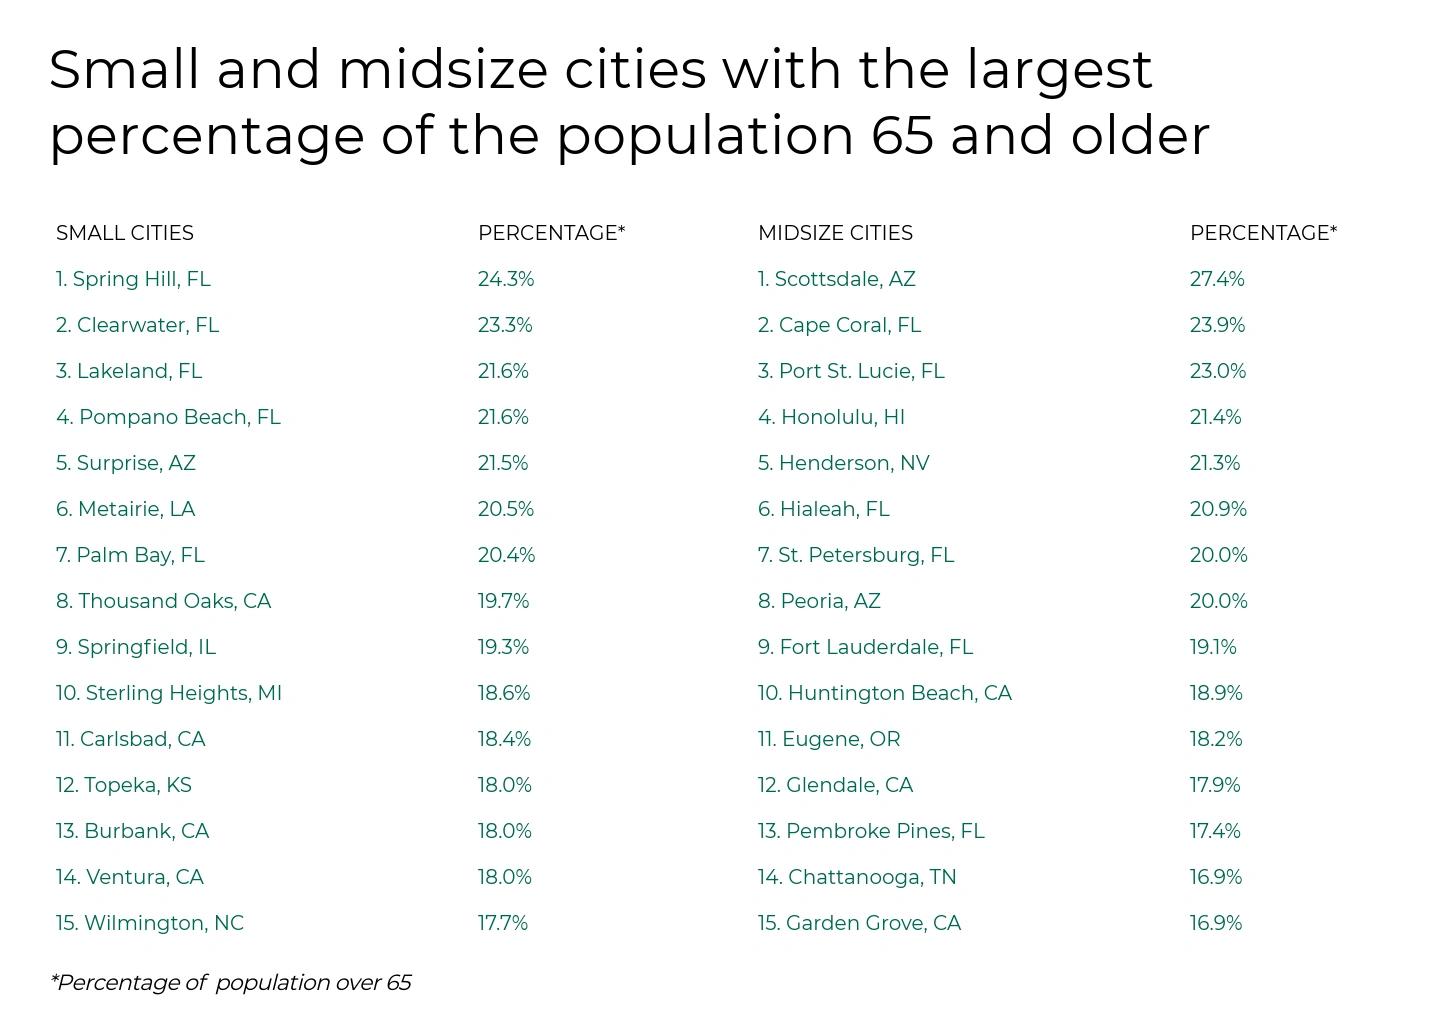
Here are the cities with the largest percentage of the population 65 and older.
Large Cities With the Oldest Populations
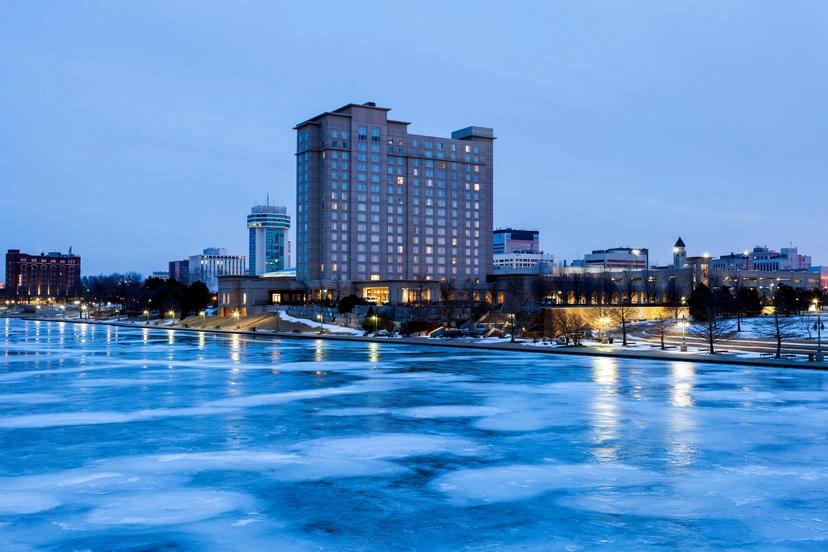
Wichita, Kansas
Largest city in Kansas
Old-age dependency ratio
24.0%
Total population 65+
55,352
65+ with a disability (%)
37.7%
Did you know
Nearly 4 in 10 of Wichita's 55,000+ seniors live with a disability — making clean indoor air a daily health priority, not just a comfort. A quality MERV-rated filter helps reduce the airborne triggers that hit older, more vulnerable lungs the hardest. Shop filters →
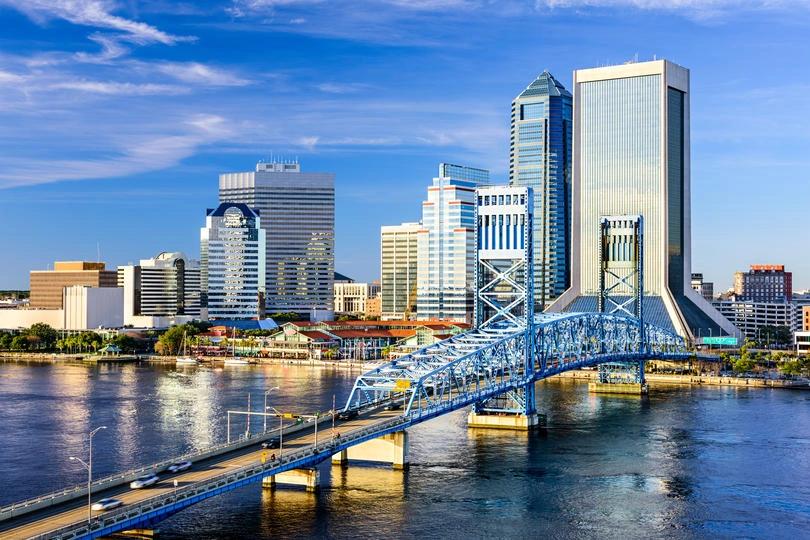
Jacksonville, Florida
Largest city in Florida by area
Old-age dependency ratio
22.8%
Total population 65+
127,758
65+ with a disability (%)
35.9%
Did you know
Jacksonville's subtropical humidity and high pollen counts make indoor air quality especially challenging for its 127,000+ seniors — over a third of whom live with a disability. A quality air filter helps protect lungs that are already working harder. Shop filters →
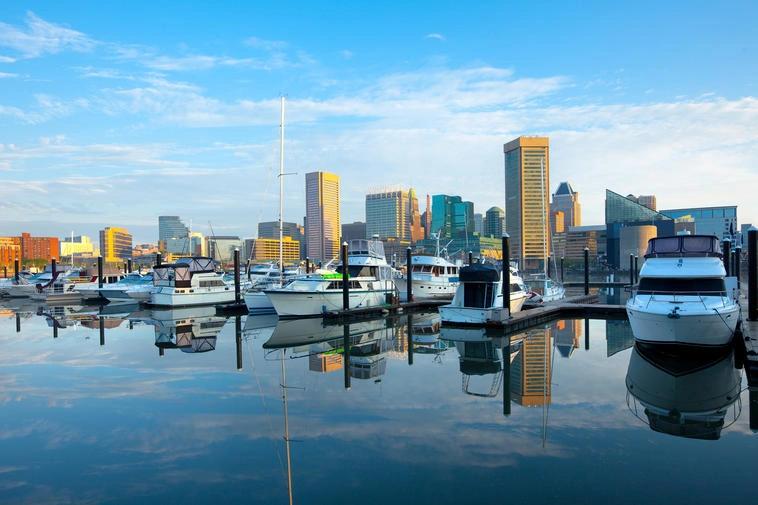
Baltimore, Maryland
Largest city in Maryland
Old-age dependency ratio
22.3%
Total population 65+
84,165
65+ with a disability (%)
38.5%
Did you know
Baltimore has one of the highest senior disability rates in this dataset at 38.5% — nearly 4 in 10 older residents face daily health challenges where clean indoor air can make a meaningful difference in quality of life. Shop filters →

Tulsa, Oklahoma
Second-largest city in Oklahoma
Old-age dependency ratio
24.8%
Total population 65+
58,686
65+ with a disability (%)
33.4%
Did you know
Tulsa sits in Tornado Alley, where seasonal storms stir up dust, mold spores, and outdoor allergens that push indoors — a MERV-rated filter is one of the simplest ways older residents can protect their respiratory health year-round. Shop filters →

Las Vegas, Nevada
Largest city in Nevada
Old-age dependency ratio
24.4%
Total population 65+
95,394
65+ with a disability (%)
34.9%
Did you know
Las Vegas's desert environment means fine dust and dry air are constant indoor air quality threats — especially for the nearly 95,000 seniors who spend more time indoors and are more susceptible to airborne particulates. Shop filters →

New York, New York
Most populous city in the U.S.
Old-age dependency ratio
24.0%
Total population 65+
1,242,566
65+ with a disability (%)
34.6%
Did you know
New York City is home to more than 1.2 million residents aged 65 and older — a senior population larger than the total population of many U.S. states, all breathing air affected by urban pollution, allergens, and aging building systems. Shop filters →

Colorado Springs, Colorado
Second-largest city in Colorado
Old-age dependency ratio
23.6%
Total population 65+
70,512
65+ with a disability (%)
31.3%
Did you know
At over 6,000 feet elevation, Colorado Springs' thinner air can strain older respiratory systems — and wildfire smoke from the region makes filtration even more critical for the 70,000+ seniors calling this city home. Shop filters →
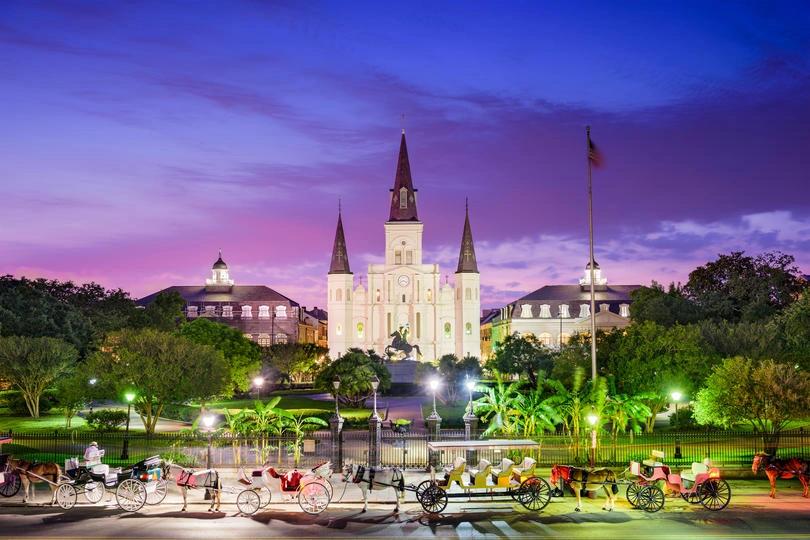
New Orleans, Louisiana
Largest city in Louisiana
Old-age dependency ratio
24.0%
Total population 65+
59,203
65+ with a disability (%)
35.9%
Did you know
New Orleans' below-sea-level geography and persistent humidity create some of the highest indoor mold risks in the country — a serious concern for the 35.9% of local seniors already managing a disability. Shop filters →
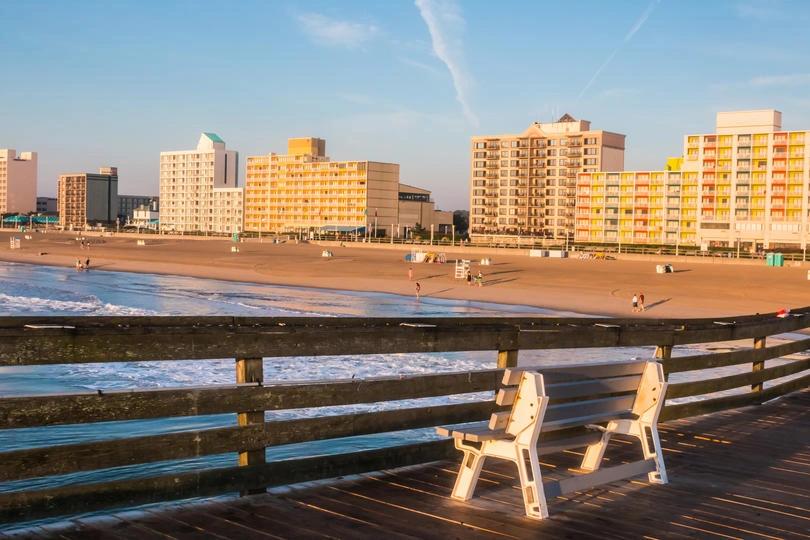
Virginia Beach, Virginia
Largest city in Virginia
Old-age dependency ratio
23.3%
Total population 65+
65,405
65+ with a disability (%)
31.2%
Did you know
Virginia Beach's coastal climate brings salt air, humidity, and seasonal pollen that infiltrate homes year-round — conditions that make regular filter changes especially important for the 65,000+ older residents in the area. Shop filters →

Tucson, Arizona
Second-largest city in Arizona
Old-age dependency ratio
23.7%
Total population 65+
82,197
65+ with a disability (%)
38.8%
Did you know
Tucson has the highest senior disability rate in this dataset at 38.8%, and its desert dust storms — known locally as haboobs — send fine particulates straight into homes, making a reliable air filter one of the most practical health investments a senior can make. Shop filters →

Louisville, Kentucky
Largest city in Kentucky
Old-age dependency ratio
25.5%
Total population 65+
95,530
65+ with a disability (%)
34.8%
Did you know
Louisville ranks among the worst U.S. cities for allergy sufferers, with high tree and grass pollen counts that peak in spring — a particular challenge for the nearly 96,000 seniors who spend more time indoors and are more sensitive to airborne irritants. Shop filters →

San Francisco, California
Cultural and financial hub of Northern California
Old-age dependency ratio
22.7%
Total population 65+
139,273
65+ with a disability (%)
34.2%
Did you know
Wildfire smoke from Northern California regularly blankets San Francisco with hazardous air quality — a growing threat for the city's 139,000+ seniors, for whom even short-term smoke exposure carries serious respiratory risk. Shop filters →
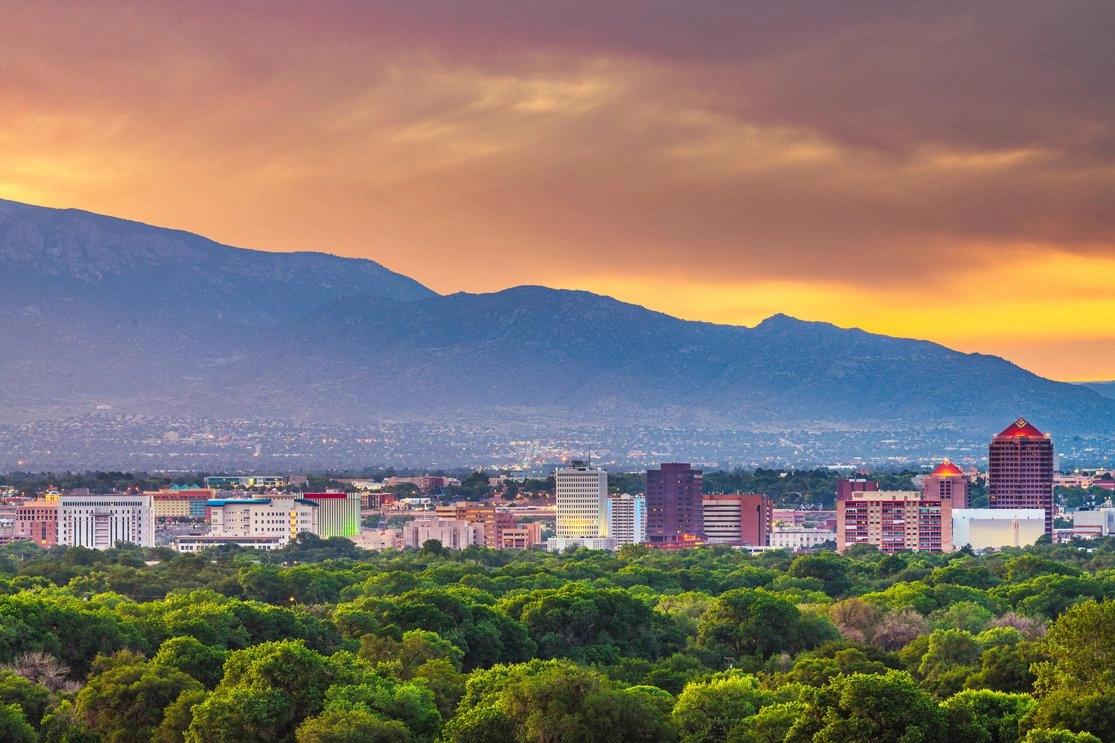
Albuquerque, New Mexico
Largest city in New Mexico
Old-age dependency ratio
26.5%
Total population 65+
90,429
65+ with a disability (%)
33.4%
Did you know
Albuquerque sits at 5,300 feet elevation where dry desert air, frequent dust events, and high UV-driven ozone combine to challenge respiratory health — making indoor air filtration especially valuable for its growing senior population. Shop filters →

Mesa, Arizona
Third-largest city in Arizona
Old-age dependency ratio
28.5%
Total population 65+
85,337
65+ with a disability (%)
31.9%
Did you know
Mesa is one of Arizona's top retirement destinations, with a higher old-age dependency ratio than most large U.S. cities — and its desert dust storms mean HVAC filters work overtime protecting the lungs of 85,000+ older residents. Shop filters →
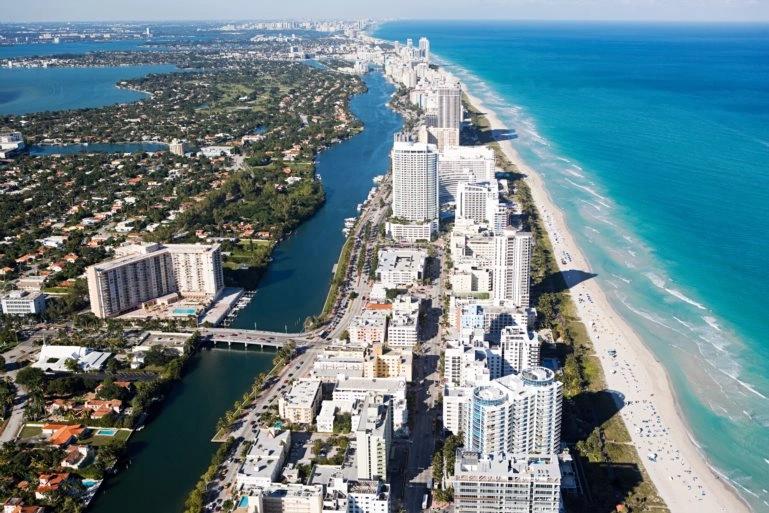
Miami, Florida
Financial and cultural hub of South Florida
Old-age dependency ratio
27.1%
Total population 65+
81,251
65+ with a disability (%)
34.6%
Did you know
Miami has the highest share of seniors in this dataset at 17.5% — and its year-round heat and humidity drive mold growth indoors at some of the highest rates in the nation, making clean air filtration a critical part of healthy aging in South Florida. Shop filters →
Methodology & Detailed Findings
Researchers used the most recent population data from the U.S. Census Bureau’s 2019 American Community Survey 1-Year Estimates. Cities were ranked according to the percentage of the population 65 and older. Researchers also calculated the total population 65 and older, the percentage of the population 65 and older with a disability, and the old-age dependency ratio for each city. For relevance, only cities with at least 100,000 residents were included in the report.
Cities were also grouped into the following cohorts based on population:
Small cities: 100,000–149,999 residents
Midsize cities: 150,000–349,999 residents
Large cities: 350,000 residents or more

