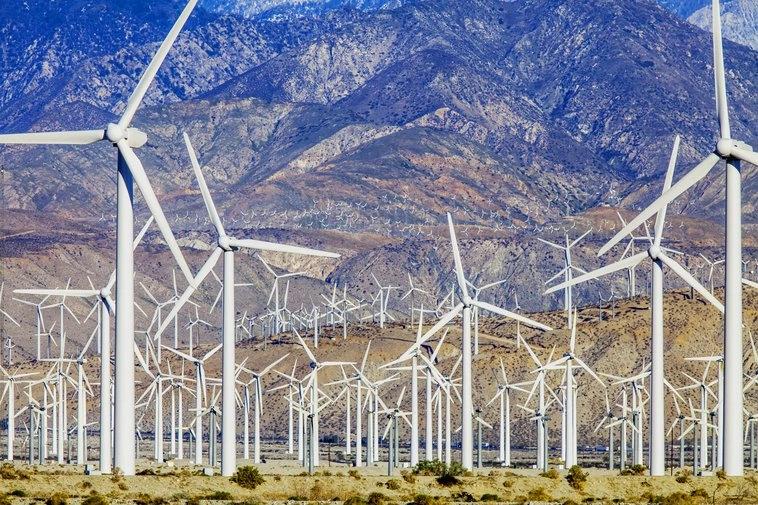
With summer fast approaching, Americans across the country are making their warm-weather plans. But while residents in the northern U.S. typically enjoy comfortably warm temperatures, Americans in other parts of the country increasingly face months of extreme heat and other severe weather events. According to data from the National Oceanic and Atmospheric Administration (NOAA), some U.S. cities experience nearly 200 days per year with temperatures of 90℉ or higher, a number that’s rising.
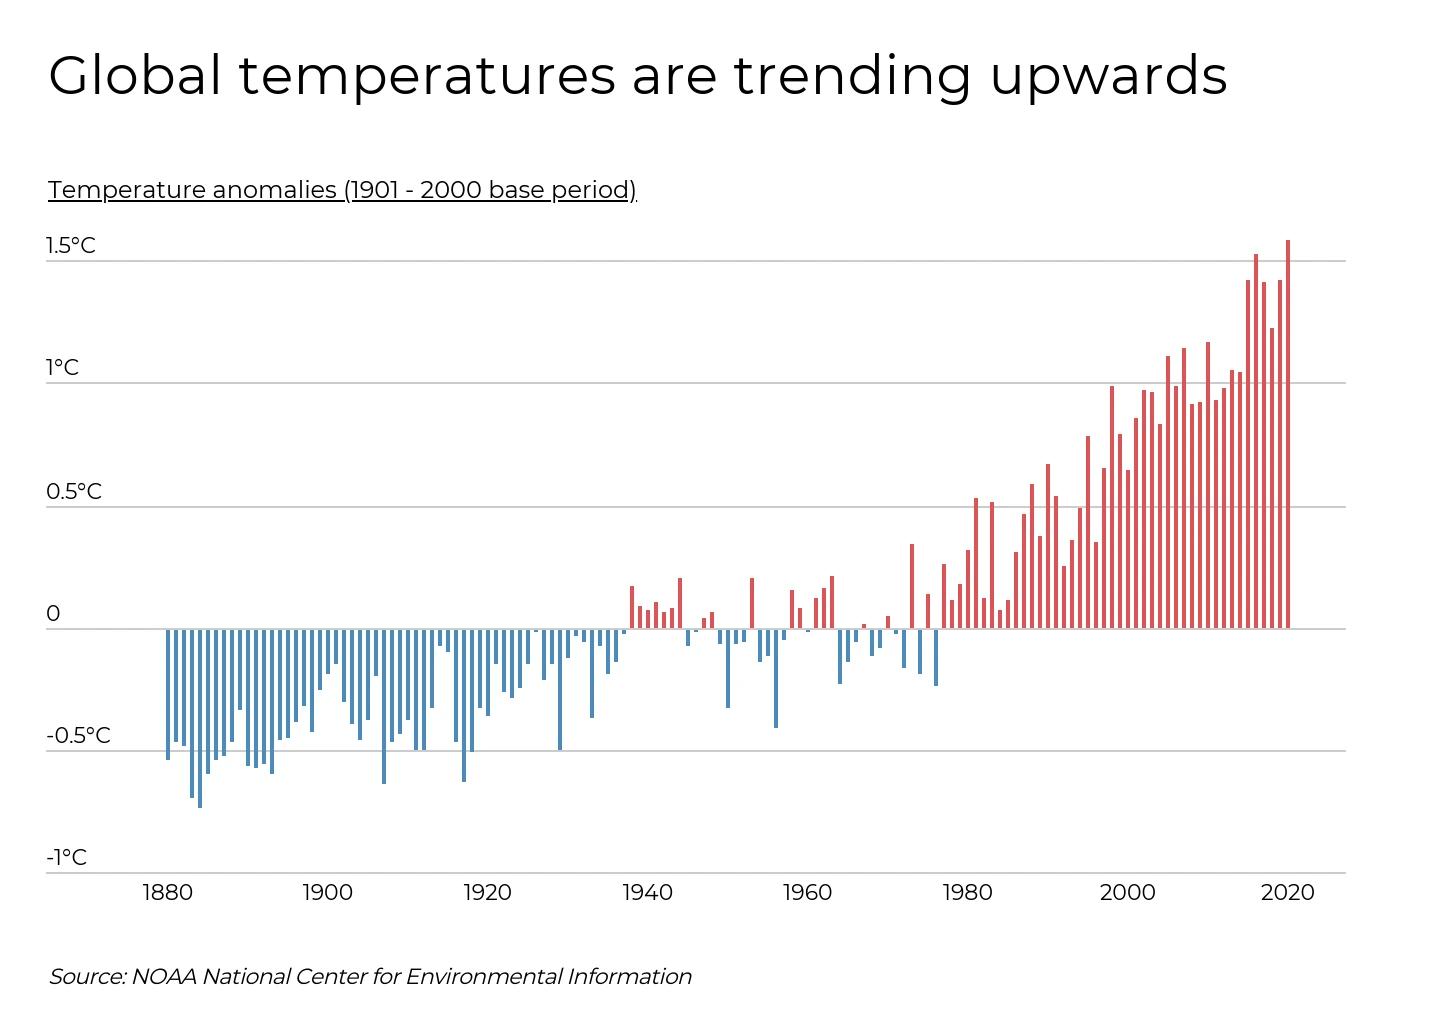
Many parts of the U.S. with already high summer temperatures are seeing their temperatures climb even higher as the Earth’s temperatures warm. In every year since 1977, global average temperatures have been higher than the 20th century global temperature average. And the difference from the average 20th century temperature has been steadily climbing.
In 2020, the global temperature average was 1.6℃ higher (2.84℉) than the average temperature from the last century, making it the warmest year on record (tied with year 2016). The impacts of global climate change are already occurring in the form of sea ice depletion, faster rise in sea levels, and more intense heat waves. Scientists predict that global temperatures will continue to increase, although not uniformly, and much of the western and central parts of the U.S. will be subject to more frequent and extreme summer heat waves.
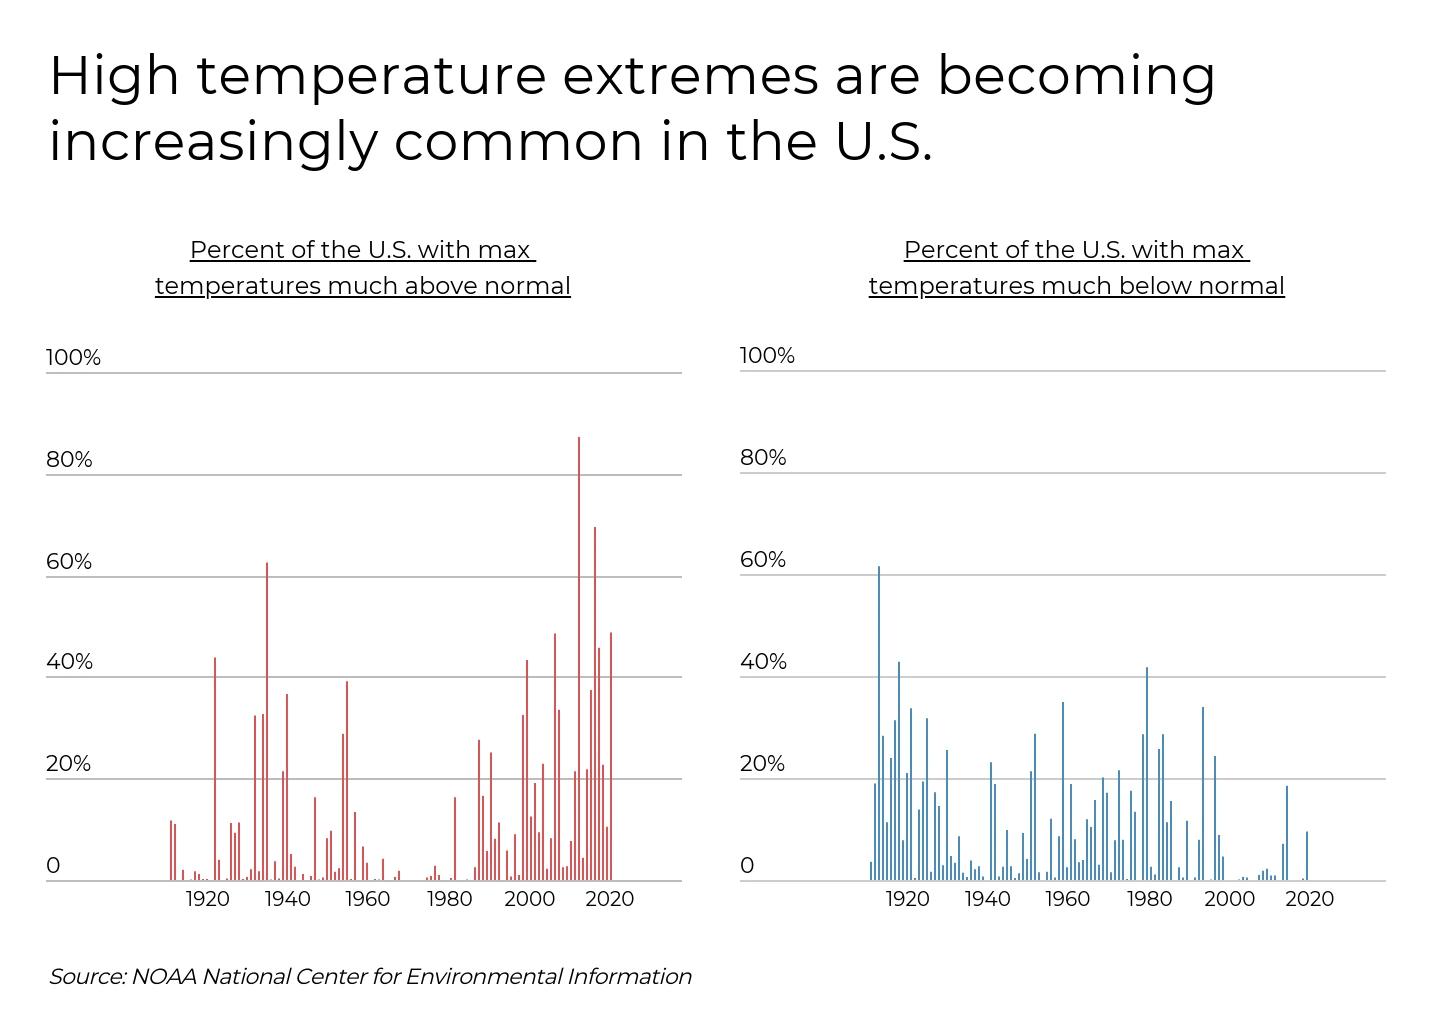
As the Earth warms overall, such high temperature extremes are becoming increasingly common. In 2020, 49% of the U.S. had maximum temperatures much above normal—that is, nearly half of the country had high temperatures in the upper 10th percentile of the local historical record. At the same time, cold temperature extremes have become less common. For example, in 2020, no part of the U.S. recorded low temperatures in the bottom 10th percentile.
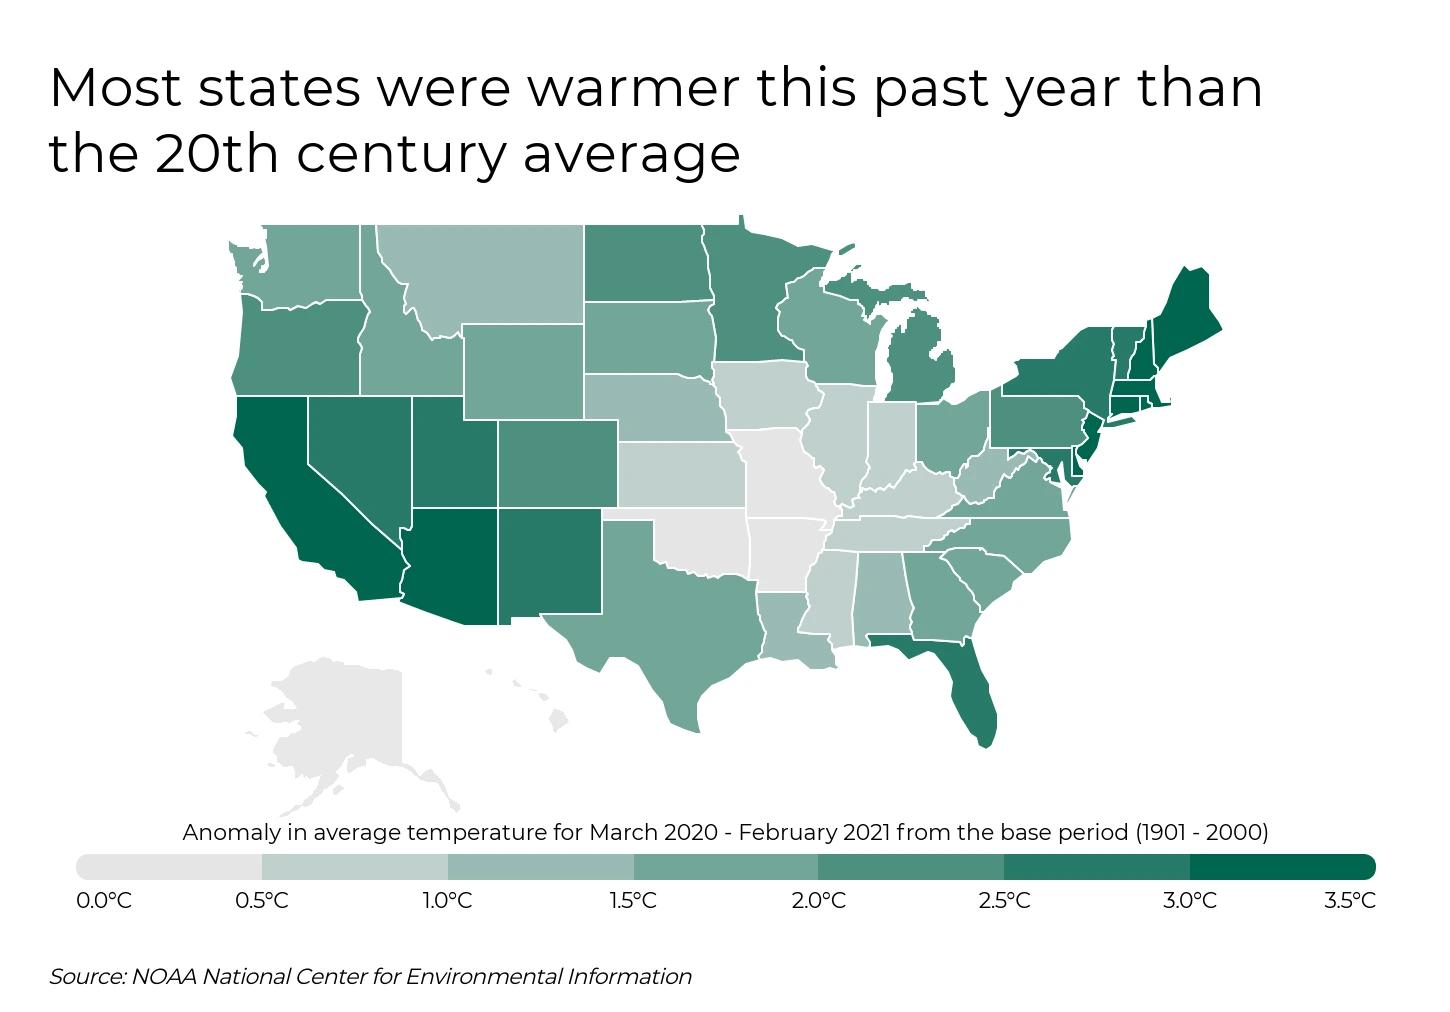
At the state level, some states have had more marked increases in their average temperatures than others. Comparing data from the past year to the historical record, Rhode Island experienced the greatest average temperature increase, 3.6℉, from the 20th century average temperature. Other states with similar increases include Maine, Arizona, Connecticut, Delaware, Massachusetts, California, and New Jersey. Only two states, Arkansas and Oklahoma, actually recorded slightly lower average temperatures than last century’s average, -0.2℉ and -0.1℉ lower, respectively.
DID YOU KNOW?
Filterbuy’s MERV 13 air filters stop 98% of airborne particles from entering your home. Be sure to keep the air in your home healthy and clean with Filterbuy.
To find the hottest city in every state, researchers at Filterbuy analyzed the latest data from NOAA. Within each state, the researchers ranked cities according to the greatest long-term average number of days per year when the temperature is 90℉ or higher. Researchers also calculated the long-term average number of days per year when the temperature is 100℉ or higher, the long-term average high temperature during the summer months, and the average long-term low temperature during summer. Only cities with populations of 10,000 or greater were considered in the analysis.
The Hottest City in Every State
Alabama
Southern state · humid subtropical
Hottest city
Tuscaloosa
Days above 90°F / yr
80
Days above 100°F / yr
5
Avg summer high
91.9°F
Avg summer low
70.7°F
Filter tip
Alabama's high humidity supercharges mold and pollen growth indoors — a MERV 11 filter traps these microscopic particles far better than basic fiberglass, keeping your AC coils cleaner through those long, steamy summers. Shop filters →
Alaska
Northern state · subarctic
Hottest city
Fairbanks
Days above 90°F / yr
0
Days above 100°F / yr
0
Avg summer high
70.6°F
Avg summer low
48.9°F
Filter tip
Alaska homes run sealed tight for most of the year, which traps dust, wildfire smoke, and wood-burning particulates indoors — a MERV 13 filter is ideal for capturing fine smoke particles when your home gets little fresh air ventilation. Shop filters →
Arizona
Desert Southwest · arid
Hottest city
Yuma
Days above 90°F / yr
185
Days above 100°F / yr
124
Avg summer high
107.5°F
Avg summer low
73.8°F
Filter tip
With 124 days topping 100°F, Arizona AC systems run almost nonstop — desert dust and haboob sediment clog filters fast, so a MERV 8 changed every 30–45 days protects your system without restricting airflow during peak demand. Shop filters →
Arkansas
South-central state · hot humid summers
Hottest city
Helena-West Helena
Days above 90°F / yr
100
Days above 100°F / yr
11
Avg summer high
94.1°F
Avg summer low
68.2°F
Filter tip
Arkansas summers combine heat and humidity, accelerating dust mite and mold growth — a MERV 10 filter with monthly changes keeps your indoor air cleaner and your AC system from working overtime through the sweltering months. Shop filters →
California
West Coast · desert and coastal zones
Hottest city
Indio
Days above 90°F / yr
182
Days above 100°F / yr
117
Avg summer high
105.7°F
Avg summer low
78.3°F
Filter tip
With 117 days above 100°F, California's desert regions demand aggressive cooling — a MERV 8 filter changed every 30 days prevents fine dust from clogging coils and choking airflow during peak summer heat. Shop filters →
Colorado
Mountain state · dry high elevation
Hottest city
Greeley
Days above 90°F / yr
68
Days above 100°F / yr
12
Avg summer high
90.9°F
Avg summer low
56.2°F
Filter tip
Colorado's dry mountain air moves fine dust and pollen efficiently indoors — a MERV 9 filter strikes the perfect balance, capturing allergens without restricting airflow in your home's cooling system. Shop filters →
Connecticut
New England · mild summers
Hottest city
Danbury
Days above 90°F / yr
16
Days above 100°F / yr
1
Avg summer high
82.8°F
Avg summer low
61.2°F
Filter tip
Connecticut's brief, mild summers mean you won't run AC constantly, but spring and fall allergens are prolific — a MERV 8 filter changed every 90 days is ideal for capturing seasonal pollen without unnecessary system strain. Shop filters →
Delaware
Mid-Atlantic · coastal humidity
Hottest city
Newark
Days above 90°F / yr
30
Days above 100°F / yr
1
Avg summer high
86.7°F
Avg summer low
63.9°F
Filter tip
Delaware's coastal humidity brings salt air and moist conditions indoors, feeding mold growth — a MERV 10 filter with quarterly changes protects your system while controlling moisture-related allergens year-round. Shop filters →
Florida
Southeastern · tropical humidity
Hottest city
Lakeland
Days above 90°F / yr
138
Days above 100°F / yr
1
Avg summer high
93.8°F
Avg summer low
72.5°F
Filter tip
Florida's extreme humidity and 138 days of heat mean AC runs nearly year-round, breeding mold and dust mites — a MERV 11 filter changed every 60 days is essential for maintaining air quality and system efficiency in tropical climates. Shop filters →
Georgia
Southeastern · humid subtropical
Hottest city
Albany
Days above 90°F / yr
89
Days above 100°F / yr
2
Avg summer high
91.9°F
Avg summer low
71.4°F
Filter tip
Georgia's hot, humid climate creates ideal conditions for mold and pollen proliferation — a MERV 11 filter changed every 60–90 days combats these allergens while your AC battles the relentless Southern heat. Shop filters →
Hawaii
Pacific islands · tropical year-round
Hottest city
Honolulu
Days above 90°F / yr
19
Days above 100°F / yr
0
Avg summer high
87.9°F
Avg summer low
74.3°F
Filter tip
Hawaii's constant tropical trade winds and salt air make moisture control critical indoors — a MERV 10 filter with quarterly changes protects against mold spores and salt-laden particles year-round. Shop filters →
Idaho
Northwestern state · dry summers
Hottest city
Caldwell
Days above 90°F / yr
62
Days above 100°F / yr
14
Avg summer high
90.5°F
Avg summer low
56.7°F
Filter tip
Idaho's dry high-elevation summers produce fine dust that clogs filters quickly — a MERV 8 changed every 45 days provides adequate capture without choking airflow during peak cooling season. Shop filters →
Illinois
Midwest · mild summers
Hottest city
Carbondale
Days above 90°F / yr
40
Days above 100°F / yr
1
Avg summer high
87.8°F
Avg summer low
65.1°F
Filter tip
Illinois' moderate summers mean seasonal AC use — a MERV 8 filter changed every 90 days balances allergen capture with cost-effectiveness, keeping your system running smoothly during brief peak heat periods. Shop filters →
Indiana
Midwest · humid continental
Hottest city
Evansville
Days above 90°F / yr
66
Days above 100°F / yr
3
Avg summer high
90.6°F
Avg summer low
68.8°F
Filter tip
Indiana's humid summers accelerate dust mite and pollen accumulation — a MERV 9 filter changed every 60–90 days maintains air quality and AC efficiency through the muggy season. Shop filters →
Iowa
Midwest · cool summers
Hottest city
Burlington
Days above 90°F / yr
25
Days above 100°F / yr
1
Avg summer high
85.2°F
Avg summer low
65.0°F
Filter tip
Iowa's cool summers mean minimal AC runtime — a basic MERV 8 filter changed annually or seasonally provides adequate protection for your limited cooling needs. Shop filters →
Kansas
Great Plains · hot dry summers
Hottest city
Liberal
Days above 90°F / yr
73
Days above 100°F / yr
13
Avg summer high
91.3°F
Avg summer low
63.2°F
Filter tip
Kansas' dust-laden high plains and 13 triple-digit days demand efficient cooling — a MERV 8 changed every 45 days prevents fine sediment from clogging your AC during extended peak heat. Shop filters →
Kentucky
Southeastern · humid temperate
Hottest city
Glasgow
Days above 90°F / yr
54
Days above 100°F / yr
2
Avg summer high
89.6°F
Avg summer low
65.3°F
Filter tip
Kentucky's humid summers create mold and pollen hotspots — a MERV 9 filter changed every 60 days keeps your AC system efficient while controlling seasonal allergens in your home. Shop filters →
Louisiana
Deep South · sweltering humidity
Hottest city
Monroe
Days above 90°F / yr
98
Days above 100°F / yr
7
Avg summer high
93.3°F
Avg summer low
70.9°F
Filter tip
Louisiana's oppressive heat and 98 days above 90°F fuel year-round mold and mildew — a MERV 11 filter changed every 45 days is critical for controlling humidity-driven allergens while your AC runs constantly. Shop filters →
Maine
New England · cool coastal
Hottest city
Orono
Days above 90°F / yr
8
Days above 100°F / yr
0
Avg summer high
78.9°F
Avg summer low
56.7°F
Filter tip
Maine's cool summers mean minimal AC demand — a basic MERV 8 filter changed annually provides sufficient protection for your infrequent cooling needs. Shop filters →
Maryland
Mid-Atlantic · humid summers
Hottest city
Baltimore
Days above 90°F / yr
61
Days above 100°F / yr
8
Avg summer high
90.3°F
Avg summer low
73.0°F
Filter tip
Maryland's muggy summers with 8 days above 100°F amplify mold and dust mite growth — a MERV 10 filter changed every 60 days protects your indoor air quality and system longevity. Shop filters →
Massachusetts
New England · mild springs
Hottest city
Lowell
Days above 90°F / yr
15
Days above 100°F / yr
0
Avg summer high
81.9°F
Avg summer low
57.6°F
Filter tip
Massachusetts' brief, cool summers mean AC is a luxury, not a necessity — a MERV 8 filter changed once per season is sufficient for your occasional cooling demands. Shop filters →
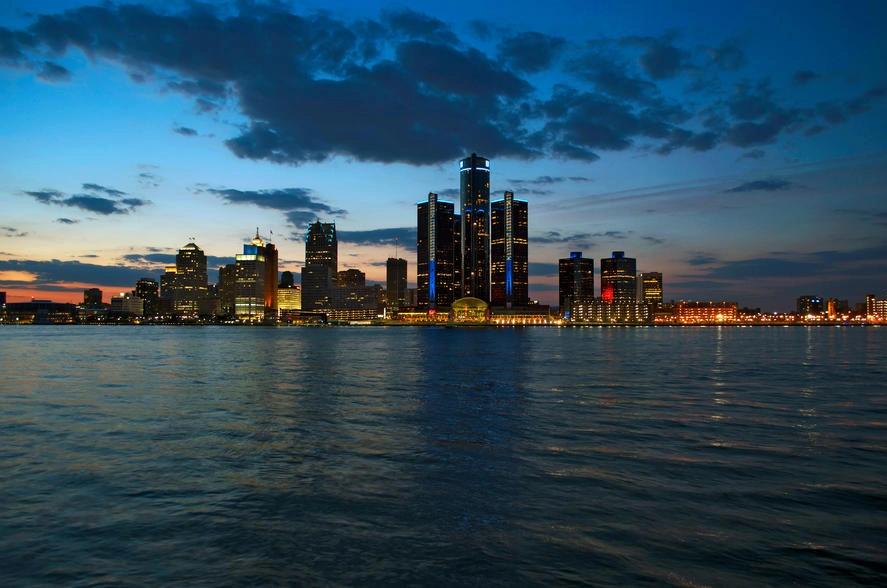
Michigan
Great Lakes · cool summers
Hottest city
Dearborn
Days above 90°F / yr
14
Days above 100°F / yr
0
Avg summer high
82.7°F
Avg summer low
60.2°F
Filter tip
Michigan's Great Lakes climate keeps summers moderate — a MERV 8 filter changed annually works well for your minimal, sporadic cooling usage. Shop filters →
Minnesota
Upper Midwest · brief summers
Hottest city
Minneapolis
Days above 90°F / yr
17
Days above 100°F / yr
1
Avg summer high
83.7°F
Avg summer low
62.8°F
Filter tip
Minnesota's short, cool summers mean AC runs sparingly — a MERV 8 filter changed twice yearly is more than adequate for your light seasonal cooling. Shop filters →
Mississippi
Deep South · intense humidity
Hottest city
Hernando
Days above 90°F / yr
92
Days above 100°F / yr
12
Avg summer high
93.4°F
Avg summer low
69.0°F
Filter tip
Mississippi's swampy heat and 12 triple-digit days breed aggressive mold growth — a MERV 11 filter changed every 45 days prevents spore accumulation in your constantly-running AC system. Shop filters →
Missouri
Central US · hot humid
Hottest city
Kennett
Days above 90°F / yr
63
Days above 100°F / yr
5
Avg summer high
90.6°F
Avg summer low
68.0°F
Filter tip
Missouri's humid Ozark summers accelerate allergen growth indoors — a MERV 9 filter changed every 60 days captures seasonal pollen and dust mites while your AC battles the heat. Shop filters →
Montana
Rocky Mountains · dry moderate
Hottest city
Billings
Days above 90°F / yr
41
Days above 100°F / yr
3
Avg summer high
86.3°F
Avg summer low
54.2°F
Filter tip
Montana's dry mountain summers generate fine dust particles — a MERV 8 filter changed every 60 days provides efficient capture without restricting airflow in the thin high-elevation air. Shop filters →
Nebraska
Great Plains · windy dry
Hottest city
Scottsbluff
Days above 90°F / yr
40
Days above 100°F / yr
3
Avg summer high
86.3°F
Avg summer low
56.0°F
Filter tip
Nebraska's plains winds stir up dust and agricultural particulates — a MERV 8 filter changed every 45–60 days captures windblown debris while maintaining efficient airflow during moderate cooling season. Shop filters →
Nevada
Desert state · extreme heat
Hottest city
Mesquite
Days above 90°F / yr
147
Days above 100°F / yr
100
Avg summer high
105.2°F
Avg summer low
74.3°F
Filter tip
Nevada's scorching 100 days above 100°F make AC non-stop — fine desert sand clogs filters rapidly, so a MERV 8 changed every 30 days is essential for system survival in peak summer heat. Shop filters →
New Hampshire
New England · cool forests
Hottest city
Hudson
Days above 90°F / yr
11
Days above 100°F / yr
0
Avg summer high
80.5°F
Avg summer low
56.4°F
Filter tip
New Hampshire's brief summers mean air conditioning is rarely needed — a basic MERV 8 filter changed once annually is sufficient for your minimal cooling demands. Shop filters →
New Jersey
Mid-Atlantic · moderate summers
Hottest city
Moorestown
Days above 90°F / yr
37
Days above 100°F / yr
1
Avg summer high
87.2°F
Avg summer low
61.7°F
Filter tip
New Jersey's moderate humidity and 37 heat days call for balanced protection — a MERV 9 filter changed every 90 days captures seasonal allergens without unnecessary cost. Shop filters →
New Mexico
Southwest · desert with elevation
Hottest city
Carlsbad
Days above 90°F / yr
105
Days above 100°F / yr
21
Avg summer high
94.6°F
Avg summer low
66.5°F
Filter tip
New Mexico's arid high-desert terrain produces fine silica dust and 21 triple-digit days — a MERV 8 filter changed every 40 days prevents mineral buildup while your AC handles relentless heat. Shop filters →
New York
Northeast · variable microclimates
Hottest city
New York
Days above 90°F / yr
17
Days above 100°F / yr
0
Avg summer high
83.2°F
Avg summer low
67.4°F
Filter tip
New York's moderate 17 heat days and variable humidity mean seasonal AC use — a MERV 8 filter changed every 90–120 days balances cost with adequate allergen control. Shop filters →
North Carolina
Southeast · humid temperate
Hottest city
Concord
Days above 90°F / yr
55
Days above 100°F / yr
2
Avg summer high
89.3°F
Avg summer low
67.3°F
Filter tip
North Carolina's humid Piedmont summers create prime mold conditions — a MERV 10 filter changed every 60 days combats spores and dust mites while your AC cools through the muggy season. Shop filters →
North Dakota
Great Plains · cool short summers
Hottest city
Williston
Days above 90°F / yr
22
Days above 100°F / yr
2
Avg summer high
81.7°F
Avg summer low
53.2°F
Filter tip
North Dakota's brief cooling season and 22 heat days mean AC is rarely pushed hard — a MERV 8 filter changed once per season is sufficient. Shop filters →
Ohio
Midwest · humid continental
Hottest city
Dayton
Days above 90°F / yr
31
Days above 100°F / yr
1
Avg summer high
85.8°F
Avg summer low
65.1°F
Filter tip
Ohio's moderate summers with light humidity mean balanced filter needs — a MERV 8 filter changed every 90 days provides cost-effective protection during mild cooling season. Shop filters →
Oklahoma
South-central · extreme heat days
Hottest city
Lawton
Days above 90°F / yr
96
Days above 100°F / yr
27
Avg summer high
95.3°F
Avg summer low
70.0°F
Filter tip
Oklahoma's brutal 27 triple-digit days and 96 heat days strain AC systems hard — a MERV 8 filter changed every 30–40 days prevents dust buildup and maintains airflow during relentless summer. Shop filters →
Oregon
Pacific Northwest · mild dry
Hottest city
Medford
Days above 90°F / yr
54
Days above 100°F / yr
9
Avg summer high
87.7°F
Avg summer low
55.4°F
Filter tip
Oregon's dry summers with occasional heat spikes mean light cooling — a MERV 8 filter changed every 90–120 days works well for your minimal AC demands. Shop filters →
Pennsylvania
Mid-Atlantic · moderate humid
Hottest city
Philadelphia
Days above 90°F / yr
32
Days above 100°F / yr
1
Avg summer high
86.2°F
Avg summer low
68.3°F
Filter tip
Pennsylvania's muggy summers in urban areas breed indoor allergens — a MERV 9 filter changed every 60–90 days manages humidity-driven mold while your AC keeps the city heat at bay. Shop filters →
Rhode Island
New England · coastal breeze
Hottest city
Warwick
Days above 90°F / yr
9
Days above 100°F / yr
0
Avg summer high
80.6°F
Avg summer low
62.0°F
Filter tip
Rhode Island's cool coastal summers mean minimal AC demand — a basic MERV 8 filter changed annually is plenty for your light occasional cooling needs. Shop filters →
South Carolina
Southeast · humid subtropical
Hottest city
Columbia
Days above 90°F / yr
95
Days above 100°F / yr
12
Avg summer high
93.5°F
Avg summer low
71.9°F
Filter tip
South Carolina's sweltering 95 days above 90°F and 12 triple-digit days breed intense mold and dust mites — a MERV 11 filter changed every 45–60 days protects indoor air quality during constant AC use. Shop filters →
South Dakota
Great Plains · variable dry
Hottest city
Pierre
Days above 90°F / yr
37
Days above 100°F / yr
6
Avg summer high
85.4°F
Avg summer low
59.2°F
Filter tip
South Dakota's plains dust with 6 triple-digit days means moderate cooling strain — a MERV 8 filter changed every 60–90 days balances efficiency with fine-particle capture. Shop filters →
Tennessee
Southeast · humid subtropical
Hottest city
Millington
Days above 90°F / yr
70
Days above 100°F / yr
4
Avg summer high
91.2°F
Avg summer low
70.4°F
Filter tip
Tennessee's 70 heat days and humid river valleys breed mold proliferation — a MERV 10 filter changed every 60 days manages spores and dust mites through the long, sweaty cooling season. Shop filters →
Texas
Lone Star state · intense heat
Hottest city
Rio Grande City
Days above 90°F / yr
166
Days above 100°F / yr
44
Avg summer high
98.1°F
Avg summer low
75.3°F
Filter tip
Texas' brutal 166 heat days and 44 triple-digit days demand aggressive cooling — a MERV 8 changed every 30 days is essential to prevent dust and mineral buildup choking your non-stop AC system. Shop filters →
Utah
Southwest · desert high elevation
Hottest city
St. George
Days above 90°F / yr
116
Days above 100°F / yr
46
Avg summer high
98.7°F
Avg summer low
71.6°F
Filter tip
Utah's desert and 46 days above 100°F require efficient cooling — fine red rock dust clogs filters rapidly, so a MERV 8 changed every 30–45 days prevents mineral accumulation choking your AC. Shop filters →
Vermont
New England · mountain cool
Hottest city
Essex
Days above 90°F / yr
6
Days above 100°F / yr
0
Avg summer high
78.9°F
Avg summer low
57.2°F
Filter tip
Vermont's brief, cool summers mean AC is rarely used — a basic MERV 8 filter changed annually is more than sufficient for your minimal cooling demands. Shop filters →
Virginia
Mid-Atlantic · moderate humid
Hottest city
Suffolk
Days above 90°F / yr
46
Days above 100°F / yr
1
Avg summer high
88.4°F
Avg summer low
66.2°F
Filter tip
Virginia's moderate heat with coastal humidity creates mold and pollen hotspots — a MERV 9 filter changed every 60–90 days manages allergens while your AC handles summer heat. Shop filters →
Washington
Pacific Northwest · dry interior
Hottest city
Pasco
Days above 90°F / yr
45
Days above 100°F / yr
5
Avg summer high
88.1°F
Avg summer low
54.5°F
Filter tip
Washington's dry interior summers with 45 heat days mean moderate cooling demand — a MERV 8 filter changed every 60–90 days provides adequate protection for your seasonal AC use. Shop filters →
West Virginia
Appalachian · cool mountains
Hottest city
Huntington
Days above 90°F / yr
28
Days above 100°F / yr
0
Avg summer high
86.0°F
Avg summer low
64.4°F
Filter tip
West Virginia's mountain elevation keeps summers mild with just 28 heat days — a MERV 8 filter changed twice per year is sufficient for your light, infrequent cooling needs. Shop filters →
Wisconsin
Upper Midwest · cool lakes
Hottest city
West Allis
Days above 90°F / yr
16
Days above 100°F / yr
0
Avg summer high
82.4°F
Avg summer low
61.1°F
Filter tip
Wisconsin's Great Lakes influence keeps summers cool with just 16 heat days — a MERV 8 filter changed annually is sufficient for your minimal AC demands throughout the year. Shop filters →
Wyoming
Rocky Mountains · high elevation
Hottest city
Riverton
Days above 90°F / yr
30
Days above 100°F / yr
1
Avg summer high
84.8°F
Avg summer low
51.2°F
Filter tip
Wyoming's high-elevation mountain climate with just 30 heat days means minimal cooling — a MERV 8 filter changed twice yearly balances efficiency with adequate protection for sparse AC usage. Shop filters →
Detailed Findings & Methodology
Of the hottest cities in each state, Yuma, AZ boasts the highest number of days per year with temperatures above 90℉, at 185 days or over half the year. Yuma also has an astounding 124 days per year with temperatures over 100℉. On average, the hottest cities have 59 days per year with temperatures over 90℉ and 13 days per year with temperatures over 100℉.
Summer high and low temperatures also vary substantially among the hottest cities. On average across all 50 cities, the average summer high temperature is 89℉ and the average summer low temperature is 65℉. However, some cities have far hotter days. Yuma’s average high in summer is 108℉, while the average high summer temperature in Fairbanks, AK is just 71℉. Besides more moderate temperature during the day, northern states also tend to have cooler nights and mornings during the summer. This is reflected in the average summer low temperatures. The average low temperature in the summer in Fairbanks is a brisk 49℉, while summer temperatures typically don’t fall much below 80℉ in Indio, CA.
To find the hottest city in every state, researchers at Filterbuy analyzed the latest data from the National Oceanic and Atmospheric Administration (NOAA) National Centers for Environmental Information’s (NCEI) Climate Normals dataset. The Climate Normals are three-decade averages of climatological variables, including temperature and precipitation. Within each state, the researchers ranked cities according to the greatest long-term average number of days per year when the temperature is 90℉ or higher. Researchers also calculated the long-term average number of days per year when the temperature is 100℉ or higher, the long-term average high temperature in summer, and the average long-term low temperature in summer. Only cities with populations of 10,000 or greater were considered in the analysis.