May 5, 2026

By David Heacock
Housing prices in the U.S. have been on a steep upward trajectory over the last year and are continuing to climb. Unusual economic conditions, strong demand for homes, and record low inventory have made the residential real estate market highly competitive and sent prices skyrocketing. According to data from the Department of Housing and Urban Development, the average sale price of a home in the U.S. rose nearly 16% between the second quarter of 2020 and second quarter of 2021—one of the greatest year-over-year increases on record.
The rapid appreciation in home values has drawn greater attention to issues around housing affordability. More would-be homebuyers are being priced out of the market in many locations, and the rise in prices extends into the rental market as well. And while builders see an opportunity to expand housing stock, supply chain breakdowns and labor shortages have made it difficult to build quickly.
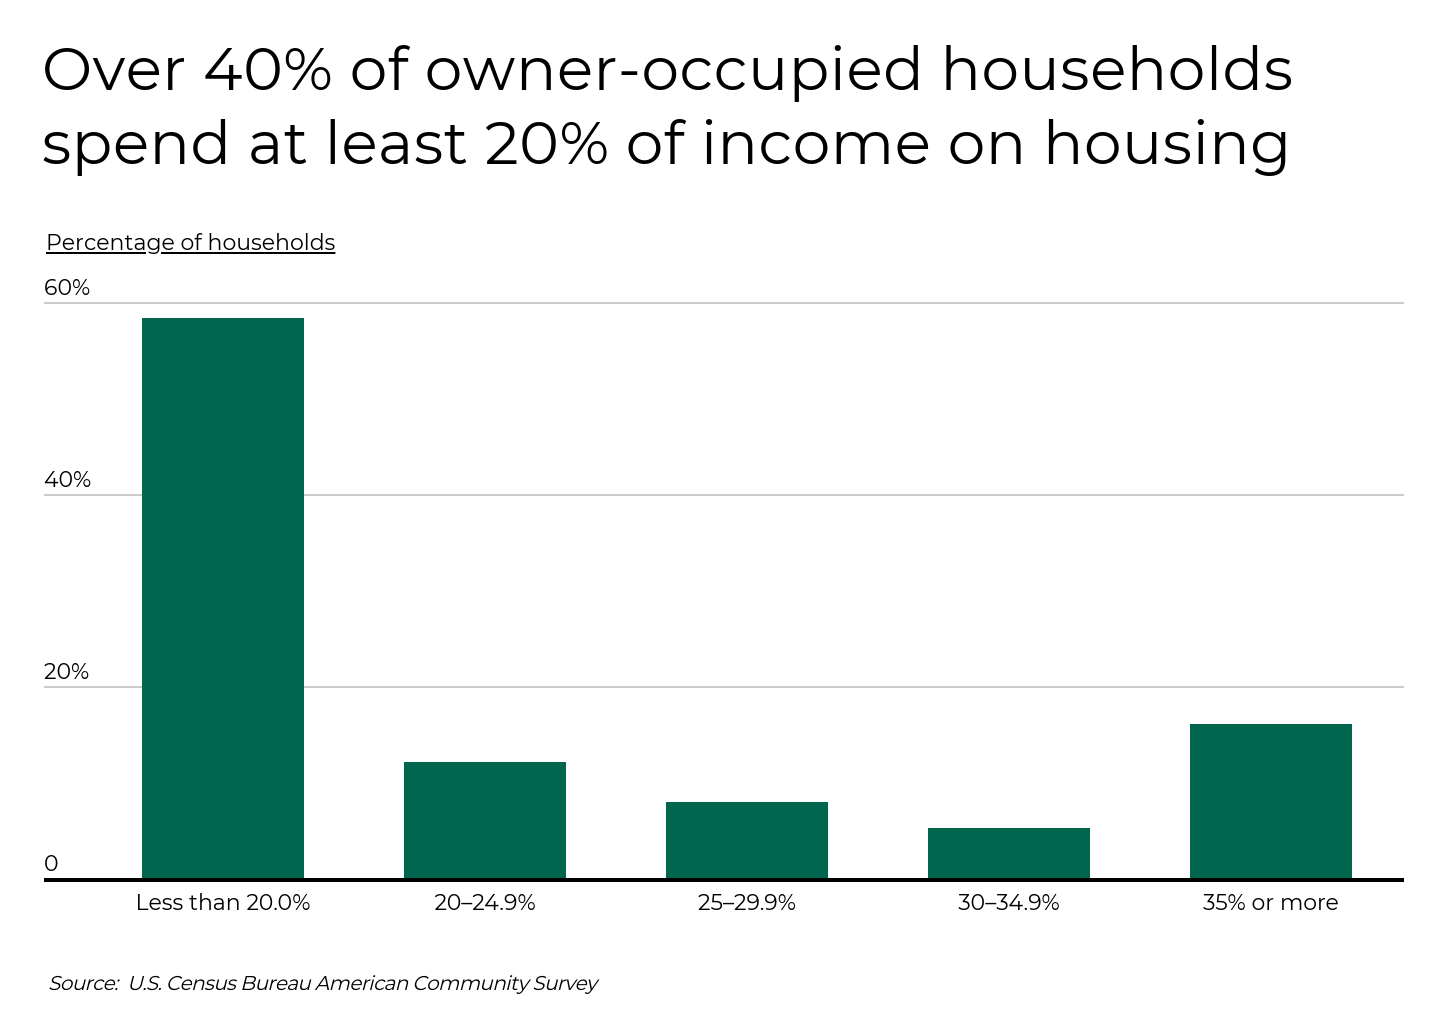
Housing affordability matters because housing is by far most households’ largest expense. As housing costs increase, families have less available to spend on other items that may also be necessities. The U.S. government defines housing affordability according to the percentage of income spent on housing, setting the threshold for affordability at 30% for the purposes of federal housing programs. But for most people, the 30% standard is just a rule of thumb: some households who spend a lower percentage may still be financially constrained if they have other large regular expenses, such as debt payments.
The good news is that a majority (58.3%) of owner-occupied households currently spend less than 20% of their income on housing, according to the U.S. Census Bureau. However, this leaves more than 40% of homeowners spending above that amount, with more than one in five homeowners spending 30% or higher.
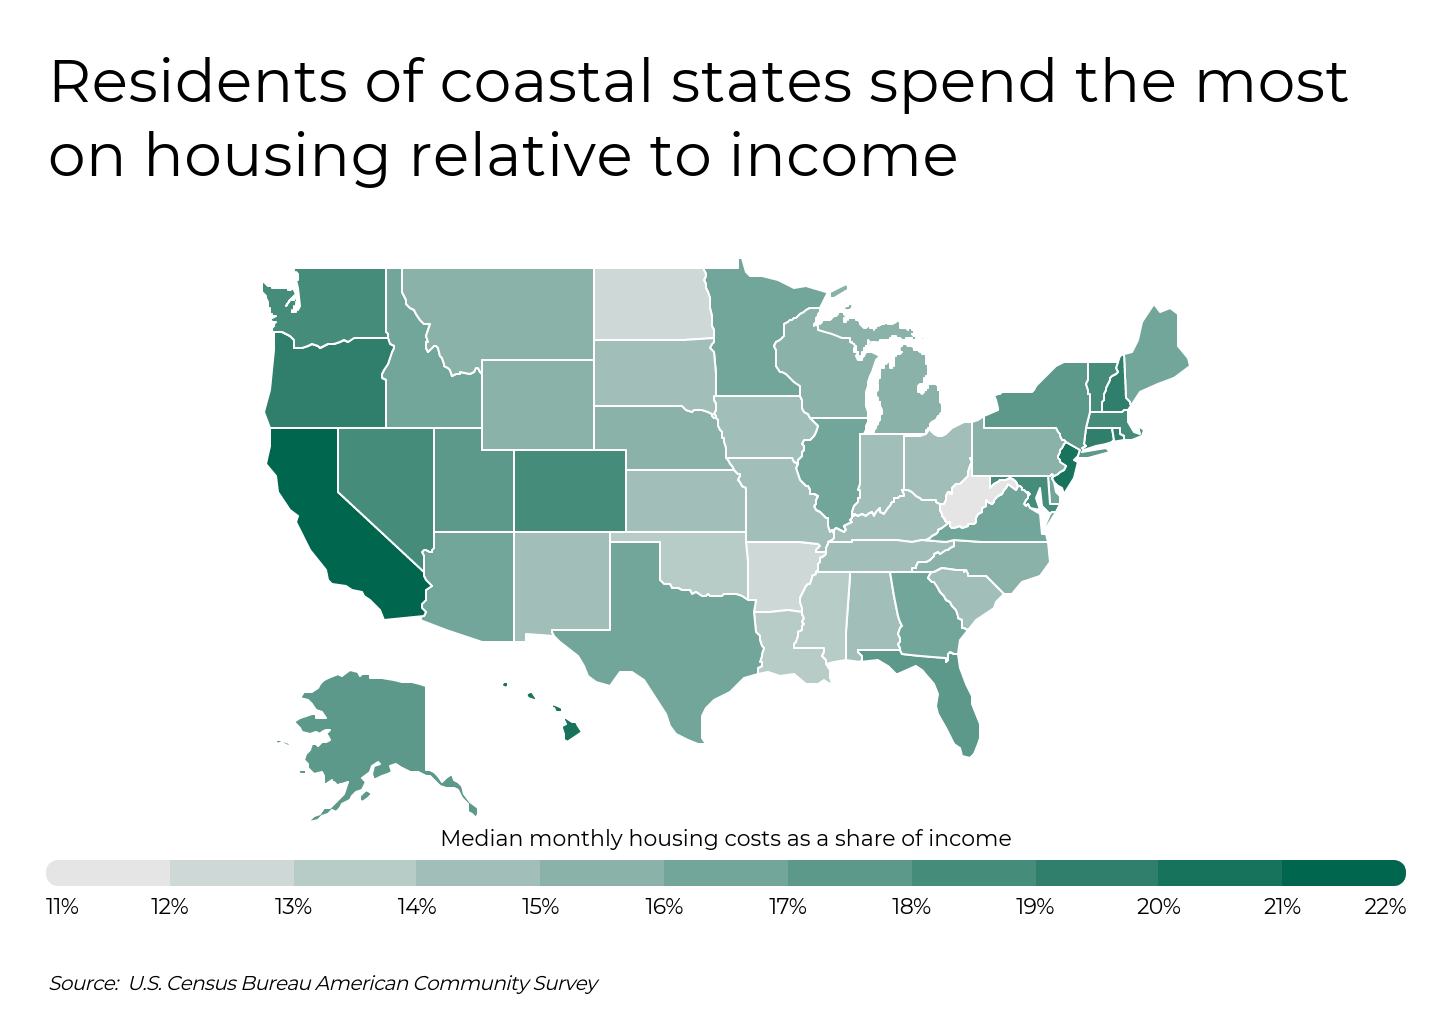
But one of the other challenges with housing affordability is that the severity of the issue is highly location-specific. Locations with higher housing prices, lower typical income levels, or both, may have more residents who struggle with housing affordability. States and localities may also vary in the laws or regulations they have in place affecting how easy it is to add housing supply.
As a result of these factors, homeowners in states on the East and West Coasts tend to spend the greatest share of their income on housing. The leading state is California, where median monthly housing costs as a proportion of median monthly income is 21.1%. At the other end of the spectrum, states in the Midwest and South spend much less, led by West Virginia where the median monthly housing cost is 11.1% of income. Similar patterns hold at the local level, with many of the metro areas where housing takes up the greatest share of income being found in California.
TRENDING Filterbuy’s MERV 13 air filters trap 98% of airborne particles, including mold, bacteria, and those that carry viruses and will stop mold, fungus, or mildew from growing in your home. Consider replacing your home air filters today.
The data used in this analysis is from the U.S. Census Bureau, Zillow, and the U.S. Bureau of Economic Analysis. To determine the locations where homeowners spend the most on housing, researchers at Filterbuy calculated median monthly housing costs as a share of median monthly income for each location. In the event of a tie, the location with the higher median monthly housing costs was ranked higher.
Here are the cities where homeowners spend the most on housing relative to income.
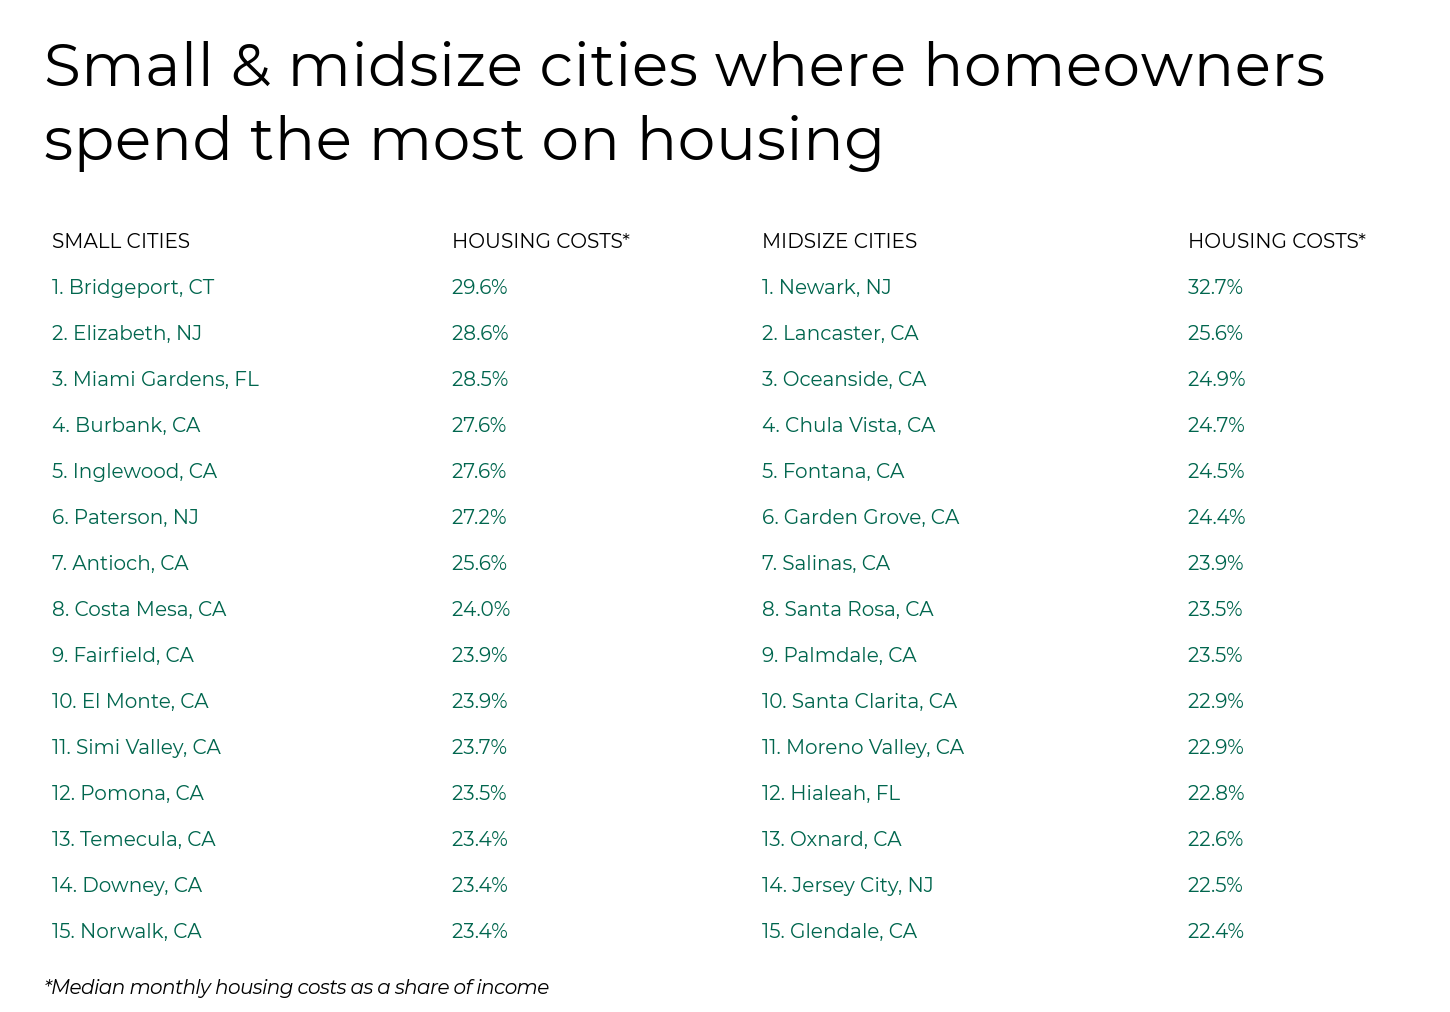

Photo Credit: Andriy Blokhin / Shutterstock
Median monthly housing costs as a share of income: 19.6%
Median monthly housing costs: $1,526
Median monthly household income: $7,774
Current median home price: $449,788
Overall cost of living: +5.2%
Photo Credit: marchello74 / Shutterstock
Median monthly housing costs as a share of income: 19.7%
Median monthly housing costs: $1,528
Median monthly household income: $7,775
Current median home price: $299,929
Overall cost of living: +2.8%
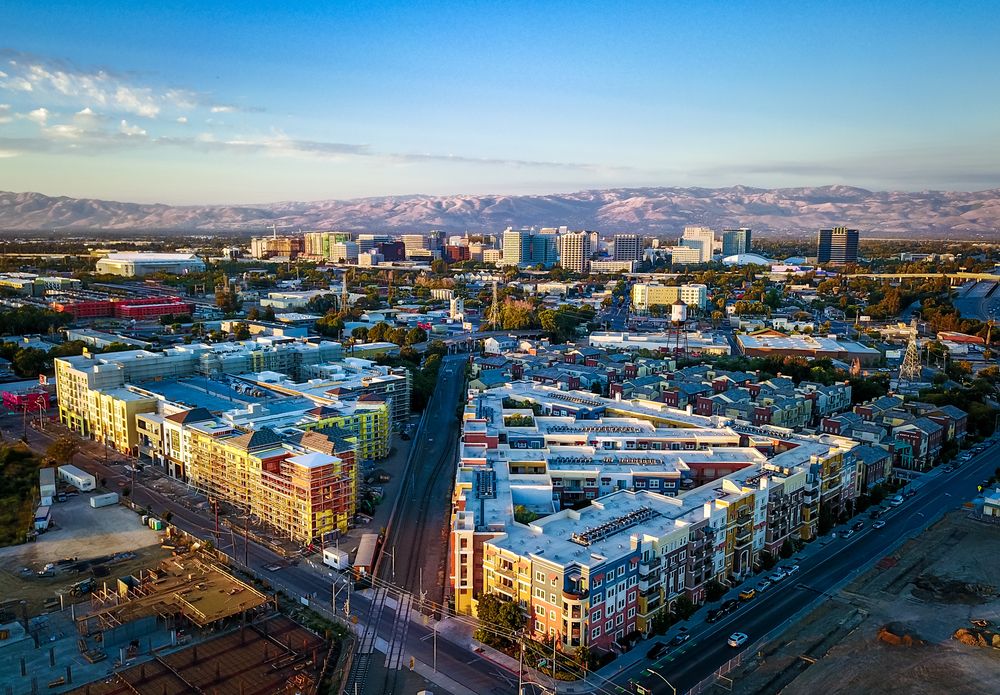
Photo Credit: Uladzik Kryhin / Shutterstock
Median monthly housing costs as a share of income: 19.8%
Median monthly housing costs: $2,509
Median monthly household income: $12,659
Current median home price: $1,286,076
Overall cost of living: +26.7%

Photo Credit: Bob Pool / Shutterstock
Median monthly housing costs as a share of income: 19.9%
Median monthly housing costs: $1,746
Median monthly household income: $8,783
Current median home price: $552,071
Overall cost of living: +5.0%
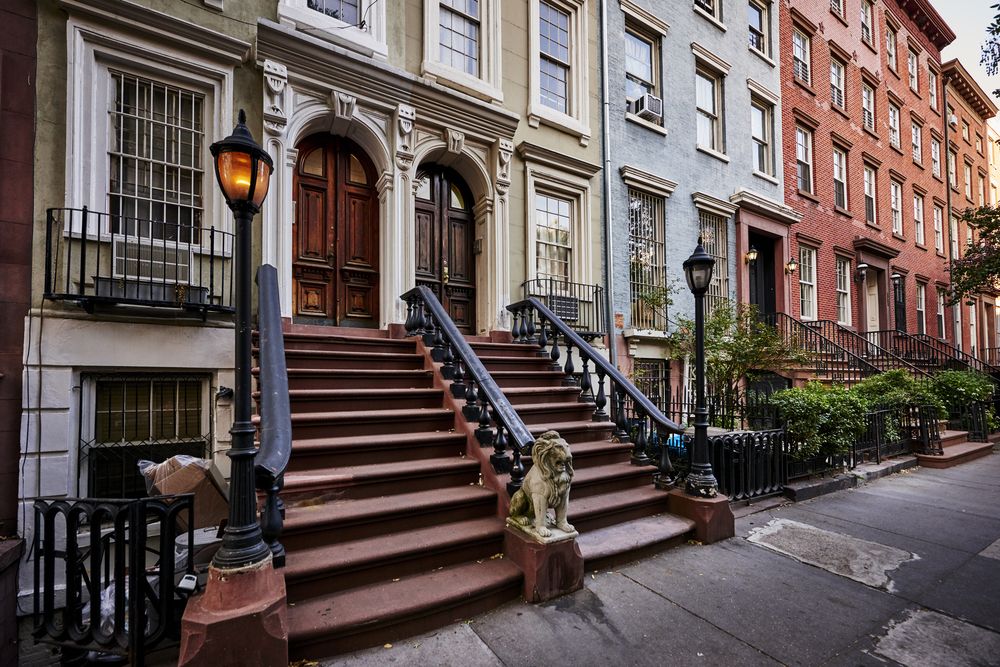
Photo Credit: Brian Goodman / Shutterstock
Median monthly housing costs as a share of income: 20.3%
Median monthly housing costs: $1,812
Median monthly household income: $8,909
Current median home price: $660,230
Overall cost of living: +25.7%
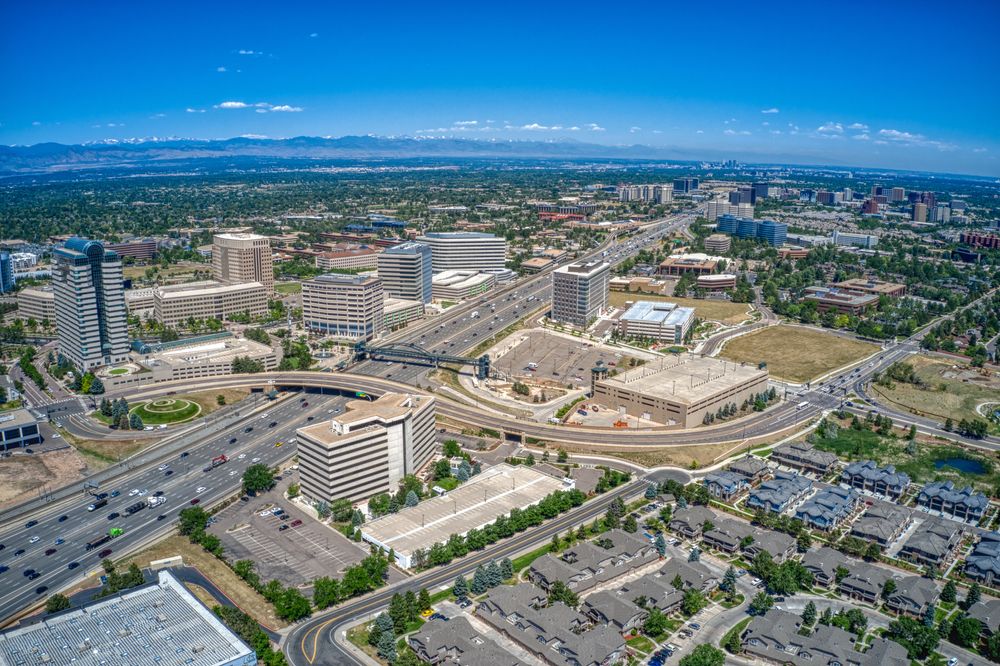
Photo Credit: Jacob Boomsma / Shutterstock
Median monthly housing costs as a share of income: 20.5%
Median monthly housing costs: $1,498
Median monthly household income: $7,322
Current median home price: $447,686
Overall cost of living: +4.2%

Photo Credit: evenfh / Shutterstock
Median monthly housing costs as a share of income: 20.6%
Median monthly housing costs: $1,164
Median monthly household income: $5,645
Current median home price: $259,398
Overall cost of living: -6.9%

Photo Credit: stellamc / Shutterstock
Median monthly housing costs as a share of income: 21.0%
Median monthly housing costs: $1,347
Median monthly household income: $6,400
Current median home price: $326,544
Overall cost of living: -2.5%

Photo Credit: Pete Niesen / Shutterstock
Median monthly housing costs as a share of income: 21.4%
Median monthly housing costs: $2,701
Median monthly household income: $12,638
Current median home price: $1,502,029
Overall cost of living: +34.5%

Photo Credit: Ingus Kruklitis / Shutterstock
Median monthly housing costs as a share of income: 21.5%
Median monthly housing costs: $1,933
Median monthly household income: $8,976
Current median home price: $8,976
Overall cost of living: +18.8%
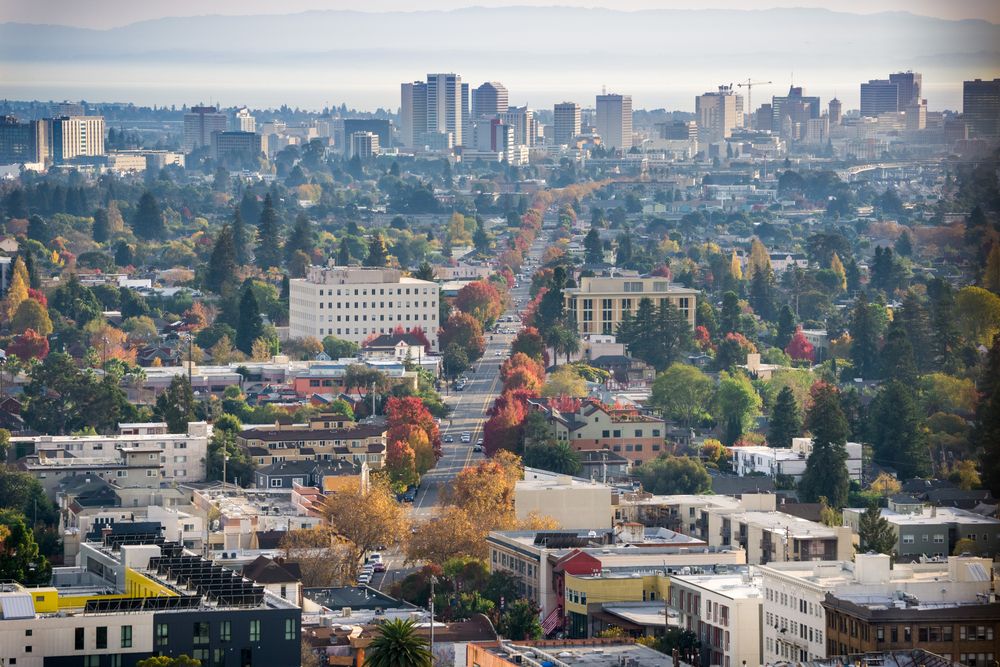
Photo Credit: Sundry Photography / Shutterstock
Median monthly housing costs as a share of income: 21.6%
Median monthly housing costs: $2,253
Median monthly household income: $10,425
Current median home price: $959,760
Overall cost of living: +34.5%
Photo Credit: Lucky-photographer / Shutterstock
Median monthly housing costs as a share of income: 22.0%
Median monthly housing costs: $2,149
Median monthly household income: $9,755
Current median home price: $849,192
Overall cost of living: +17.9%

Photo Credit: John Roman Images / Shutterstock
Median monthly housing costs as a share of income: 22.7%
Median monthly housing costs: $2,095
Median monthly household income: $9,218
Current median home price: $777,598
Overall cost of living: +18.8%

Photo Credit: Just dance / Shutterstock
Median monthly housing costs as a share of income: 23.9%
Median monthly housing costs: $1,313
Median monthly household income: $5,488
Current median home price: $414,625
Overall cost of living: +11.7%

Photo Credit: Sean Pavone / Shutterstock
Median monthly housing costs as a share of income: 25.0%
Median monthly housing costs: $2,286
Median monthly household income: $9,160
Current median home price: $898,692
Overall cost of living: +18.8%
The data used in this analysis is from the U.S. Census Bureau’s 2019: ACS 1-Year Estimates Subject Tables, Zillow’s Housing Data, and the U.S. Bureau of Economic Analysis Regional Price Parities dataset. To determine the locations where homeowners spend the most on housing, researchers calculated the median monthly housing costs as a share of income for each location. In the event of a tie, the location with the higher median monthly housing costs was ranked higher. To improve relevance, only cities with at least 100,000 residents were included. Additionally, cities were grouped into cohorts based on population size: small (100,000–149,999), midsize (150,000–349,999), and large (350,000 or more).