
Brownsville Real-Time AQI Tracker


Get Alerts For Unhealthy AQI In Your Area
When air quality in your area reaches unhealthy levels, we'll send you a quick alert, along with expert tips on how to reduce your exposure.
What's Actually In Brownsville Air Today?
What High AQI Means for Your Lungs in Brownsville
How to Read AQI
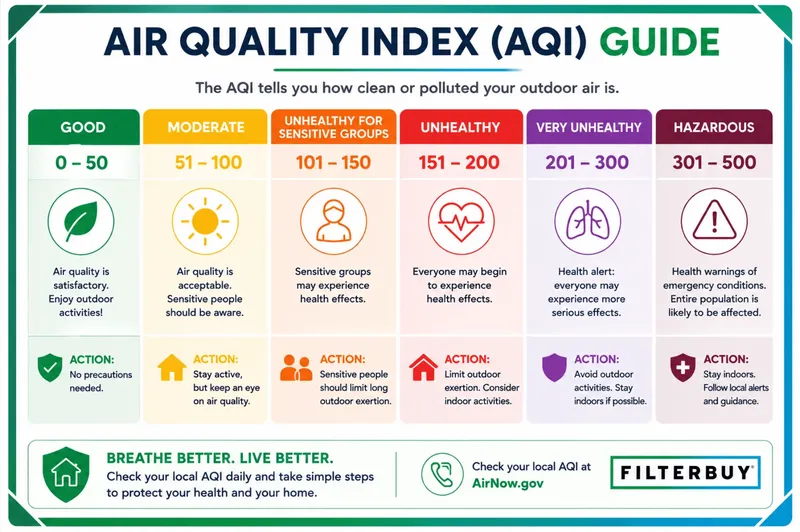
The Air Quality Index (AQI) measures how polluted the air is and how it may affect your health.
0–50 (Good): Air quality is satisfactory.
51–100 (Moderate): Acceptable, but some pollutants may pose minor concerns.
101–150 (Unhealthy for Sensitive Groups)
151–200 (Unhealthy)
201–300 (Very Unhealthy)
301+ (Hazardous)
Moderate
Still okay for most, but if you have asthma or allergies, take it easy and avoid long outdoor workouts.
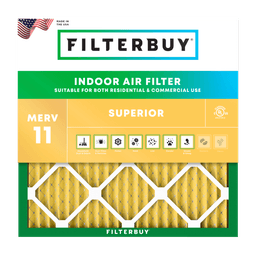
Shop MERV 11 filters→What's the Right Filter for Your AQI Level?
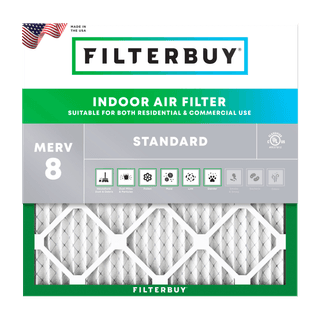
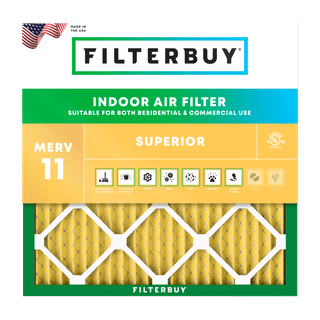
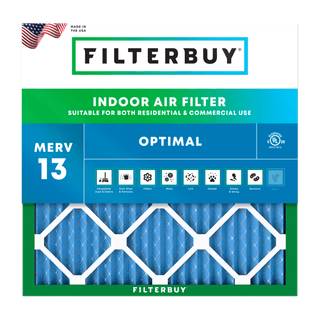



Check Today's Live Real Time Air Quality Index AQI Map in Brownsville, TX Now
By Michelle Wan · Reviewed by David Clark, Licensed HVAC Technician · Published July 23, 2026 · Updated July 23, 2026
TL;DR: The live map below shows the current air quality index (AQI) in Brownsville, TX, updated in real time from official monitors. Brownsville’s air is usually in the "Good" to "Moderate" range, but fine-particle pollution (PM2.5) spikes here more than in most U.S. cities. Check today’s number, then use a well-maintained MERV 13 air filter to keep the outdoor air from becoming your indoor air.
Key Takeaways
Brownsville’s air quality today is shown live on the map above; the number and color update automatically as conditions change.
PM2.5 (fine particles) is Brownsville’s main air-quality concern, not ozone. The Brownsville–Harlingen–Raymondville metro ranked among the worst in the nation for year-round particle pollution in the American Lung Association’s 2026 report.
AQI 0–50 is Good and 51–100 is Moderate; at 101+ (orange or worse), sensitive groups should limit prolonged time outdoors.
Cross-border industry, agricultural burning in Mexico, and humid Gulf air are the biggest drivers of local particle pollution.
A clean MERV 13 filter running in your HVAC can cut indoor PM2.5 by roughly half during a pollution event, according to EPA figures.
What Is the Air Quality in Brownsville Today?
The Filterbuy live air quality map at the top of this page gives you the current, real-time AQI for Brownsville, TX. It reads directly from official monitoring stations in Cameron County and translates several pollutants into one easy number from 0 to 500. A lower number means cleaner air. Watch the color band: green and yellow are routine here, while orange or red means it’s a day to pay attention.
Air quality in Brownsville shifts hour to hour with wind, humidity, traffic, and smoke drifting up from across the border. That’s why a live map beats a daily average. It reflects conditions right now, so you can decide whether to open the windows, go for a run, or keep the kids outside.
One caveat worth knowing: the Rio Grande Valley has relatively few regulatory air monitors, so Brownsville’s official reading leans on a single TCEQ station. Your own street can run higher near an international bridge, a field being burned, or a neighbor’s barbecue, and cleaner a few miles away under a Gulf sea breeze. That gap between the citywide number and the air outside your door is exactly what a live, location-based map helps you see.
Is the Air Quality Bad in Brownsville Today? How to Read the AQI
Whether Brownsville’s air is “bad” today depends on the number and color on the live map. The U.S. AQI scale runs from 0 to 500 and is split into six color-coded categories. Match today’s reading to the row below to know what it means for your family and what to do about it.
For a deeper walkthrough of every category, see how the full U.S. AQI scale works on our live USA AQI map. Bookmark the map above and check it the way you’d check the weather. It takes five seconds.
Why Brownsville’s Air Quality Is Different From the Rest of Texas
Brownsville sits at the southern tip of Texas, in the Rio Grande Valley, right across the river from Matamoros, Mexico and a short drive from the Gulf of Mexico. That location shapes everything about the local air. Brownsville doesn’t have the ozone-and-industry mix of Houston or Dallas. Its signature problem is fine-particle pollution, and it comes from a distinct set of sources.
The numbers are striking. In the American Lung Association’s 2026 “State of the Air” report, the Brownsville–Harlingen–Raymondville metro area was ranked the 2nd worst in the nation for year-round particle pollution (its worst-ever showing, up from 16th the year before) and 4th worst for short-term particle-pollution spikes, with Cameron County earning failing (F) grades on both measures. Ozone, by contrast, earned Cameron County a B grade, which tells you where to focus: particles, not smog.
I pull air-quality numbers for cities across the country every morning, and Brownsville is the one that surprises people. It sits on the Gulf, the sky often looks clean, and ozone stays low, yet its fine-particle count ranks among the worst in the nation. Most of what you breathe here didn’t start in Brownsville; it drifts in. That’s exactly why I trust a live map over a clear-looking sky.
Michelle Wan, Brand Manager & Air Quality Writer, Filterbuy
Four forces drive those particle levels:
Cross-border emissions. Industrial activity and gas flaring around Reynosa and Matamoros, just across the Rio Grande, send fine particles drifting north into Brownsville when the wind lines up.
Agricultural and biomass burning. The Texas Commission on Environmental Quality (TCEQ) regularly forecasts light smoke and aerosols reaching deep South Texas from burning across Mexico and Central America, a seasonal but recurring source.
Gulf humidity. Moist Gulf air over the Lower Rio Grande Valley promotes the chemical formation of fine particulate matter, nudging PM2.5 readings up even on days without an obvious smoke source.
Saharan dust. Each summer, a plume travels roughly 5,000 miles from Africa’s Saharan Air Layer across the Atlantic and settles over the Rio Grande Valley, briefly lifting PM2.5 and PM10 on otherwise clear-looking days.
Add rising industrial investment in the Valley, and Brownsville’s air quality becomes a genuinely local story, which is why the Brownsville AQI map is worth watching specifically.
When Brownsville’s Air Is Worst: A Season-by-Season Guide
Brownsville’s air is usually cleanest in spring and most burdened in summer, and the culprit shifts with the calendar, so the smart move shifts with it. Here is what tends to drive the local AQI through the year, and when to keep the live map close.
Spring (March–May): usually the clearest air, with one catch. Skies are calmest now, but spring is also peak dry-season crop burning across Mexico and Central America, so a shift to southerly winds can carry smoke north and nudge PM2.5 up.
Summer (June–August): the season to watch. Most summers the Saharan Air Layer carries dust across the Atlantic and settles over the Rio Grande Valley in June and July, lifting PM10 and PM2.5. One 2022 outbreak was strong enough to push some Gulf Coast monitors past the federal PM2.5 limit. Humid Gulf air forms more fine particles, and heat-driven ozone climbs too, so PM2.5 usually peaks now. Fireworks add a brief July 4th spike; a UTRGV study measured the jump across Brownsville-area towns, though levels stayed within federal limits.
Fall (September–November): mostly a break. Conditions ease as summer heat fades, with the occasional smoke or dust episode as burning and dust seasons wind down.
Winter (December–February): still, cold nights trap pollution. Temperature inversions hold fine particles near the ground, so a clear, still winter morning can read higher than the blue sky suggests.
The people-first takeaway: stock a fresh Filterbuy MERV 13 before summer dust season and spring burning, and check the live map on hot, hazy, or unusually still days, the ones that look fine but aren’t.
Brownsville PM2.5 Today: The Pollutant That Matters Most Here
PM2.5 is fine particulate matter: particles 2.5 microns wide or smaller, about 30 times thinner than a human hair. Because they’re so small, these particles slip past your body’s defenses, travel deep into the lungs, and can enter the bloodstream. In the Brownsville readings we track at Filterbuy, PM2.5 is almost always the pollutant pushing the AQI up, so the “Brownsville PM2.5 today” figure on the map is the one worth watching most.
You can’t see or smell most PM2.5, which is what makes it deceptive. On a hazy, humid Valley afternoon the air can look fine while the fine-particle count is quietly high. The live map reports the actual measured concentration instead of leaving you to judge by eye. When the PM2.5 reading climbs into the orange band or higher, that’s your cue to move activities indoors and lean on filtration. Learn more about what drives bad-air days and how to protect your home.
Who’s Most at Risk, and What to Do on a High-AQI Day
When Brownsville’s AQI reaches 101 or higher (orange, red, or beyond), certain groups feel it first: people with asthma or COPD, those with heart disease, pregnant women, infants and children, and adults over 65. The American Lung Association links particle pollution to asthma attacks, heart attacks, and other serious effects, so a high reading is worth acting on.
Here’s a simple plan for high-AQI days in Brownsville:
Check the map first. Confirm the current number and pollutant before heading out.
Time outdoor activity. Exercise and yard work early, when particle levels are often lower; skip strenuous outdoor exertion when it’s orange or worse.
Keep windows and doors closed to stop outdoor particles from flowing in.
Run your HVAC fan so indoor air keeps cycling through a filter that can actually capture PM2.5.
Watch for symptoms. Coughing, tightness, or eye irritation are signs to head indoors.
This is general guidance, not medical advice; if you have a lung or heart condition, follow your doctor’s personalized plan.
How to Protect Your Indoor Air in Brownsville
Sealing the windows only helps if your indoor air is actually being cleaned, because fine particles still seep in through gaps and doors. After more than a decade of building filters in the USA and shipping them to millions of homes, we have learned that indoor filtration is the step most Brownsville homeowners overlook. The most effective everyday defense most Brownsville homes already have is the HVAC system paired with the right filter. The EPA advises upgrading to a high-efficiency filter and running the fan continuously, which can cut indoor PM2.5 by roughly half during a pollution event.
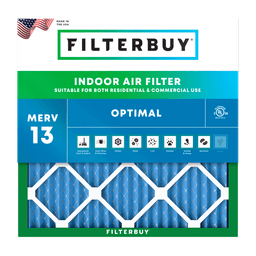
A MERV 13 filter is the rating the EPA points to for fine particles and smoke. It captures at least 50% of the smallest tested particles (0.3–1.0 micron) and far more of the larger ones, exactly the PM2.5 fraction that dominates Brownsville’s air. Most modern systems can run MERV 13, but confirm your equipment can handle it, and replace it on schedule; a clogged filter chokes airflow. If your older system can’t take MERV 13, MERV 11 is the next-best step up. See our breakdown of MERV ratings for high-AQI days.
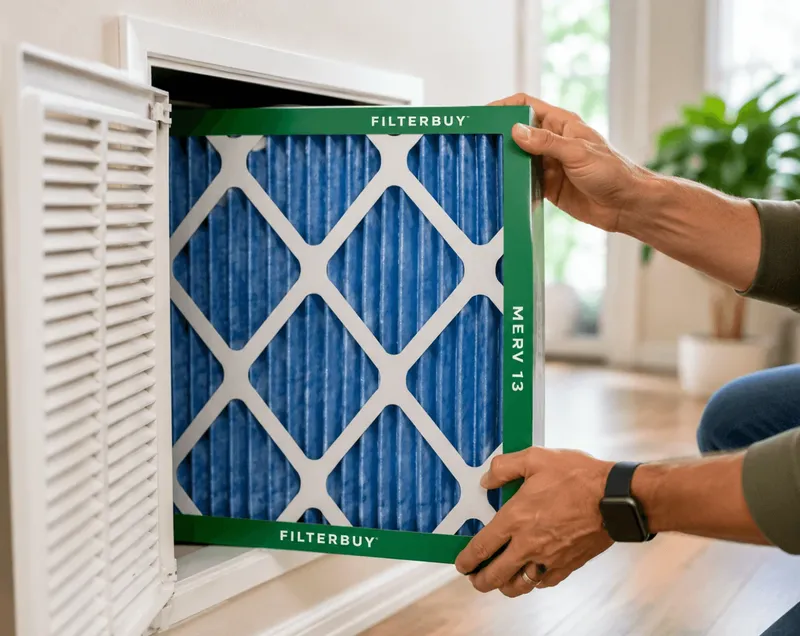
A MERV 13 is the right filter for Brownsville’s fine particles, but it only does its job when it fits tightly and gets changed on time. A loose or clogged filter lets PM2.5 ride right past it.
David Clark, Licensed HVAC Technician, Filterbuy HVAC Solutions
Confirm your HVAC can handle a higher-MERV filter before upgrading, and replace it on schedule.
Filterbuy makes pleated MERV 13 filters in the USA, in 600+ standard sizes plus custom cuts, shipped fast, free, and factory-direct, and auto-delivery means a fresh filter shows up before your old one gives out. Find your filter size and shop MERV 13 →
Supporting Statistics
Three figures put Brownsville’s air in context, all from federal or national health authorities:
2nd worst in the U.S. Brownsville–Harlingen–Raymondville ranked second-worst in the nation for year-round PM2.5 pollution in 2026, a record low. Cameron County earned a failing grade.
Source: American Lung Association, “State of the Air” 2026
2–5× more polluted indoors. Americans spend about 90% of their time indoors. The EPA reports some pollutants run two to five times higher inside than out.
Source: U.S. EPA, “Indoor Air Quality”
9.0 µg/m³. In 2024 the EPA tightened the annual PM2.5 limit from 12.0 to 9.0 µg/m³. The stricter cap targets heart attacks and premature deaths from soot.
Source: U.S. EPA, “NAAQS for PM”
Brownsville Air Quality FAQ
7 Brownsville Air Quality Resources Worth Bookmarking
These seven resources help you check Brownsville’s air in real time, choose the right filter, and verify every number against official data. The first four are Filterbuy tools and guides; the last three are the authorities this page cites.
Check Live Air Quality for Any U.S. City in Seconds
The Filterbuy Live USA AQI Map shows real-time, color-coded air quality nationwide. Search by city or ZIP, and compare Brownsville with nearby Texas metros like Houston and San Antonio.
Find Out Exactly Why Today’s Air Turned Bad
Filterbuy’s Why Is the Air Quality Bad Today? guide breaks down the three usual causes: wildfire smoke, ground-level ozone, and trapped pollution. It helps you tell a single bad afternoon apart from a bad week.
Decode MERV Ratings Before You Buy a Filter
The All About MERV Ratings chart explains what MERV 8, 11, and 13 each capture in plain English. Use it to match a filter to your home without guessing.
Match Your Filter to Today’s AQI
Filterbuy’s high-AQI filter guide tells you which MERV rating to run as the air quality climbs. It turns a red map into one clear next step.
See Brownsville’s Official Air Quality Grade
The American Lung Association’s State of the Air report grades Cameron County on ozone and particle pollution using EPA-verified data. It is the authority behind Brownsville’s second-worst-in-the-nation ranking for year-round particle pollution.
Get the EPA’s Official Playbook for Smoky Days
The EPA’s “Reduce Your Smoke Exposure” guidance recommends running a MERV 13 filter with the fan on continuously to cut indoor fine particles. It is the federal source behind this page’s filtration advice.
Read Texas’s Official Air Quality Forecast
The Texas Commission on Environmental Quality (TCEQ) daily forecast flags PM2.5, ozone, and smoke for the Brownsville–McAllen region a few days ahead. Check it to plan the week, not just the hour.
Glossary
AQI (Air Quality Index): A 0–500 scale that converts pollutant measurements into one color-coded number; higher means more polluted and more hazardous to health.
PM2.5 (Fine Particulate Matter): Airborne particles 2.5 microns or smaller that penetrate deep into the lungs and bloodstream. Brownsville’s primary air-quality concern.
PM10: Coarser particles up to 10 microns, including dust and pollen.
Ozone (O₃): A gas formed when pollutants react in sunlight (“smog”); a summer issue statewide but comparatively low in Cameron County.
MERV 13: A high-efficiency residential air-filter rating; the EPA’s recommended level for capturing fine particles and smoke in home HVAC systems.
TCEQ: The Texas Commission on Environmental Quality, the state agency that monitors and forecasts Texas air quality.
Cameron County: The Texas county where Brownsville is located; its monitors supply much of the local AQI data.
Sources: American Lung Association, “State of the Air” 2026, Brownsville–Harlingen–Raymondville; U.S. EPA, “Reduce Your Smoke Exposure” and “Create a Clean Room to Protect Indoor Air”; Texas Commission on Environmental Quality, Today’s Texas Air Quality Forecast. Air-quality data on the map is drawn from official monitoring networks and updated in real time.
About the author: Michelle Wan is Filterbuy’s Brand Manager and Air Quality Writer (B.A., University of California, Santa Cruz), translating MERV ratings, filtration, and HVAC efficiency into plain-English advice for homeowners. This article was reviewed for technical accuracy by David Clark, a Licensed HVAC Technician with Filterbuy HVAC Solutions. Filterbuy is a family-owned American manufacturer that has built air filters in the USA since 2013, with factories in Alabama, Florida, Pennsylvania, and Utah, offering 600+ sizes plus custom filters shipped factory-direct.