When air quality in your area reaches unhealthy levels, we'll send you a quick alert, along with expert tips on how to reduce your exposure.
The Air Quality Index (AQI) measures how polluted the air is and how it may affect your health.
0–50 (Good): Air quality is satisfactory.
51–100 (Moderate): Acceptable, but some pollutants may pose minor concerns.
101–150 (Unhealthy for Sensitive Groups)
151–200 (Unhealthy)
201–300 (Very Unhealthy)
301+ (Hazardous)
Still okay for most, but if you have asthma or allergies, take it easy and avoid long outdoor workouts.
Shop MERV 11 filters→
Don't take your San Antonio air for granted. By mid-afternoon today, the haze over Loop 410 can carry particles too small to see, whether that's wildfire smoke from the Brush Country, ozone baked up by the South Texas sun, or mountain cedar drifting in on east winds out of the Hill Country. Most households here trust their eyes and noses to read the air, but the readings that move the AQI needle are invisible. The live map below pulls the current Bexar County reading. Refresh it whenever conditions feel off.
Today's reading. The live map at the top of this page updates hourly from Bexar County monitoring stations.
Wildfire smoke. PM2.5 in the dominant pollutant column is the smoke signal. Shut windows, run MERV 13, and add a HEPA in the bedroom.
Ozone. On Ozone Action Days from June through September, plan outdoor exercise before 9 a.m. or after 6 p.m.
Mountain cedar. Peak counts hit December through February, with the same indoor playbook as smoke days.
Best filter for San Antonio. A properly sized MERV 13, swapped on a written schedule.
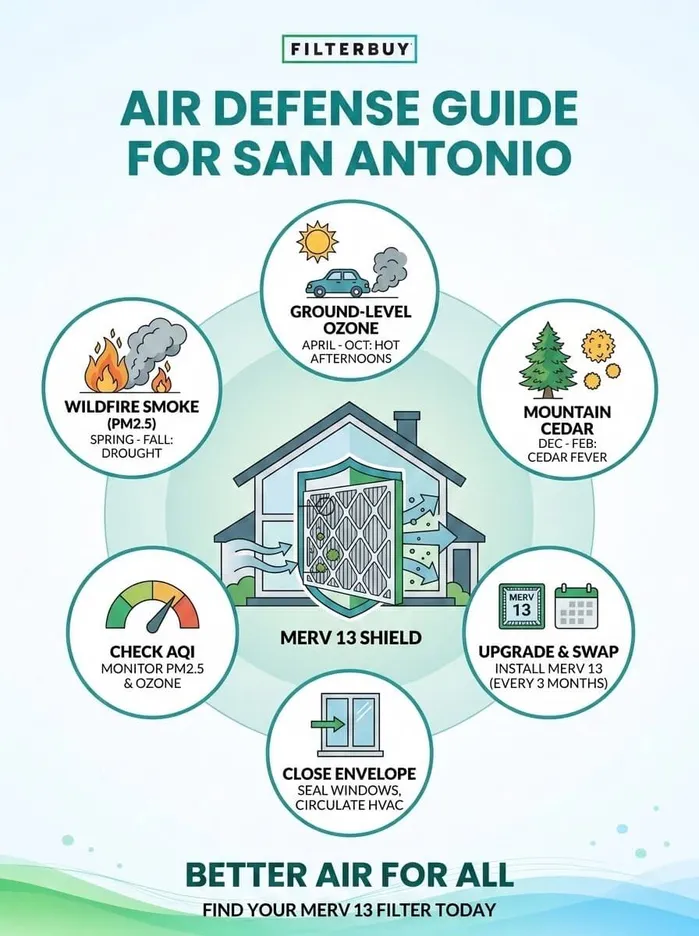
Three drivers split the calendar. Wildfire smoke takes spring through fall, ground-level ozone leads on hot afternoons, and mountain cedar dominates from December through February.
AQI thresholds change who reacts. Once the number tops 101, sensitive groups should cut outdoor time. Above 151, everyone should limit time outside.
Indoor wins start at the filter. A MERV 13 filter, changed on a written schedule and paired with closed windows, is the fastest indoor improvement most San Antonio homes can make.
Mountain cedar is a winter-only event concentrated in the Texas Hill Country. Cedar season runs mid-December through February, with peak pollen in mid-January, producing the highest pollen counts of any pollinating plant in Texas.
Live San Antonio AQI updates hourly. The map at the top of this page reflects current Bexar County readings, and a refresh during smoke or ozone events catches the shifts.
The number above is the Air Quality Index, a 0-to-500 scale that rolls ozone, particulate matter, nitrogen dioxide, sulfur dioxide, and carbon monoxide into a single hourly reading for Bexar County. A score of 50 or below is good news. Anything from 51 to 100 is moderate but worth watching. Once the number tops 101, sensitive groups should rein in outdoor time. Children, adults 65 and older, and anyone managing asthma or heart disease feel the change first. At 151 and above, the air is unhealthy for everyone, full stop. For the math behind the scale, the way the Air Quality Index is calculated covers the full breakdown.
San Antonio air pollution rotates between three players, each with its own season.
Wildfire smoke is the spring-through-fall threat. Drought conditions across the Edwards Plateau and the Brush Country send PM2.5 toward Bexar County on south winds. PM2.5 is the fine particulate matter the EPA tracks because it slips past the body's natural filters and lodges in lung tissue. When wildfire smoke reaches San Antonio, the dominant pollutant column on the AirNow map almost always reads PM2.5.
Ground-level ozone takes over from April through October. Hot, sunny afternoons cook nitrogen oxides and volatile organic compounds into ozone, and Bexar County has a long history of 8-hour exceedances. TCEQ-issued Ozone Action Days hit hardest between noon and 8 p.m., particularly along the I-35 corridor, where traffic emissions stack up against the heat.
Mountain cedar runs from December through February. Cedar fever is real, with peak January counts in Austin and San Antonio routinely topping 20,000 grains per cubic meter, more than ten times the AAAAI threshold for very high tree pollen. The highest count ever recorded in San Antonio was 80,000 grains per cubic meter, set in 1982. Most allergy trackers display the San Antonio pollen count more clearly than the AQI itself during cedar season.
The live air quality reading at the top reflects whichever of these is currently in charge. Saharan dust events in July and August can stack on top of any of them.
“In our experience working with San Antonio households, the minute the AirNow needle slides from yellow to orange is when the right filter earns its keep. A properly seated MERV 13 pleated filter, swapped on time and paired with windows actually shut, drops indoor PM2.5 noticeably within hours of an active smoke event. Most homeowners expect the trouble to be outside. They're often surprised that the filter sitting in their return is the real line between Bexar County smoke and what their family breathes tonight.”
— Filterbuy Team
The live map up top tells you what's in the air over Bexar County right now. After years of helping San Antonio households read their AQI right, we've learned that one number rarely covers it. These seven federal, state, and nonprofit sources are what our editorial team keeps open during smoke events, ozone action days, and cedar season. Together, they cover verifying the reading, watching what's coming, and turning the AQI color into specific protective action.
Pro tip: nearly every live air quality app and website ultimately pulls its data from AirNow.gov, the federal interagency air quality feed. We treat it as our authoritative starting point. When a reading you spot somewhere else doesn't line up with AirNow, the federal number is the one to trust.
Source: AirNow.gov Texas state air quality data
In our experience, the city-wide AQI can hide major differences from one San Antonio neighborhood to the next. A reading that looks moderate over Stone Oak can read unhealthy over the South Side during the same afternoon. TCEQ's San Antonio region monitor map gives you the hourly number from the station closest to your home, not the citywide average.
Source: TCEQ San Antonio region air monitoring stations
When the AirNow needle slides into orange or red and households ask what to do tonight, this is the page we send. The EPA walks through closing the envelope, running the right filter, creating a clean room, and choosing the right respirator mask, with vulnerable family members covered first.
Source: EPA wildfires and indoor air quality guide
If you're protecting kids, older parents, or anyone managing asthma, COPD, diabetes, or heart conditions, this is the page we recommend reading first. The CDC's chronic-conditions guide walks through medication preparation, when to consider evacuating, choosing the right air filter, and the indoor steps that matter most when symptoms aren't improving.
Source: CDC wildfire smoke and chronic conditions guide
When the local NWS office posts a red flag warning for South Central Texas, our clock starts. We've learned to use that signal as the cue to prep San Antonio households' filtration plans for the next 24 to 72 hours, depending on wind direction and ignition activity. The live map at the top of this page can't show smoke before it arrives, which is why the NWS Austin/San Antonio fire weather page earns a permanent tab in our editorial workflow.
Source: NWS Austin and San Antonio fire weather forecast
Mountain cedar is one of the most surprising air quality threats in San Antonio because it doesn't show up on the AQI at all. AAAAI runs the only certified pollen counting network in North America, and the closest verified counts to Bexar County come from accredited stations across South Central Texas. We layer this data on top of every cedar-season AQI reading because the AQI alone often misses what's actually setting off symptoms inside your home.
Source: AAAAI National Allergy Bureau pollen station data
Context turns a number into a decision. The American Lung Association's State of the Air report card grades Bexar County across ozone days, year-round particle pollution, and short-term spikes, and lets you compare local performance against other U.S. metros. We pull it whenever a San Antonio customer asks whether today's reading is normal for the season or something worth taking more seriously.
Source: American Lung Association State of the Air Bexar County report card
Three figures we keep close because they shape how seriously our team treats smoke and pollution events in San Antonio.
Texas wildfire footprint. Texas A&M Forest Service tracks every fire response across the state. In 2025, TFS responded to more than 5,000 wildfires that burned roughly 120,000 acres, and that was a below-average year by their own report. Smoke plumes from large Texas fires routinely reach Bexar County on the right wind (Texas A&M Forest Service current wildfire situation).
PM2.5 and the heart. A 2023 American Heart Association study published in Circulation analyzed more than 202,000 heart attack deaths and found the risk of fatal heart attack approximately doubled during 4-day heat waves combined with PM2.5 above 37.5 micrograms per cubic meter. The AHA cites wildfire smoke among the primary sources of fine particulate matter, alongside vehicle exhaust and factory emissions (American Heart Association research on PM2.5 and heart attack risk).
Air pollution and hospital visits. The National Institute of Environmental Health Sciences reports strong associations between PM2.5 exposure and heart disease, respiratory disease, stroke, and lung cancer, with traffic-related air pollution shown to trigger heart attacks within hours of exposure. NIEHS-funded researchers are also studying the chronic and acute health conditions that result from short- and long-term wildfire smoke exposure, with vulnerable populations including children, older adults, and people with pre-existing conditions at greatest risk (NIEHS Air Pollution and Your Health fact sheet).
Here's what years of working with San Antonio households have taught us. The outdoor AQI is only half the story; the other half is whatever your filter is doing right now behind the return grille while you're reading this. Two homes a mile apart in Stone Oak can pull up the same outdoor reading and live with wildly different indoor air.
In one home, the windows stay shut on bad days, the MERV 13 filter goes in on the first of every month, and the kitchen exhaust vents outside the way it should. Clean air pulls through clean ductwork, and the household stops worrying about the map.
A mile away, the windows stay cracked on a 95-degree afternoon, the builder-grade fiberglass filter hasn't been changed since spring break, and the dryer vent is half-clogged with lint. That household imports every problem the outdoor map shows.
The real San Antonio air story plays out inside your walls. Make the invisible visible, and your filter does what your eyes cannot.
If the live map up top is showing yellow or worse, here's the order we recommend tonight.
Check, then act. Open AirNow on your phone, pull up Bexar County, and read the dominant pollutant column. If it's PM2.5 or smoke, you're changing your tactics for the day. If it's ozone, you're changing your timing, with outdoor exercise shifting to early morning or after sundown.
Close the envelope. Shut the windows, close the doors, and switch the HVAC to circulate rather than any auxiliary fresh-air mode.
Upgrade the filter. A MERV 13 pleated filter captures the 0.3-to-1.0 micron particles that make up wildfire smoke. San Antonio housing runs everything from 14x25x1 in older homes to 20x25x4 in newer construction with media cabinets, so size your filter to the actual return.
Run a HEPA in the bedroom. A sealed-room HEPA portable carries the household through overnight smoke events when your HVAC isn't cycling often enough on its own.
Solve sealed spaces. For casitas, garage offices, and converted rooms common in San Antonio, a ductless mini split with a washable filter and recirculate mode does what a window unit cannot.
After manufacturing filters for over a decade and serving more than two million households, what we hear back from San Antonio customers is consistent. The single upgrade that changes how a home feels during cedar season and smoke season is a properly sized MERV 13, swapped on schedule.
Check the live San Antonio AQI map at the top of this page for the current Bexar County reading.
Green or yellow (0 to 100) means the air is acceptable for most activities.
Orange (101 to 150) means sensitive groups should reduce prolonged outdoor exertion.
Red or worse (151 and above) means everyone should limit time outdoors.
It depends on which pollutant is leading today's AQI reading.
If PM2.5 is leading the number, regional wildfire smoke or Saharan dust is the likely cause.
If ozone is leading, hot afternoon sun and traffic emissions are driving the reading.
For pollen, cross-reference the AAAAI National Allergy Bureau station data linked above.
Check the dominant pollutant column on the live map and confirm with your eyes.
PM2.5 above 35 micrograms per cubic meter usually signals smoke or dust.
A hazy horizon, reduced visibility past 3 to 5 miles, or a particulate odor confirms an active smoke event.
Mountain cedar (Ashe juniper) season runs roughly December 15 through February 20, peaking in early-to-mid January.
Use the AAAAI National Allergy Bureau station data for the closest verified pollen counts.
Switch HVAC to circulate, run a MERV 13 filter, and consider a HEPA bedroom purifier during peak weeks.
MERV 13 hits the sweet spot for households dealing with smoke, dust, and pollen.
MERV 8 misses most PM2.5 smoke particles.
MERV 13 captures the 0.3-to-1.0 micron particle range where smoke and dust live, without overworking residential blowers.
MERV 16 and HEPA become options for sealed rooms or whole-home upgrades with compatible equipment.
A few actions cover most households.
Seal the envelope by closing windows, weatherstripping doors, and repairing returns.
Upgrade and change the filter on a written schedule, not when you remember.
Add a sealed-room HEPA purifier for the bedroom or nursery during smoke and cedar episodes.
Yes, by a wide margin.
Ground-level ozone forms when sunlight cooks nitrogen oxides and volatile organic compounds.
Bexar County's TCEQ-issued Ozone Action Days cluster between June and September.
Outdoor exercise before 9 a.m. or after 6 p.m. cuts exposure on action days.
Pollen, smoke, and ozone shift through the calendar in Bexar County. The filter at your return, swapped on schedule, is the quiet defense behind everything else you do. Tell us your filter size, square footage, and any pets or allergies in the household, and we'll match you to a MERV 13 that fits your home, delivered on the schedule you set. The filter on your return is what stands between Bexar County skies and the air your family actually breathes tonight.


