
Garden Grove Real-Time AQI Tracker


Get Alerts For Unhealthy AQI In Your Area
When air quality in your area reaches unhealthy levels, we'll send you a quick alert, along with expert tips on how to reduce your exposure.
What's Actually In Garden Grove Air Today?
What High AQI Means for Your Lungs in Garden Grove
How to Read AQI
The Air Quality Index (AQI) measures how polluted the air is and how it may affect your health.
0–50 (Good): Air quality is satisfactory.
51–100 (Moderate): Acceptable, but some pollutants may pose minor concerns.
101–150 (Unhealthy for Sensitive Groups)
151–200 (Unhealthy)
201–300 (Very Unhealthy)
301+ (Hazardous)
Moderate
Still okay for most, but if you have asthma or allergies, take it easy and avoid long outdoor workouts.
Shop MERV 11 filters→What's the Right Filter for Your AQI Level?


Check Today's Live Real Time Air Quality Index AQI Map in Garden Grove, CA Now
By Michelle Wan, Brand Manager & Air Quality Writer · Reviewed by David Clark, Licensed HVAC Technician · Published: July 31, 2026 · Updated: July 31, 2026
You are heading out along Garden Grove Boulevard, the light looks flat, and you cannot tell whether it is marine layer or something you should not be breathing. One number settles it. The live map above shows Garden Grove's Air Quality Index right now. Filterbuy built this page to turn that number into decisions about your windows and your furnace filter.
TL;DR
Garden Grove's air quality usually falls in the Good to Moderate range on the AQI scale of 0 to 500, and its worst days are driven by wildfire smoke rather than smog. At or below 100, most people can carry on normally. Above 100, sensitive groups should ease up outdoors and run a MERV 13 filter indoors.
Key Takeaways
Garden Grove has no regulatory air monitor inside city limits. The nearest official station sits in neighboring Anaheim.
Read the pin nearest your home, not the citywide average. Our guide to reading an AQI map by ZIP code walks through it.
PM2.5 is the pollutant most likely to spike Garden Grove's AQI. Smoke can lift readings within hours, even from a fire a state away. See what PM2.5 is and why fine particles matter.
Freeways bracket the city on three sides. Homes within 500 feet of SR-22, I-405, or I-5 see traffic pollution a citywide AQI cannot show.
Indoor air follows outdoor air. A rising number on the map is a signal to protect the air inside your home, not only to change outdoor plans.
What Is the Air Quality in Garden Grove Today?
The live map at the top of this page shows the current air quality in Garden Grove right now, refreshed through the day from South Coast AQMD and EPA AirNow data. Garden Grove typically sits between 0 and 100, the Good to Moderate range, though summer ozone and wildfire smoke can push it past that.
How to Read Garden Grove's Air Quality Index
The AQI converts pollutant concentrations into one number from 0 to 500 across six color-coded categories. A value of 100 matches the national health standard, which is why 100 is the number that changes plans. Our guides to what the air quality index is and how the AQI is calculated cover the pollutants behind the scale.
Source: Category ranges and health guidance follow U.S. EPA AirNow AQI Basics.
Where Garden Grove's AQI Number Actually Comes From
Garden Grove has no regulatory air monitor within city limits. The city documents this itself. Its General Plan Air Quality Element places Garden Grove in the Coastal Orange County Source Receptor Area, with the representative monitoring station located in Anaheim. A 2025 city air-quality memo names the Anaheim–Pampas Lane station as the closest one to a West Garden Grove site.
South Coast AQMD blends regulatory monitors with calibrated low-cost sensors and a forecast model. Find your nearest pin on the South Coast AQMD live air quality map rather than accepting a citywide average. Our neighboring Anaheim air quality page draws on the same station, which is why the two cities often move together. Further inland, Irvine air quality usually runs higher on ozone, and our statewide California air quality map tracks every major city in one place.
Why This Page Says Something Different
Most Garden Grove air quality pages publish the same live number with the same generic advice. Filterbuy went looking for what that number leaves out. Three things are worth saying plainly.
We went to the source documents. It confirms Garden Grove has no regulatory monitor, so the headline figure is a neighbor’s reading. Trust the sensor pin nearest your address over the citywide number.
We think the standard smog advice is the wrong instinct here. On this coastal plain the sea breeze carries ozone inland all day, so Garden Grove’s worst readings are usually particle days, not smog days. That points at a MERV 13 filter, not just a closed window.
The research behind our advice was done on this air. The landmark study of children’s lung growth in this basin included Anaheim, the city whose monitor represents Garden Grove. That is unusually close to home for health research, and it is why we read a rising number as a cue about children first.
What Drives Garden Grove's Air Quality
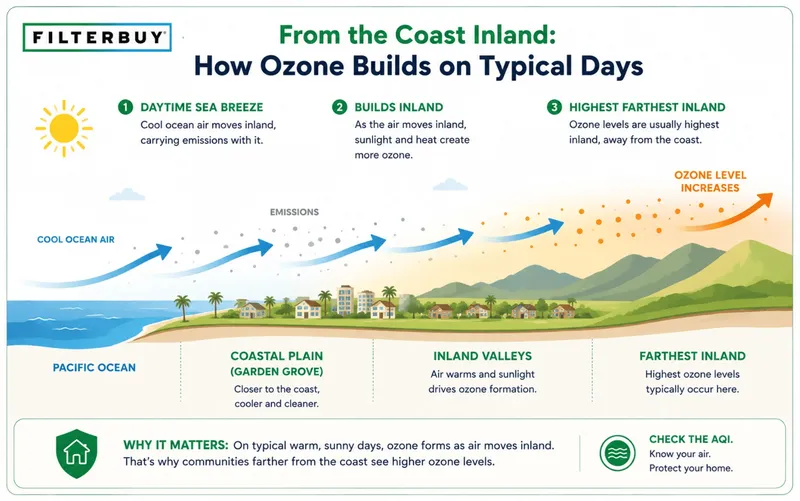
Garden Grove sits on the coastal plain of the South Coast Air Basin, roughly eight miles from the shoreline. Call it six miles on the western edge and ten on the eastern. That position shapes what the city breathes.
Ozone arrives, then leaves. Ozone climbs with distance from the coast and peaks in inland valleys, so Garden Grove's runs below inland Orange County. That is a relative advantage, not a clean bill of health.
Fine particles are the bigger local story. The city's highest AQI days are usually PM2.5 days, as CARB's overview of particulate matter and health details.
Freeways bracket the city. SR-22, the Garden Grove Freeway, bisects the city east to west. I-405, the most heavily traveled freeway in the United States, runs along the western edge, and I-5 sits past the eastern end. CARB's near-roadway guidance sets a 500-foot buffer for homes and schools. A citywide AQI cannot see this layer, so if your home sits inside that buffer, treat the map as your floor rather than your ceiling.
Orange County's Air Quality Report Card
The American Lung Association's "State of the Air" 2026 report covers data from 2022 through 2024.
Source: American Lung Association, State of the Air 2026, Orange County. Grades reflect monitoring data from 2022–2024.
The wider Los Angeles–Long Beach metro area, which includes Garden Grove, ranked worst in the nation for ozone at 159.2 unhealthy ozone days a year. It has held that position in 26 of the report's 27 years.
Is It Safe to Go Outside in Garden Grove Today?
Read today's number against the table above, then check the clock. Ozone builds through the day and peaks on hot, sunny afternoons, so a morning reading can look clean while the same day turns unhealthy by three. Smoke behaves differently and can arrive at any hour. Before an afternoon run or a child's outdoor practice, look at the reading now rather than one you checked at breakfast. Our guide to which AQI levels are unsafe for sensitive groups covers who should adjust plans, and when.
How to Protect Your Indoor Air When Garden Grove's AQI Climbs
Outdoor air becomes indoor air within hours. Four moves:
Close windows during peak hours: midday through late afternoon for ozone, and any time smoke is visible.
Run your HVAC fan so indoor air keeps cycling through the filter instead of sitting still.
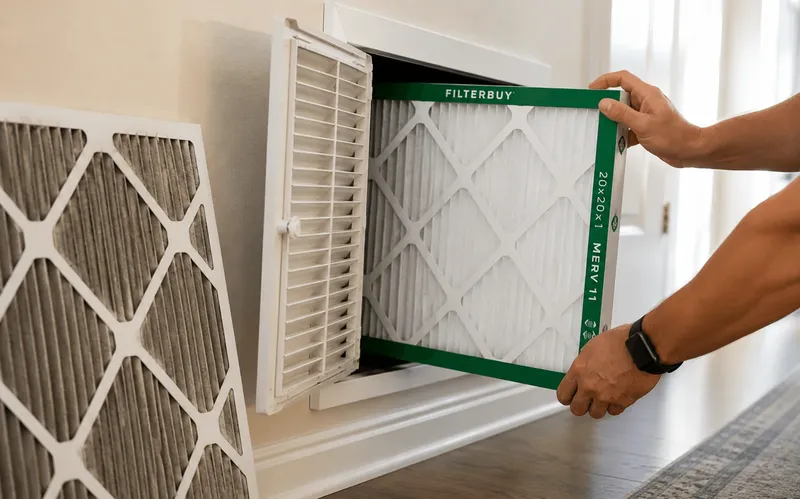
Fit the highest-efficiency filter your system accepts, then confirm airflow stays normal.
Add a portable HEPA unit wherever your family spends the most time.
MERV is the Minimum Efficiency Reporting Value, the industry scale for how much a filter captures. Higher numbers trap smaller particles.
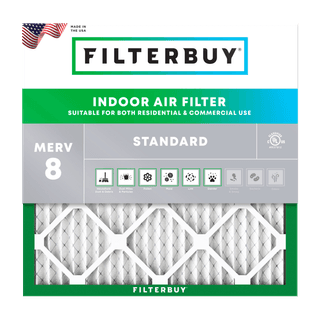
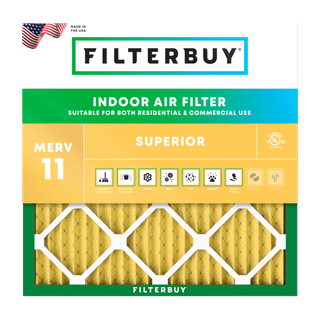
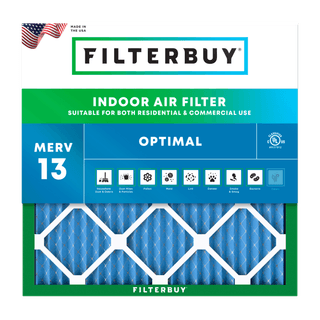
Filterbuy has manufactured pleated filters in the USA for over a decade, factory-direct in 600+ standard sizes plus custom. Our MERV 8, MERV 11, and MERV 13 filters ship free. Odd rack? Use the custom size tool and Auto Delivery. Unsure? See which MERV rating suits a high AQI. When smoke forces you outdoors, N95 masks for wildfire smoke covers what helps.
Garden Grove's Air Quality Year
The pollutant that drives your AQI changes with the season, and so does the right response. This is the local pattern.
No-Burn Day season and rules per South Coast AQMD Check Before You Burn (Rule 445). Ozone and fire-season months are typical local patterns, not fixed dates.
Two Local Mistakes Worth Avoiding
Winter fires are often the problem, not the comfort. South Coast AQMD's Check Before You Burn program issues mandatory No-Burn Days across all of Orange County between November and the end of February, whenever PM2.5 is forecast to run high. The ban covers wood and manufactured logs, indoors and outdoors. Gas fireplaces are not restricted, and households that rely on wood as their only heat source are exempt.
A whole-house fan can undo your filter. Whole-house fans and swamp coolers work by pulling outdoor air straight into the house. On a smoky or high-particle day that bypasses the filter you just fitted. South Coast AQMD advises running air conditioning or an air purifier instead, and leaving the whole-house fan off until the reading drops.
Supporting Statistics: 3 Findings Behind the Advice on This Page
Each figure comes from a U.S. government agency. Each one tests a claim made above.
1. Dirty Air Slows Children's Lung Growth in This Exact Region
Up to 10% slower lung-function growth in Southern California children.
3,000+ students, tracked across 10 years.
10% is the threshold at which medical attention may be needed, per CARB.
Anaheim was a study community, and its monitor is the one that represents Garden Grove.
Source: CARB, USC Children's Health Study
2. Only 4 of 25 South Coast Monitors Met the Federal Ozone Standard
4 of 25 sites met the 0.070 ppm standard in 2020.
The other 21 exceeded it by 9% to 63%.
Extreme nonattainment, the most severe Clean Air Act tier.
2037 attainment deadline. This is decades-long, not seasonal.
Source: CARB, South Coast Ozone Weight of Evidence Analysis
3. A MERV 13 Filter Can Cut Indoor Particles by Up to 95%
MERV 13 to 16: up to 95% reduction in indoor particles.
Fan switched to On: up to 24%, with no filter change at all.
Portable HEPA unit: up to 85%.
Source: U.S. EPA, Indoor Air Filtration factsheet (EPA-452/F-18-005)
What These Three Findings Mean for Your Home
The harm is local. Documented in this basin, in children.
The outdoor fix is slow. Regional, regulatory, and not resolved before 2037.
The filter is yours to control. The EPA puts a number on it: up to 95%.
Check It Yourself: 7 Official Sources Behind Garden Grove Air Data
Every number on this page traces back to a government agency or national health authority. Each source is paired with the question it answers, so you can verify any claim at its origin.
1. Learn What Any AQI Number Means in Under a Minute
EPA AirNow defines the six color categories and the 0-to-500 scale behind every reading on this page. Start with AirNow's AQI Basics for the official meaning of the number.
2. See the Reading for Your Block, Not Just for Garden Grove
South Coast AQMD is the air district for Orange County, and its live neighborhood air quality map estimates AQI at more than 1,200 locations, the closest official reading to your address.
3. Read Why Garden Grove's Official Monitor Sits in Another City
The City of Garden Grove publishes its General Plan Air Quality Element, which places the city in the Coastal Orange County Source Receptor Area with its station in Anaheim. It also confirms local standards are frequently exceeded for ozone but rarely for carbon monoxide or nitrogen oxides.
4. Understand What Fine Particles Do Once They Reach Your Lungs
The California Air Resources Board explains how PM2.5 and PM10 deposit in the airways and estimates PM2.5 contributes to 5,400 premature deaths a year statewide. CARB's particulate matter and health overview is the state’s own account of the pollutant behind Garden Grove’s worst days.
5. Find Out Whether Your Home Sits Too Close to the 22 or the 405
CARB's near-roadway exposure guidance recommends keeping homes, schools, and playgrounds at least 500 feet from a freeway, and documents effects as far as 1,000 feet out.
6. Compare Orange County's Air With the Rest of the Country
The American Lung Association grades every monitored county in the United States each year. Orange County's 2026 report card shows an F for ozone, an F for year-round particle pollution, and a C for short-term.
7. See Why an Outdoor Number Is Really an Indoor Warning
The EPA's indoor air quality assessment reports concentrations of some pollutants run two to five times higher indoors than outdoors, and that Americans spend roughly 90% of their time inside. That is the evidence behind treating a rising AQI as an indoor cue.
Frequently Asked Questions
Ready to Breathe Easier in Garden Grove?
Garden Grove's outdoor air will keep shifting with the season and the wind. The air inside your home does not have to.
Protect your indoor air on high-AQI days. When Garden Grove's AQI climbs, a Filterbuy MERV 13 filter helps keep fine smoke particles out of the air your family breathes. Made in the USA, cut to your size, shipped free. → Shop MERV 13 Filters
Glossary of Garden Grove Air Quality Terms
Air Quality Index (AQI). A 0 to 500 scale from the U.S. EPA reporting how polluted outdoor air is.
PM2.5. Fine particles under 2.5 micrometers, small enough to reach the lungs and bloodstream. The main pollutant in wildfire smoke.
Ground-level ozone. A gas formed when sunlight reacts with vehicle and industrial emissions. It peaks on hot afternoons and is the basis of smog.
South Coast Air Basin. The Southern California lowland where coastal mountains trap pollution.
South Coast AQMD. The air district for all of Orange County plus urban Los Angeles, Riverside, and San Bernardino counties.
Source receptor area. A South Coast AQMD subregion with one monitoring station treated as representative of its air. Garden Grove's is in Anaheim.
MERV. Minimum Efficiency Reporting Value. Filterbuy pleated media captures 90% of airborne particles per pass at MERV 8, 95% at MERV 11, and 98% at MERV 13. Per-pass capture differs from the reduction in room concentration cited above.
Sensitive groups. People at higher risk from air pollution: children, older adults, pregnant people, and anyone with asthma or heart disease.