May 5, 2026

By David Heacock
Despite concerted public health efforts in cancer prevention and new innovations in diagnosis and treatment over the years, cancer remains America’s second-leading cause of death after cardiovascular disease. And of all the bodily systems that cancer can attack, cancer of the lungs is among the most common and most dangerous in the U.S. One in 16 Americans will be diagnosed with lung cancer in their lifetimes. On an annual basis, around 230,000 new lung cancer diagnoses occur in the U.S.—the equivalent of one every 2.3 minutes.
Although lung cancer can strike people of any age, older individuals are more likely to contract and die from it. After a lifetime of exposure to potential carcinogens like asbestos and accumulated unhealthy habits like smoking, individuals’ risks of developing cancer increase with age. As the American population gets older due to the aging of the Baby Boomers, lung cancer cases are likely to increase in raw numbers for that reason.
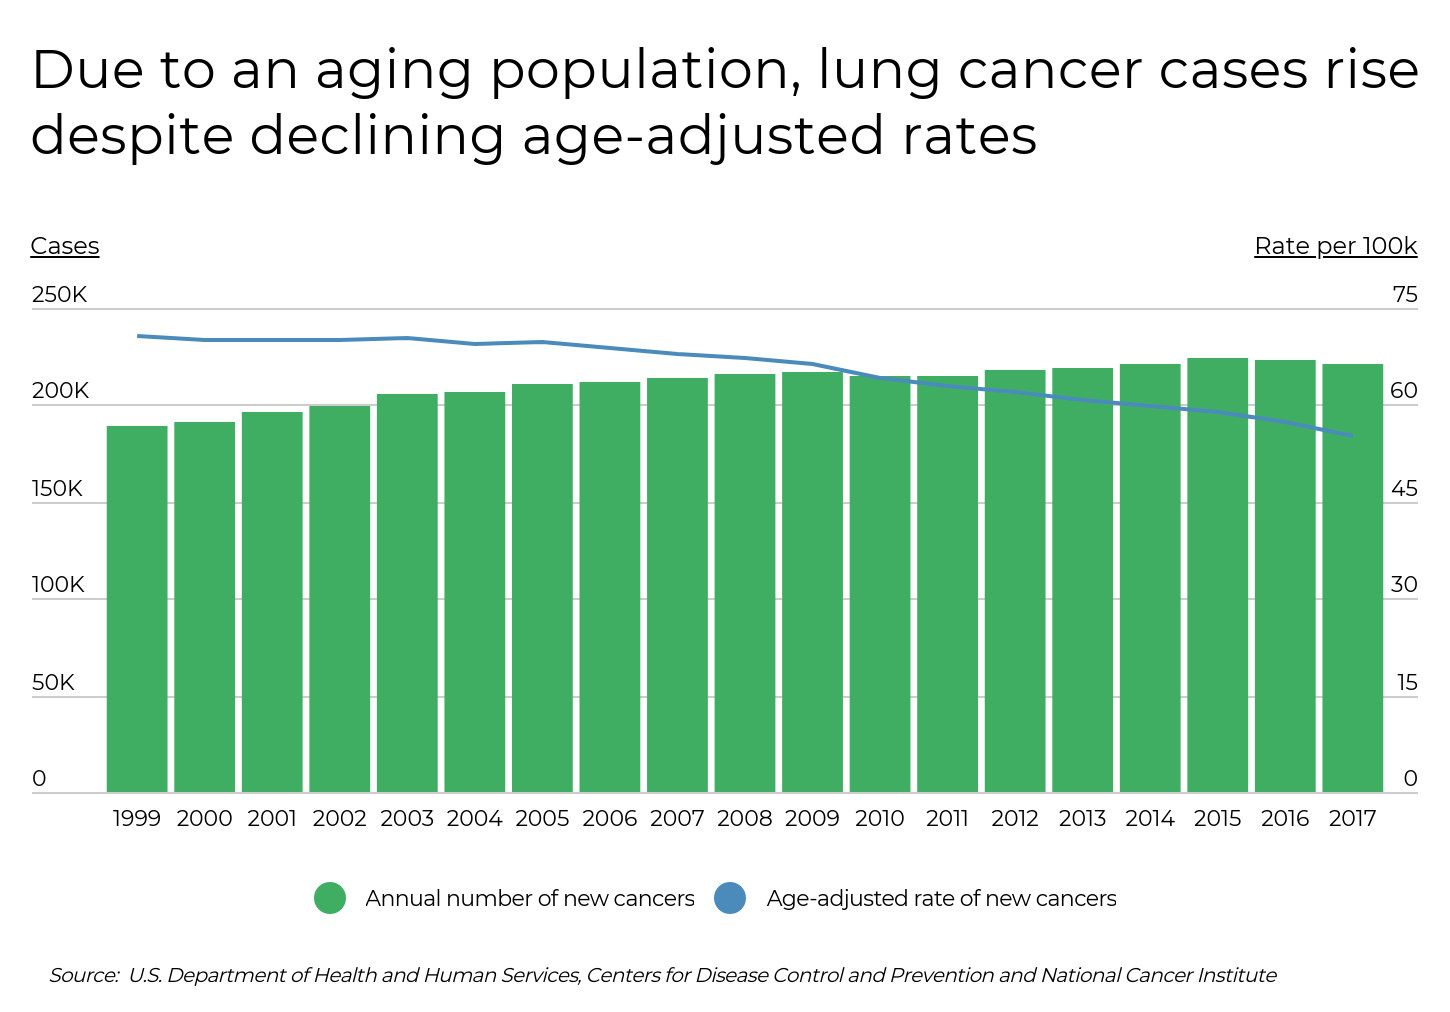
Trends already bear this out. While the age-adjusted rate of lung cancer cases has declined over the last two decades, the total number of new cancers increased from around 190,000 in 1999 to more than 220,000 in 2017.
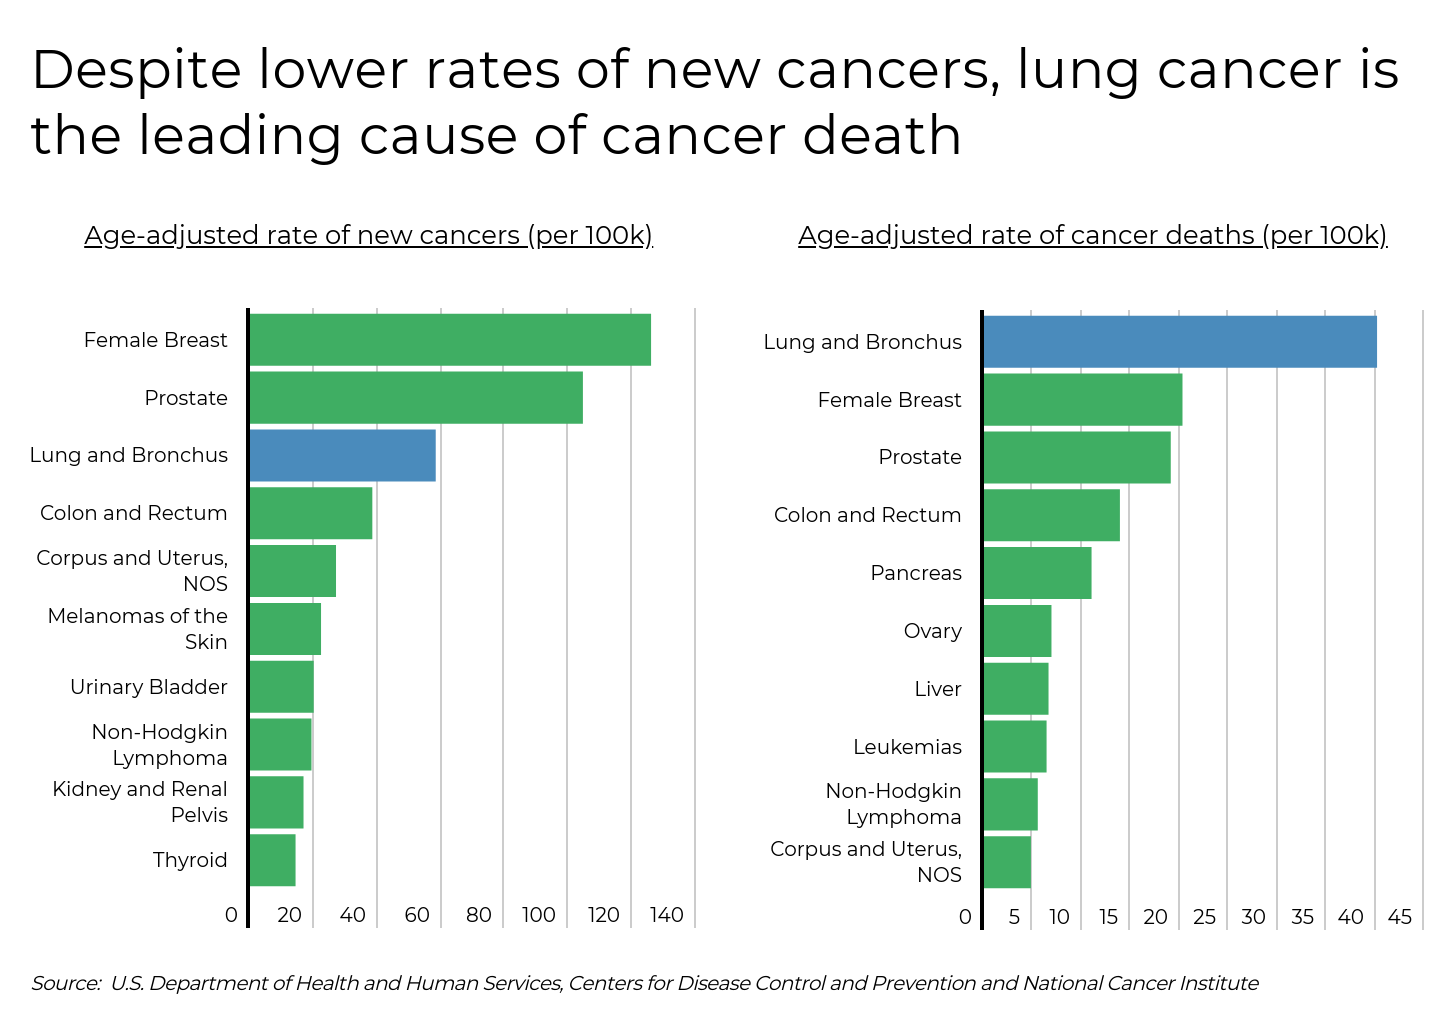
A rising number of cases is worrying because lung cancer is the leading cause of cancer death by a substantial margin, despite being only the third most commonly diagnosed form. Both female breast and prostate cancer are more common, but lung cancer leads to more deaths than breast and prostate cancers combined.
RELATED Home air filters remove dust, smoke, mold, and bacteria from being pumped into your HVAC system. You should replace your home air filters frequently. For the strongest protection, consider Filterbuy’s MERV 13 air filters.
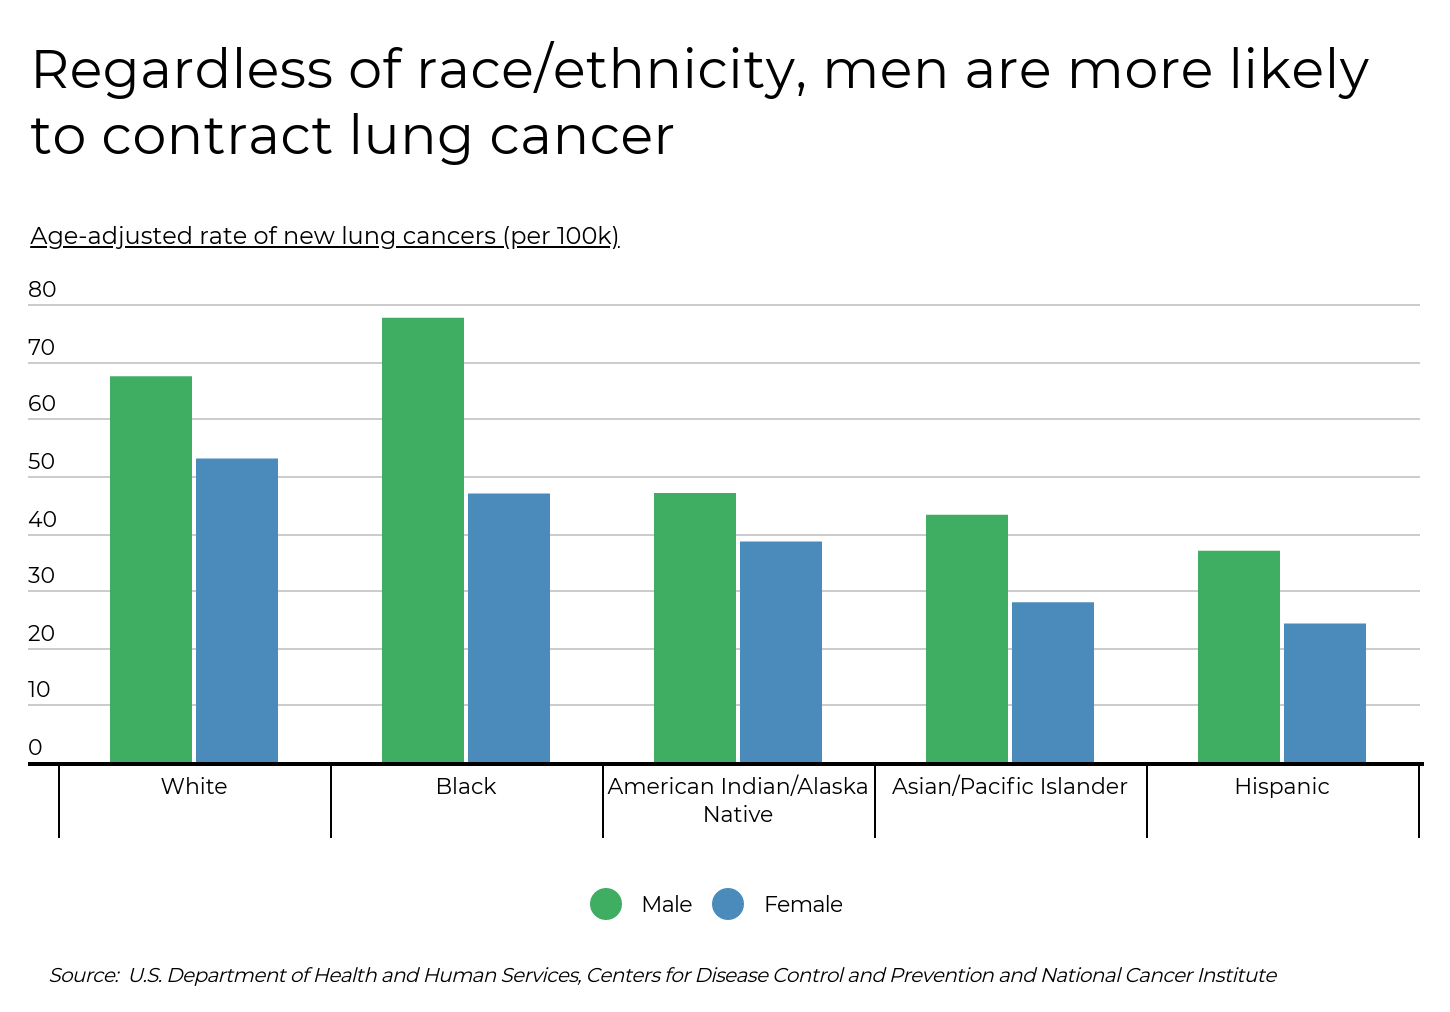
And while lung cancer occurs throughout the population, some demographics are more likely to experience the effects than others. Across all races and ethnicities, men are more likely than women to contract lung cancer—a phenomenon that is likely explained by the fact that men are also more likely to smoke tobacco, which is the leading risk factor for lung cancer. When looking at race and ethnicity, white and Black Americans—male or female—are more likely to contract cancer than American Indians, Asian and Pacific Islanders, or Hispanics of either gender.
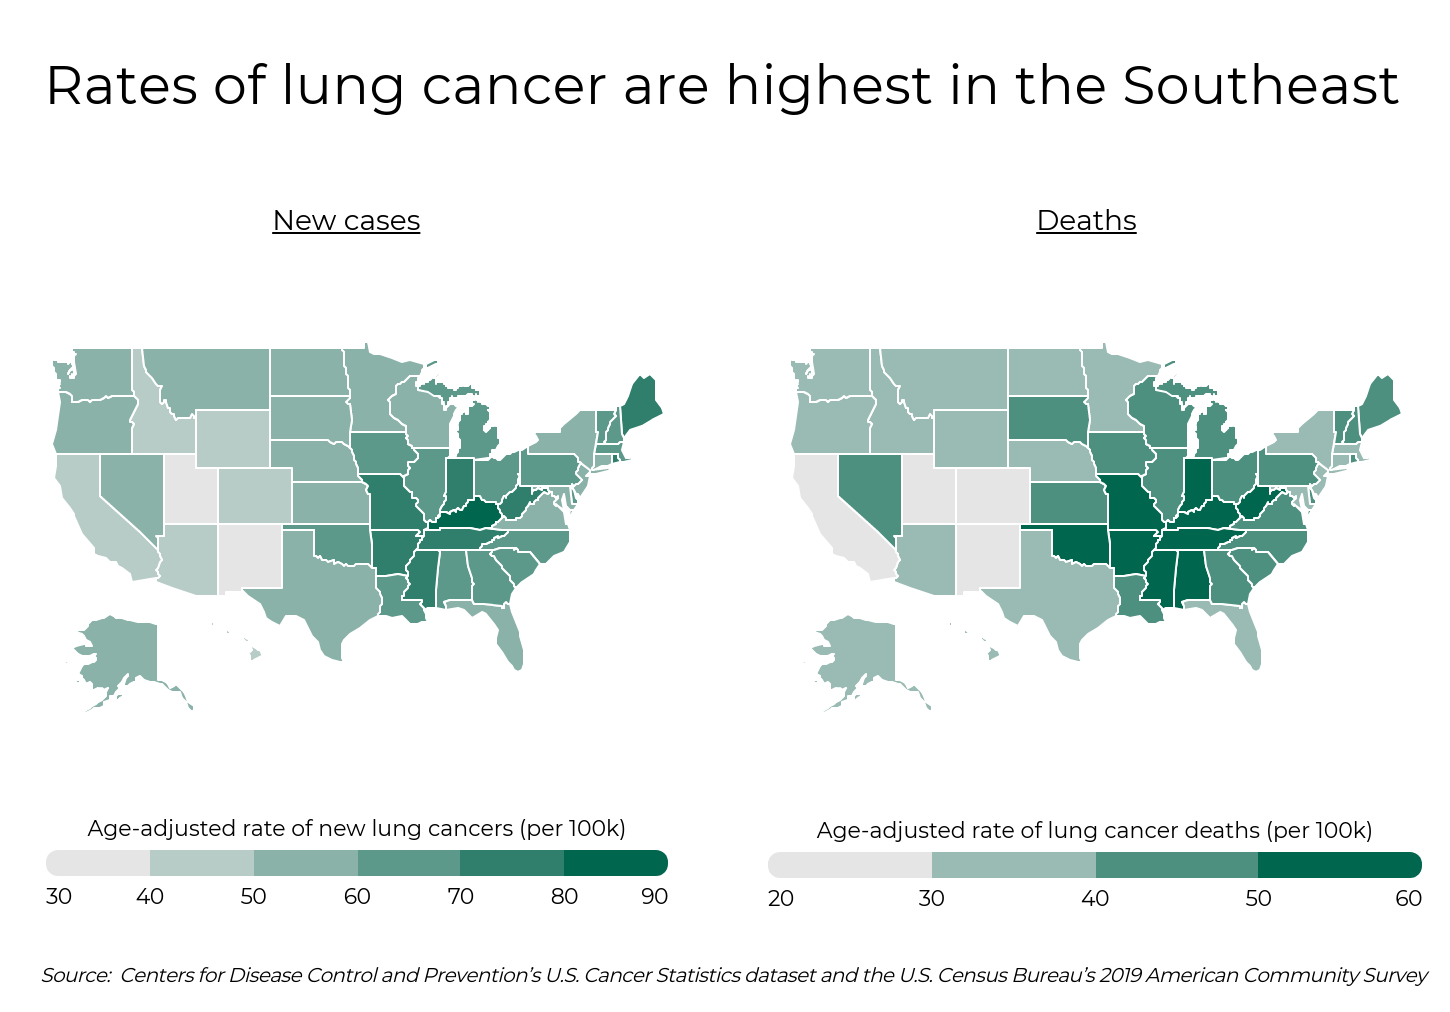
Geography is another factor affecting the distribution of lung cancer cases and deaths. States in the Southeast, particularly in the Appalachian region, lead the United States in new lung cancer cases per 100,000 age-adjusted population, and predictably, the top five states for new cases—Kentucky, West Virginia, Arkansas, Mississippi, and Tennessee—are also the top five for rates of lung cancer deaths. The concentration of lung cancer in Appalachia is unsurprising given the reinforcing challenges of poverty and poor health outcomes in the region. Further, leading states Kentucky and West Virginia have an additional risk: the two states have traditionally employed a large share of its workforce in coal mining, a field that is strongly correlated with lung diseases including cancer.
Many of the leading states for incidence of lung cancer are also home to the counties where lung cancer is most common. To rank the states and counties with the highest rates of lung cancer, researchers at Filterbuy used recent data from the U.S. Census Bureau and the Centers for Disease Control and Prevention on the age-adjusted rate of new lung and bronchus cancers.
Here are the counties with the highest rates of lung cancer.
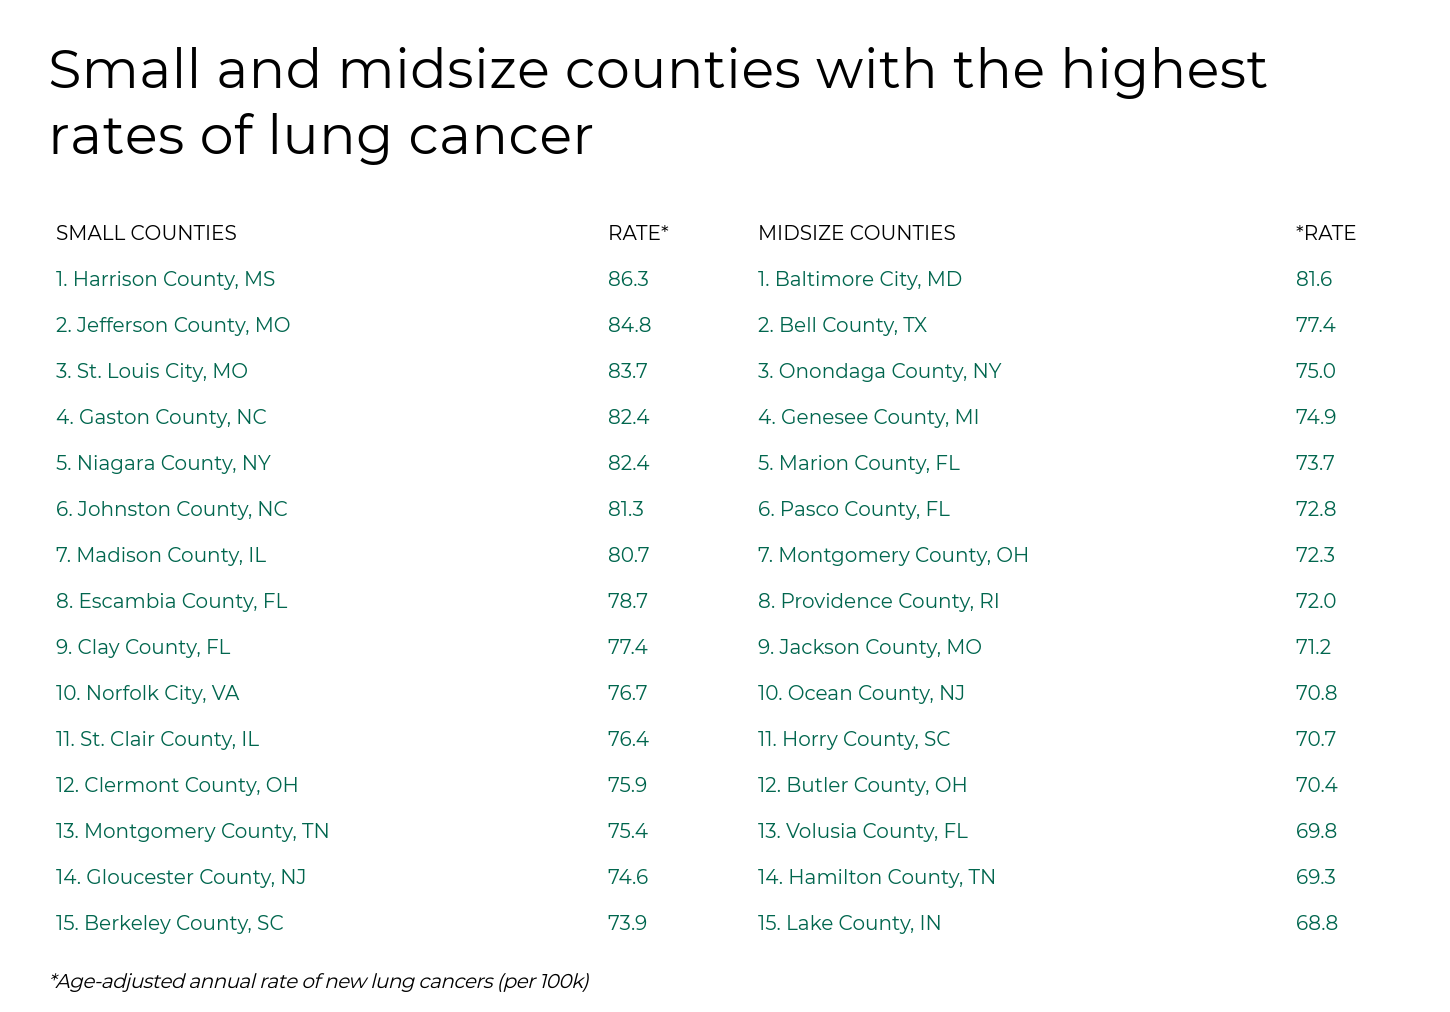

Photo Credit: Alamy Stock Photo
Age-adjusted rate of new lung cancers (per 100k): 65.6
Age-adjusted rate of lung cancer deaths (per 100k): 41.8
Number of new lung cancers reported per year: 681
Number of lung cancer deaths reported per year: 442

Photo Credit: Alamy Stock Photo
Age-adjusted rate of new lung cancers (per 100k): 66.0
Age-adjusted rate of lung cancer deaths (per 100k): 43.8
Number of new lung cancers reported per year: 586
Number of lung cancer deaths reported per year: 381

Photo Credit: Alamy Stock Photo
Age-adjusted rate of new lung cancers (per 100k): 67.4
Age-adjusted rate of lung cancer deaths (per 100k): 46.9
Number of new lung cancers reported per year: 792
Number of lung cancer deaths reported per year: 543

Photo Credit: Alamy Stock Photo
Age-adjusted rate of new lung cancers (per 100k): 67.5
Age-adjusted rate of lung cancer deaths (per 100k): 43.6
Number of new lung cancers reported per year: 655
Number of lung cancer deaths reported per year: 419

Photo Credit: Alamy Stock Photo
Age-adjusted rate of new lung cancers (per 100k): 67.7
Age-adjusted rate of lung cancer deaths (per 100k): 36.6
Number of new lung cancers reported per year: 1,262
Number of lung cancer deaths reported per year: 685

Photo Credit: Alamy Stock Photo
Age-adjusted rate of new lung cancers (per 100k): 67.7
Age-adjusted rate of lung cancer deaths (per 100k): 43.7
Number of new lung cancers reported per year: 1,157
Number of lung cancer deaths reported per year: 759

Photo Credit: Alamy Stock Photo
Age-adjusted rate of new lung cancers (per 100k): 68.4
Age-adjusted rate of lung cancer deaths (per 100k): 45.0
Number of new lung cancers reported per year: 676
Number of lung cancer deaths reported per year: 448

Photo Credit: Alamy Stock Photo
Age-adjusted rate of new lung cancers (per 100k): 70.4
Age-adjusted rate of lung cancer deaths (per 100k): 49.7
Number of new lung cancers reported per year: 1,456
Number of lung cancer deaths reported per year: 1,025

Photo Credit: Alamy Stock Photo
Age-adjusted rate of new lung cancers (per 100k): 71.8
Age-adjusted rate of lung cancer deaths (per 100k): 49.0
Number of new lung cancers reported per year: 677
Number of lung cancer deaths reported per year: 464

Macomb County is part of the Detroit-Warren-Dearborn, MI Metropolitan Statistical Area; Photo Credit: Alamy Stock Photo
Age-adjusted rate of new lung cancers (per 100k): 72.3
Age-adjusted rate of lung cancer deaths (per 100k): 50.2
Number of new lung cancers reported per year: 791
Number of lung cancer deaths reported per year: 546

Photo Credit: Alamy Stock Photo
Age-adjusted rate of new lung cancers (per 100k): 72.7
Age-adjusted rate of lung cancer deaths (per 100k): 46.6
Number of new lung cancers reported per year: 722
Number of lung cancer deaths reported per year: 455

Photo Credit: Alamy Stock Photo
Age-adjusted rate of new lung cancers (per 100k): 72.7
Age-adjusted rate of lung cancer deaths (per 100k): 47.0
Number of new lung cancers reported per year: 890
Number of lung cancer deaths reported per year: 576

Photo Credit: Alamy Stock Photo
Age-adjusted rate of new lung cancers (per 100k): 75.2
Age-adjusted rate of lung cancer deaths (per 100k): 50.1
Number of new lung cancers reported per year: 1,244
Number of lung cancer deaths reported per year: 825

Photo Credit: Alamy Stock Photo
Age-adjusted rate of new lung cancers (per 100k): 77.2
Age-adjusted rate of lung cancer deaths (per 100k): 55.5
Number of new lung cancers reported per year: 717
Number of lung cancer deaths reported per year: 506

Photo Credit: Alamy Stock Photo
Age-adjusted rate of new lung cancers (per 100k): 84.0
Age-adjusted rate of lung cancer deaths (per 100k): 55.0
Number of new lung cancers reported per year: 765
Number of lung cancer deaths reported per year: 501
The data used in this analysis is from the Centers for Disease Control and Prevention’s U.S. Cancer Statistics dataset and the U.S. Census Bureau’s 2019 American Community Survey. The data utilized reflects the time period of 2013 through 2017, the most recent data available at this time. To determine the locations with the highest rates of lung cancer, researchers ranked locations based on the age-adjusted rate of new lung and bronchus cancers. In the event of a tie, the location with the higher age-adjusted rate of lung cancer deaths was ranked higher. Rates are the number of cases (or deaths) per 100,000 people and are age-adjusted to the 2000 U.S. standard population. The number of new lung cancers reported and number of lung cancer deaths reported reflect the annual average for the years 2013 through 2017. To improve relevance, only counties with at least 200,000 residents were included. Additionally, counties were grouped into cohorts based on population size: small (200,000–349,999), midsize (350,000–749,999), and large (750,000 or more).