May 5, 2026

Photo Credit: JackWard / Shutterstock
By David Heacock
Rising rents have hit households hard over the last year. After remaining flat amid eviction moratoriums and government assistance programs in 2020, rents grew by 17.6% in 2021 and by another 6.7% over the first seven months of 2022. And in a period of persistent inflation, costs for housing are squeezing renters’ budgets for other household spending.
But even before the recent spike in rents, the gap between what a typical rental costs and what the typical worker can afford based on their income has been growing. Amid stagnant wages for workers, especially low income earners, and a nationwide shortage of housing stock, renters are finding it more difficult than ever to secure affordable housing. A recent report from the National Low Income Housing Coalition found that the typical renter today needs to earn $21.25 per hour to afford a modest one-bedroom apartment.
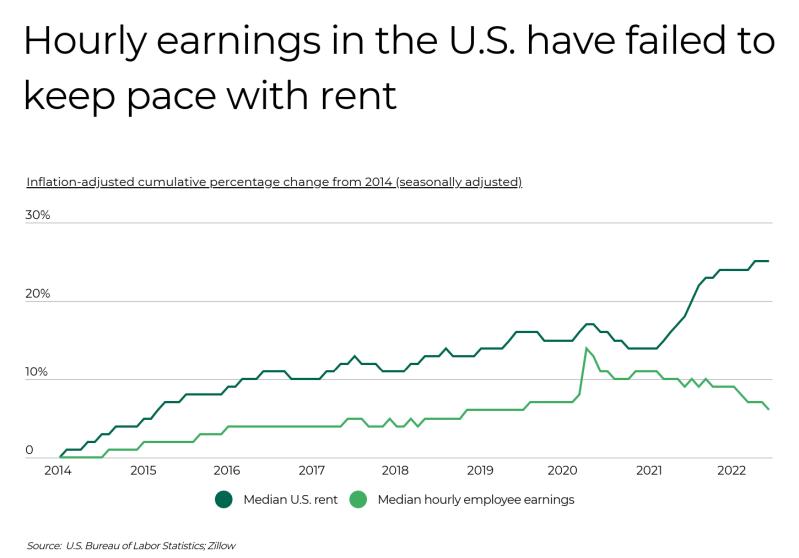
The gap is only widening as rates of rent growth exceed rates of growth for wages. After adjusting for inflation, the median U.S. rent has grown by 25% since 2014, while the median hourly employee earnings in the U.S. has increased by only 6% over the same span. While the gap narrowed in 2020, the recent spike in rents has widened the difference between cumulative rates of rent and wage growth to nearly twice what it was before the pandemic.
The combination of rising rents and stagnant wages has been a challenge for Americans of all stripes, but certain groups have been more disadvantaged by this state of affairs than others. Researchers from the Joint Center for Housing Studies at Harvard found earlier in 2022 that nearly a quarter of the lowest-earning renters are behind on rent, and renters of color are at least twice as likely as white renters to be behind. But even well-off households are feeling pressure, as rising real estate costs price would-be buyers out and keep them competing for space in the rental market—and as they spend more on rent, they have a harder time saving for homeownership.
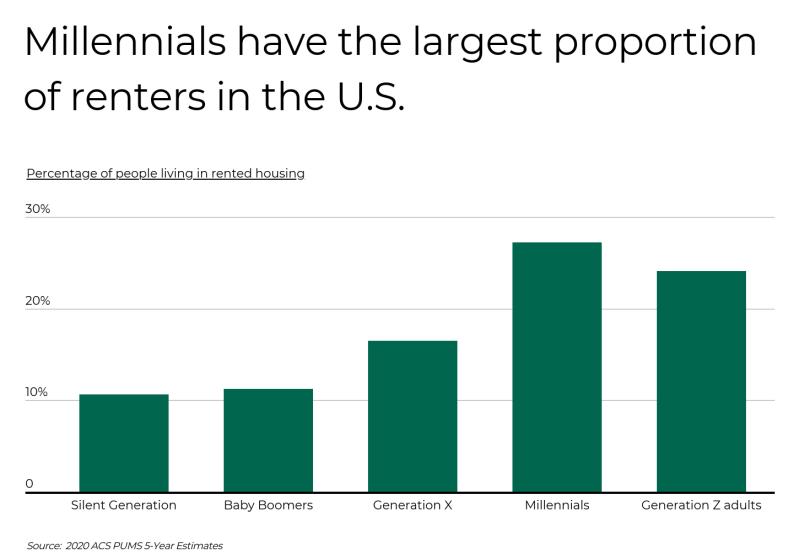
Current challenges in the rental market are also being experienced differently across generations. Members of the millennial generation—currently aged 26 to 41—are at an age when most people buy their first or second home. But rising costs of rents and real estate have compounded on other financial difficulties faced by the millennials, like lost earning potential after the Great Recession and historically high levels of debt. Now, 27.2% of millennials in the U.S. are renters, a larger proportion than any other generation.
DID YOU KNOW? Replace your home air filters every three to six months to protect your loved ones with clean and healthy air inside your home. For optimum protection, check out Filterbuy’s MERV 13 air filters.
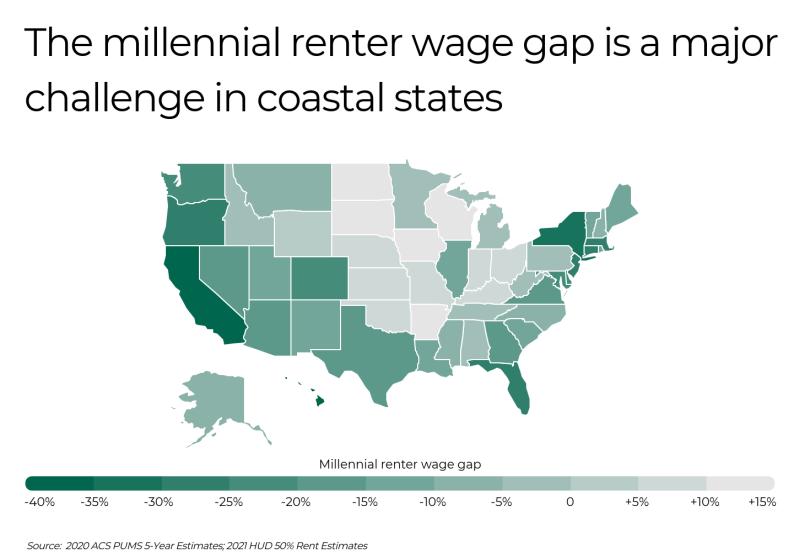
For millennials in some parts of the country, rental units fortunately remain relatively affordable. The interior of the U.S. tends to have the most affordable locations, including 13 states where a typical millennial renter’s earnings exceed what is needed to afford the median one-bedroom unit. In contrast, most of the states where millennials have larger renter wage gaps are coastal states that tend to have higher housing costs due to limited supply, like California. The problem is even more acute at the metro level, where some of the most desirable and fastest-growing cities in the U.S. have major renter wage gaps for millennials.
To determine the locations with the largest millennial renter wage gap, researchers at Filterbuy calculated the percentage difference between the median wage for millennial renters and the median wage necessary to afford a one-bedroom rental without spending more than 30% of wages on rent. In the event of a tie, the location with the higher median one-bedroom rent was ranked higher.
Here are the U.S. metropolitan areas with the largest millennial renter wage gap.
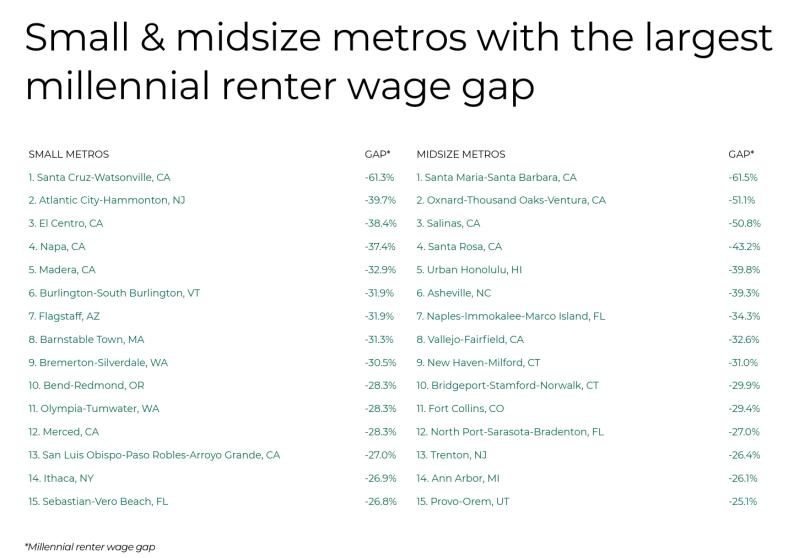

Photo Credit: Mihai Andritoiu / Shutterstock
Millennial renter wage gap: -22.9%
Millennial renter median wage: $33,508
Annual wage needed to afford a 1-br rental: $43,440
Median 1-br rent: $1,086
Percentage of millennials in rented housing: 26.0%

Photo Credit: Nicholas Courtney / Shutterstock
Millennial renter wage gap: -26.4%
Millennial renter median wage: $41,885
Annual wage needed to afford a 1-br rental: $56,880
Median 1-br rent: $1,422
Percentage of millennials in rented housing: 28.7%

Photo Credit: Checubus / Shutterstock
Millennial renter wage gap: -27.3%
Millennial renter median wage: $47,120
Annual wage needed to afford a 1-br rental: $64,840
Median 1-br rent: $1,621
Percentage of millennials in rented housing: 31.7%

Photo Credit: Andriy Blokhin / Shutterstock
Millennial renter wage gap: -28.1%
Millennial renter median wage: $36,649
Annual wage needed to afford a 1-br rental: $50,960
Median 1-br rent: $1,274
Percentage of millennials in rented housing: 30.1%

Photo Credit: shamiso chikanga / Shutterstock
Millennial renter wage gap: -28.6%
Millennial renter median wage: $32,147
Annual wage needed to afford a 1-br rental: $45,000
Median 1-br rent: $1,125
Percentage of millennials in rented housing: 27.3%

Photo Credit: Travellaggio / Shutterstock
Millennial renter wage gap: -31.6%
Millennial renter median wage: $49,738
Annual wage needed to afford a 1-br rental: $72,680
Median 1-br rent: $1,817
Percentage of millennials in rented housing: 30.5%

Photo Credit: Andrew Zarivny / Shutterstock
Millennial renter wage gap: -33.8%
Millennial renter median wage: $37,173
Annual wage needed to afford a 1-br rental: $56,160
Median 1-br rent: $1,404
Percentage of millennials in rented housing: 30.4%

Photo Credit: Jon Bilous / Shutterstock
Millennial renter wage gap: -34.5%
Millennial renter median wage: $31,414
Annual wage needed to afford a 1-br rental: $47,960
Median 1-br rent: $1,199
Percentage of millennials in rented housing: 24.6%

Photo Credit: Sundry Photography / Shutterstock
Millennial renter wage gap: -36.1%
Millennial renter median wage: $68,063
Annual wage needed to afford a 1-br rental: $106,520
Median 1-br rent: $2,663
Percentage of millennials in rented housing: 35.2%

Photo Credit: Lukas Uher / Shutterstock
Millennial renter wage gap: -36.9%
Millennial renter median wage: $45,026
Annual wage needed to afford a 1-br rental: $71,360
Median 1-br rent: $1,784
Percentage of millennials in rented housing: 34.0%

Photo Credit: yhelfman / Shutterstock
Millennial renter wage gap: -37.4%
Millennial renter median wage: $62,827
Annual wage needed to afford a 1-br rental: $100,400
Median 1-br rent: $2,510
Percentage of millennials in rented housing: 35.0%

Photo Credit: Infinity Moments LLC / Shutterstock
Millennial renter wage gap: -38.1%
Millennial renter median wage: $30,366
Annual wage needed to afford a 1-br rental: $49,080
Median 1-br rent: $1,227
Percentage of millennials in rented housing: 29.9%

Photo Credit: Sean Pavone / Shutterstock
Millennial renter wage gap: -39.9%
Millennial renter median wage: $41,885
Annual wage needed to afford a 1-br rental: $69,720
Median 1-br rent: $1,743
Percentage of millennials in rented housing: 34.2%

Photo Credit: Sean Pavone / Shutterstock
Millennial renter wage gap: -40.0%
Millennial renter median wage: $31,414
Annual wage needed to afford a 1-br rental: $52,320
Median 1-br rent: $1,308
Percentage of millennials in rented housing: 30.1%

Photo Credit: Sean Pavone / ShutterstockLos Angeles-Long Beach-Anaheim, CA
Millennial renter wage gap: -49.5%
Millennial renter median wage: $36,649
Annual wage needed to afford a 1-br rental: $72,560
Median 1-br rent: $1,814
Percentage of millennials in rented housing: 35.6%
The data used in this analysis is from the U.S. Census Bureau’s 2020 ACS PUMS 5-Year Estimates. To determine the locations with the largest millennial renter wage gap, researchers at Filterbuy calculated the percentage difference between the median wage for millennial renters and the median wage necessary to afford a one-bedroom rental without spending more than 30% of wages on rent. For the purpose of this analysis millennials are defined as those aged between 24-39 (in 2020). In the event of a tie, the location with the higher median one-bedroom rent was ranked higher. To improve relevance, only metropolitan areas with at least 100,000 residents and complete data available were included. Additionally, metros were grouped into cohorts based on population size: small (100,000–349,999), midsize (350,000–999,999), and large (1,000,000 or more).