
Hayward Real-Time AQI Tracker


Get Alerts For Unhealthy AQI In Your Area
When air quality in your area reaches unhealthy levels, we'll send you a quick alert, along with expert tips on how to reduce your exposure.
What's Actually In Hayward Air Today?
What High AQI Means for Your Lungs in Hayward
How to Read AQI
The Air Quality Index (AQI) measures how polluted the air is and how it may affect your health.
0–50 (Good): Air quality is satisfactory.
51–100 (Moderate): Acceptable, but some pollutants may pose minor concerns.
101–150 (Unhealthy for Sensitive Groups)
151–200 (Unhealthy)
201–300 (Very Unhealthy)
301+ (Hazardous)
Moderate
Still okay for most, but if you have asthma or allergies, take it easy and avoid long outdoor workouts.
Shop MERV 11 filters→What's the Right Filter for Your AQI Level?
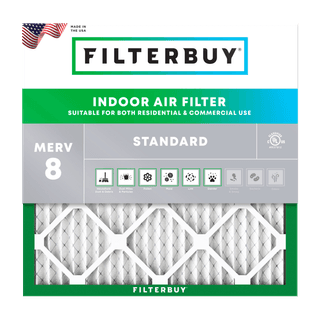
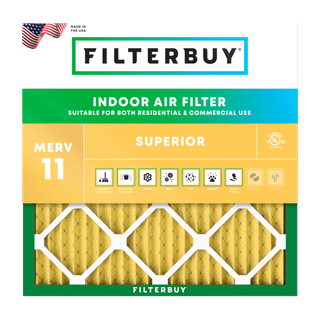
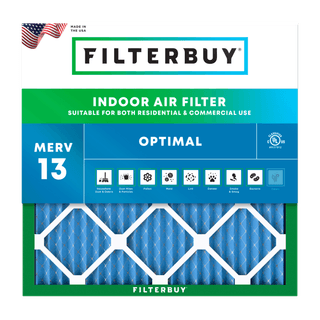


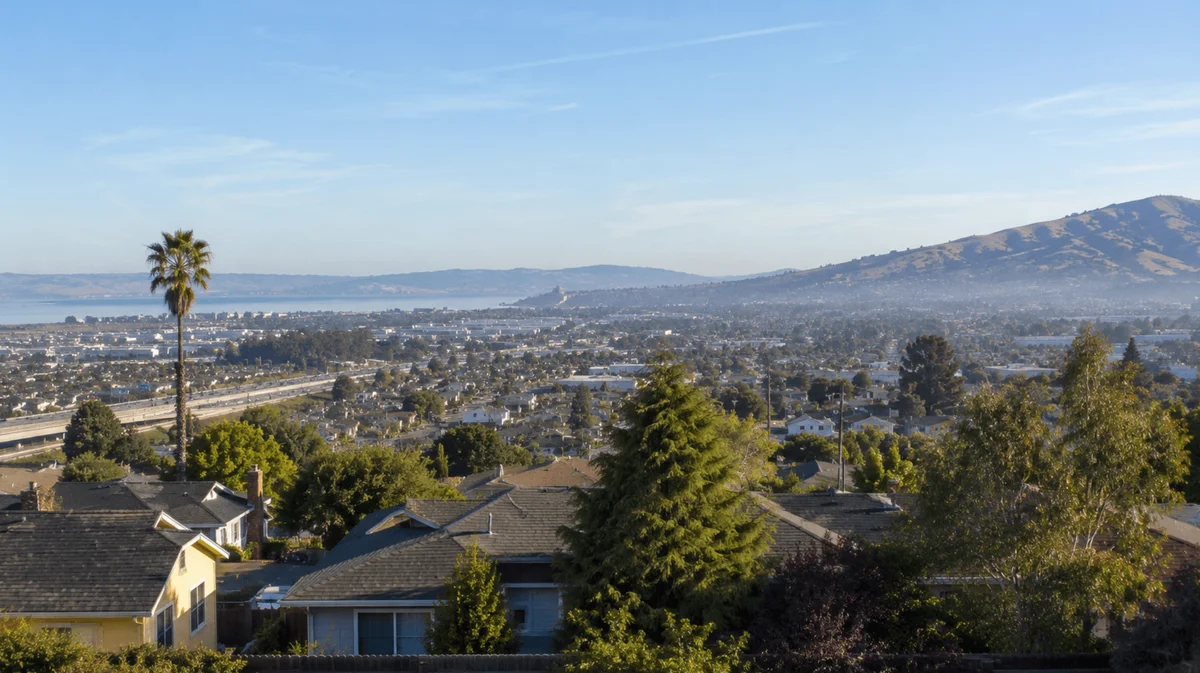
Check Today's Live Real Time Air Quality Index AQI Map in Hayward, CA Now
Written by Michelle Wan, Brand Manager and Air Quality Writer | Reviewed by David Clark, Licensed HVAC Technician | Published: August 12, 2026 | Last updated: August 12, 2026
Why trust this page: Michelle Wan writes air quality coverage for Filterbuy, a family-owned American air filter manufacturer, and lives in the San Francisco Bay Area, so the zone forecasts and smoke advisories described below are the ones she checks herself. She works directly with the Filterbuy US manufacturing team in Alabama, Florida, Pennsylvania and Utah, which means the filter guidance here is based on how these filters are built and how they behave in real homes. David Clark, a licensed HVAC technician, reviewed the technical claims.
TL;DR
Hayward, California, sits in Alameda County on the east shore of San Francisco Bay. The live map above shows its current Air Quality Index, the U.S. EPA 0–500 scale. Two pollutants drive that number here: fine particles (PM2.5) in wildfire season and winter, and ground-level ozone on hot summer afternoons. Which one is driving today reading decides what you can do about it, and a MERV 13 filter only helps with one of them.
Key Takeaways
Hayward AQI is reported on the EPA 0–500 Air Quality Index scale, where 0–50 is Good, 51–100 is Moderate, and 101–150 is Unhealthy for Sensitive Groups.
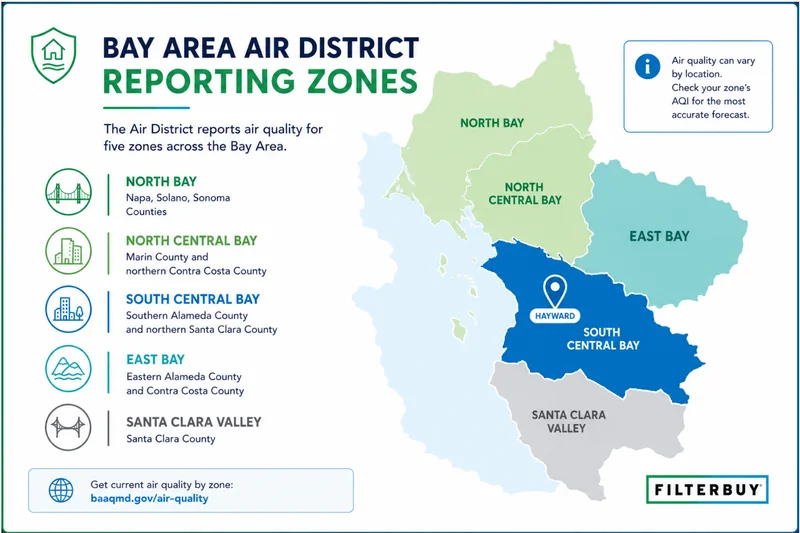
Hayward sits in the Bay Area Air District South Central Bay forecast zone, not a Hayward-only zone, so the official daily forecast covers everything from San Leandro to Palo Alto.
A Spare the Air Alert is called for the entire Bay Area when ozone is forecast above AQI 100, or PM2.5 above AQI 80, in any one of the five reporting zones.
Wildfire smoke is the biggest AQI risk factor here. The EPA estimates that 52 percent of all PM2.5 emitted in the United States comes from wildland fires.
Indoor air tracks outdoor air. During a smoke event a MERV 13 HVAC filter captures the PM2.5 that ordinary fiberglass filters pass straight through.
What Is Hayward's Air Quality Right Now?
Hayward current air quality is shown on the live map above, expressed as an Air Quality Index value from 0 to 500. The AQI is the EPA standardized scale for reporting daily air pollution. A reading of 0–50 means the air is Good and poses little risk, 51–100 is Moderate, and anything above 100 means the air is unhealthy for at least some people. Hayward sits in the Good or Moderate range on most days, with spikes during wildfire smoke events.
The reading updates hourly. If you can smell smoke, refresh it. Drifting wildfire smoke can move the number from Good into Unhealthy within a few hours, which is also why air quality goes bad so quickly on days that started clear.
How to Read the Hayward AQI Map
Each color on the map corresponds to a health category defined by the EPA. Here is what each one means for a Hayward household. For the full official definitions, see the EPA AQI Basics guide.
Source: U.S. EPA Air Quality Index, as published by AirNow and the Bay Area Air District. Color names are the official EPA category colors.
If the number climbs above 300, the Hazardous AQI category carries its own set of emergency-level indoor steps.
Why the Official Forecast Isn't a Hayward Forecast
Hayward has no Hayward-specific forecast. The Bay Area Air District forecasts five multi-city zones, and Hayward sits inside South Central Bay, which averages conditions from San Leandro across the Bay to Palo Alto. That one fact explains almost every confusing AQI reading you will see here, including why your phone app and the evening news disagree on the same afternoon.
The Bay Area Air District, the regional agency formerly known as BAAQMD that rebranded in January 2025, divides the region into five reporting zones drawn by wind patterns and terrain rather than city limits. Hayward is grouped with San Leandro, San Lorenzo, Castro Valley, Union City, Newark, Fremont and, across the water, Redwood City, Menlo Park, Palo Alto and Mountain View.
That has three practical consequences:
The official Hayward forecast is a regional average. A number issued for South Central Bay is not measuring the air on your street in the Hayward Highlands or off Tennyson Road.
A Spare the Air Alert is not a Hayward alert. Because the Bay Area is a single air basin where pollution drifts between zones, one alert covers all nine counties. It is triggered when ozone is forecast above AQI 100, or PM2.5 above AQI 80, in any zone, including one you do not live in.
Hyperlocal sensors will disagree with the forecast, and both can be right. They measure different things at different scales.
How to triangulate a Hayward reading: use the regulatory monitor reading, which is what the map above and AirNow draw from, as your official number. Use a nearby low-cost sensor on the PurpleAir map to catch fast-moving smoke plumes the official network may lag on. Use the Air District zone forecast only for planning tomorrow, never for deciding about right now.
The same split shows up across the East Bay, which is why the Oakland AQI map can read Green in the hills and Orange near the port in the same hour. Compare Hayward against San Francisco and San Jose, or zoom out to the California air quality index map.
The first time I saw a Spare the Air Alert for the whole Bay Area on a morning my own street looked clear, I assumed the alert was wrong. It was not. Hayward does not get a Hayward forecast, it gets a South Central Bay forecast that averages everything from San Leandro to Palo Alto. Once you know that, the map stops being confusing and starts being useful. Check your address, then check one neighbor zone, and believe the difference.
Michelle Wan, Brand Manager and Air Quality Writer, Filterbuy
What Pollutes Hayward's Air, and When
Hayward air quality follows a predictable annual cycle. Ground-level ozone drives the AQI on hot, still summer afternoons. Fine particles take over during wildfire season and again in winter, when wood smoke settles under cold-air inversions. Diesel traffic on the I-880 corridor adds to the particle load year round.
Seasonal pattern based on Bay Area Air District pollutant reporting for the South Central Bay zone.
Wildfire smoke deserves special attention. In early August 2026 the Bay Area Air District issued and then extended air quality advisories for smoke arriving from Pacific Northwest wildfires. That smoke originated well outside California. Hayward does not need a nearby fire to have a bad air day, and the sky often looks normal while the number climbs.
Winter is a different problem with a local remedy. Wood smoke trapped under a cold-air inversion is the main particle source from November through February, and burning is illegal during a winter Spare the Air Alert. Hayward residents can report wood smoke to the Air District at 1-877-4NO-BURN, or through the City of Hayward air pollution complaints page.
There is good news in the long-run data. In the American Lung Association State of the Air 2026 report card for Alameda County, covering 2022 to 2024, the San Jose–San Francisco–Oakland metro still ranked among the 25 worst U.S. metros for ozone and short-term particle pollution, but it also recorded its lowest-ever short-term particle average for the second consecutive year.
When a Filter Helps in Hayward, and When It Does Not
We sell air filters, so take this as the honest version rather than the sales version. A furnace filter is not a general-purpose fix for bad air. It fixes one of Hayward two problems.
The EPA Guide to Air Cleaners in the Home puts it plainly: most filters are designed to capture either particles or gases, not both. That single distinction splits the Hayward year in half.
Particle days: the filter is your best tool
Applies to wildfire smoke season and winter wood smoke.
PM2.5 is a solid particle, so pleated media physically traps it.
EPA specifies MERV 13 or the highest rating your system accepts.
Ozone days: the filter is not your tool
Applies to hot, still summer afternoons, when smog drives the Hayward AQI.
Ozone is a gas. A pleated particle filter does not remove it, regardless of MERV rating.
Activated carbon adsorbs some gases, but EPA notes it works only with a large amount of carbon media.
What actually works on an ozone day is timing. Ozone peaks in the afternoon and falls overnight, so shift outdoor exertion to the morning and keep windows shut during the peak.
So check what is driving the number, not just the number. The live map above names the dominant pollutant. If it says PM2.5, your filter is doing real work. If it says ozone, your filter is protecting your lungs from everything except the pollutant that triggered the reading.
What to Do When Hayward's AQI Climbs
When outdoor AQI rises, indoor AQI follows. Fine particles infiltrate through gaps around doors, windows and ductwork, and once inside they stay suspended for hours. Your HVAC system is the largest air-moving machine in your house, which makes your filter your main line of defense.
General guidance only, not medical advice. Follow your physician and the Bay Area Air District during air quality events.
One detail decides whether any of this works. EPA notes that furnace and HVAC filters clean air only while the system is actually running, and that most systems run less than 25 percent of the time during heating and cooling season. A MERV 13 sitting in a system on "Auto" is idle for most of a smoke event. Switching the thermostat fan to "On" is free, takes five seconds, and is the difference between owning a good filter and using one.
The filter grade matters more than anything else you can do indoors. PM2.5 particles are roughly one thirtieth the width of a human hair, small enough to reach deep into the lungs. Standard fiberglass filters are built to protect your equipment, not your lungs, and they let these particles pass. A MERV 13 filter captures 98 percent of airborne particles and is the grade EPA researchers point to for wildfire smoke.
Not sure what your system can take? MERV 11 handles the everyday Hayward particle load, and the MERV 8 to MERV 11 pressure drop chart shows what the added resistance actually costs. If you are unsure, check your HVAC manual or ask a licensed technician.
The mistake I see most often is a homeowner jumping to the highest MERV number on the shelf without checking what their system can pull air through. A MERV 13 that seals properly in the right size will out-perform a higher-rated filter that gaps at the edges, every time. Fit first, then rating.
David Clark, Licensed HVAC Technician, Filterbuy HVAC Solutions
Two habits make the difference in Hayward: check your filter monthly during fire season instead of quarterly, and keep a spare on hand. Auto-delivery handles the second one for you. Odd-size return? Filterbuy builds custom filter sizes to the fraction of an inch.
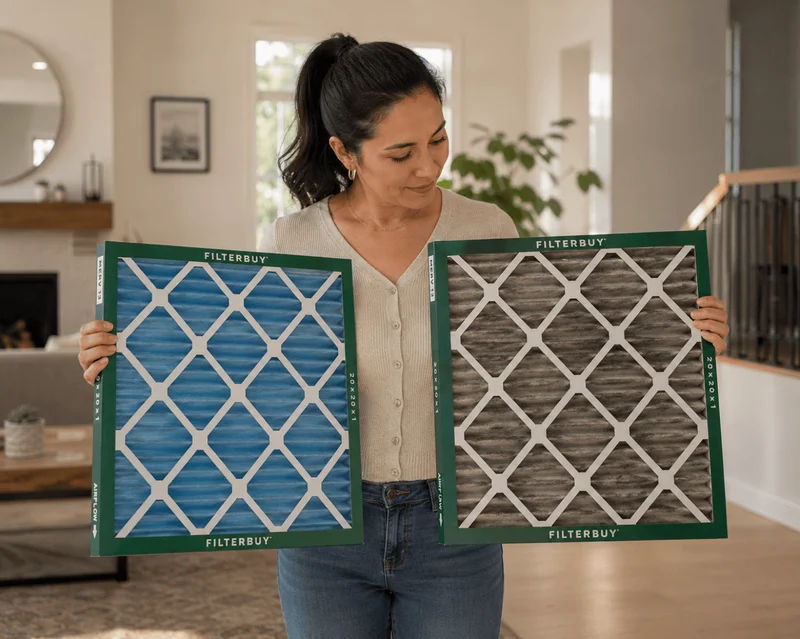
Know your size? Shop Filterbuy MERV 13 air filters in more than 600 sizes, made in the USA and shipped free.
If You Rent, or Cannot Change the Filter
Plenty of Hayward households have no access to the filter slot. Apartments, condos, in-law units and rooms in shared houses all fall outside the standard advice, so here is the version that applies to you.
Window and wall-mounted AC units barely filter. EPA states these are built for temperature control, and their filtration is meant to keep the unit clean rather than remove fine particles from your air.
Treat one room as the clean room. The bedroom is usually the right choice, because that is where you spend the most consecutive hours.
A box fan with a MERV 13 filter is a legitimate option, not a compromise. EPA measured these in a chamber and published the numbers in the table below.
Match the airflow to the room. EPA suggests roughly 65 CFM of clean air delivery per 100 square feet, so a 300 square foot bedroom wants about 195 CFM.
Use a box fan made in 2012 or later with a UL or ETL mark. EPA and Underwriters Laboratories tested these for fire risk and found none, but only newer fans have fused plugs and thermal cutoffs.
Renting does not have to mean waiting it out. It means moving the filtration to where you can control it, and MERV 13 filters come in the 20x20 sizes these builds use.
Supporting Statistics
Three findings from federal and national health research back the guidance above.
1. The Bay Area Is Improving and Still Lands on the Worst-25 List
Source: American Lung Association, State of the Air 2026, short-term particle pollution
61.5 million Americans live in counties graded F for particle pollution spikes.
That is 15.6 million fewer than last year, ending a seven-year climb.
San Jose–San Francisco–Oakland, the metro holding Hayward, stays on the worst-25 list.
It also posted its lowest weighted average for the second year running.
Worst-25 metros still average 12.9 high-particle days a year.
Hayward takeaway: two weeks of degraded air a year is not a rounding error. A better trend line does not change what you breathe on a smoky afternoon.
2. Wildland Fires Produce More Than Half of U.S. Fine Particle Pollution
Source: U.S. EPA, Wildland Fire Research: Reducing Exposures
52 percent of all PM2.5 emitted in the U.S. comes from wildland fires (2020 National Emissions Inventory).
EPA measured indoor and outdoor PM2.5 in buildings during real smoke episodes.
Two indoor steps mattered most: replace dirty filters, and raise the filter MERV rating.
Hayward takeaway: most of the particle load arrives with no local warning. That is why the zone forecast can read calm while your street does not.
3. A Loaded Filter Is Close to No Filter at All
Source: U.S. EPA chamber testing, Research on DIY Air Cleaners to Reduce Wildfire Smoke Indoors
EPA tested filtration setups against simulated wildfire smoke.
MERV 13 is the rating EPA specifies for smoke-sized particles.
Clean air delivery scales with the filter, not the fan. See the table below.
Source: U.S. EPA Office of Research and Development, chamber testing with simulated wildfire smoke (Holder et al., 2022). CADR is Clean Air Delivery Rate in cubic feet per minute; EPA reports each value with a measurement uncertainty of roughly 1 to 31 CFM. EPA found the same designs were almost completely ineffective once filters were loaded with smoke.
The most important finding is not in the table:
EPA found the same units were almost completely ineffective with dirty filters.
Check your filter daily during a smoke event.
Replace it when it looks grey or brown, or smells of smoke.
Hayward takeaway: the filter is the working part, and it wears out on smoke time, not calendar time. A MERV 13 filter that has absorbed two weeks of smoke is not doing the job its packaging describes.
Hayward Air Quality FAQ
Glossary
Air Quality Index (AQI) – The U.S. EPA 0–500 scale for reporting daily air pollution, divided into six color-coded health categories.
PM2.5 – Fine particulate matter 2.5 micrometers in diameter or smaller, small enough to reach deep into the lungs. The dominant pollutant in wildfire smoke.
Ground-level ozone – A gas formed when sunlight reacts with vehicle and industrial emissions. The main summertime cause of poor Bay Area air quality, commonly called smog.
Bay Area Air District – The regional air quality agency for the nine-county San Francisco Bay Area, formerly the Bay Area Air Quality Management District (BAAQMD). Runs the monitoring network and issues daily forecasts.
South Central Bay – One of five Bay Area Air District forecast reporting zones. Includes Hayward, San Leandro, Castro Valley, Union City, Fremont and several Peninsula cities.
Spare the Air Alert – A Bay Area-wide advisory issued when pollution is forecast to reach unhealthy levels in any reporting zone. Winter alerts carry a mandatory wood-burning ban.
MERV – Minimum Efficiency Reporting Value, the scale rating how effectively an air filter captures airborne particles. Filterbuy MERV 13 captures 98 percent of airborne particles, including those in the PM2.5 range.
NAAQS – National Ambient Air Quality Standards, the federal health-based limits the EPA sets for criteria pollutants. The annual PM2.5 standard is 9.0 micrograms per cubic meter.
Health note: this page is general guidance, not medical advice. If you have asthma, COPD or a heart condition, follow your physician and the Bay Area Air District during air quality events. For 24-hour air quality information, call the Air District at 1-800-HELP-AIR.
Sources: U.S. EPA Air Quality Index; Bay Area Air District reporting zones and alert criteria; EPA wildland fire research; EPA particulate matter basics; American Lung Association State of the Air 2026.