May 5, 2026

By David Heacock
The COVID-19 pandemic induced a historic shift to remote work and schooling. During the first coronavirus surge last spring, the Bureau of Labor Statistics reported that over 35% of workers teleworked because of the pandemic. While that figure has declined, about 17% of workers reported teleworking due to the pandemic just last month. In addition, a Census Bureau report shows that an astonishing 93% of households with school-age children engaged in some form of distance learning during the pandemic—a change that puts those lacking internet access at a severe disadvantage. According to the latest Census Bureau data, 11% of American households do not have access to the internet, and 29% don’t have broadband.
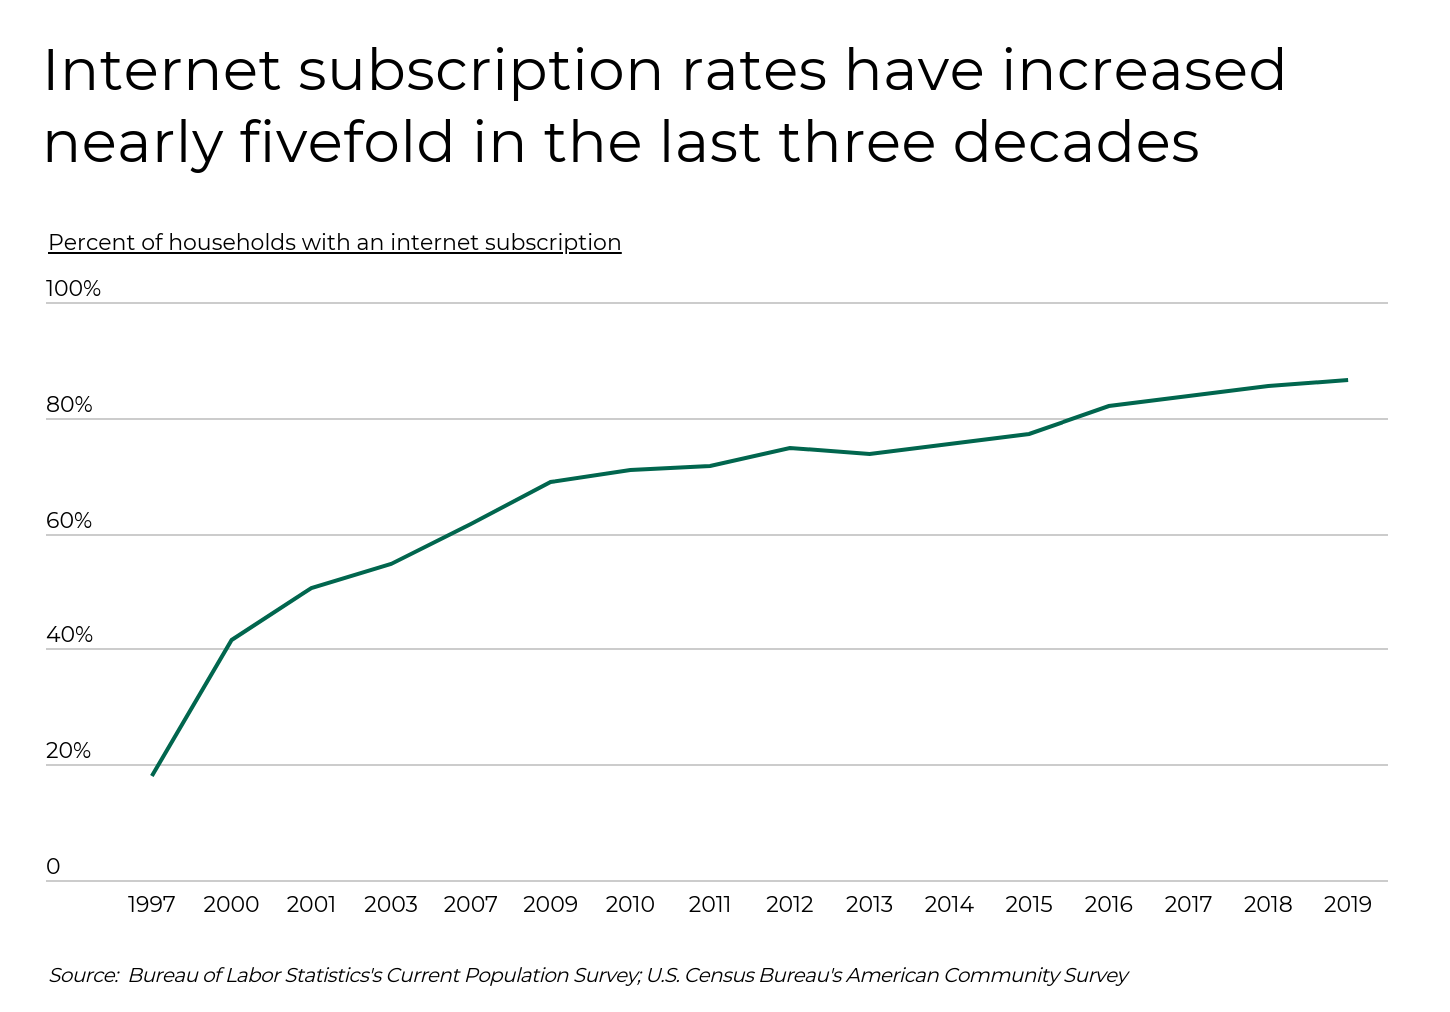
Internet access has achieved near-widespread adoption over the past two decades. In 1997, just 18% of households had an internet subscription, but twenty years later, that figure had climbed to 78%. As residents increasingly rely on the internet for a broad range of services, broadband has also become the norm. According to Census Bureau data, in 2019, 71% of households had broadband, while just 0.2% had dial-up. That said, a cell phone and accompanying data plan is the only way that roughly one in 10 American households access the web.
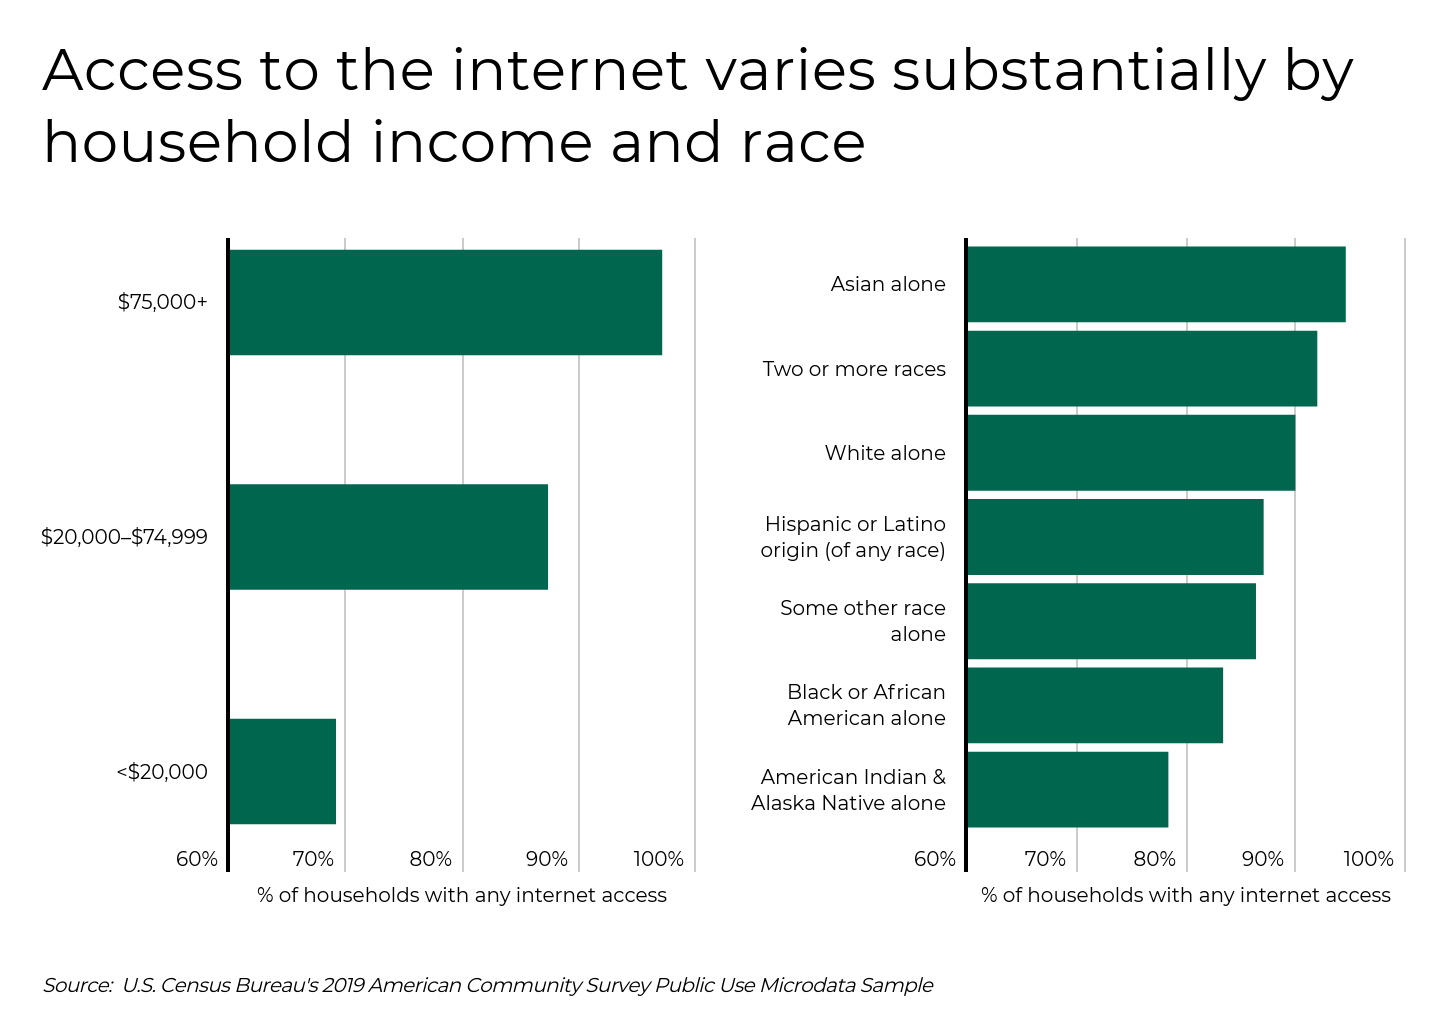
Remote schooling and work typically require access to the internet, but internet access varies by socioeconomic status and race. Wealthier households with incomes over $75,000 are much more likely to have access to the internet than lower-income households making less than $20,000 per year—97% compared to just 69%. When considering race, Black households and American Indian and Alaskan Native households are the least likely to have internet access, at 83% and 78%, respectively.
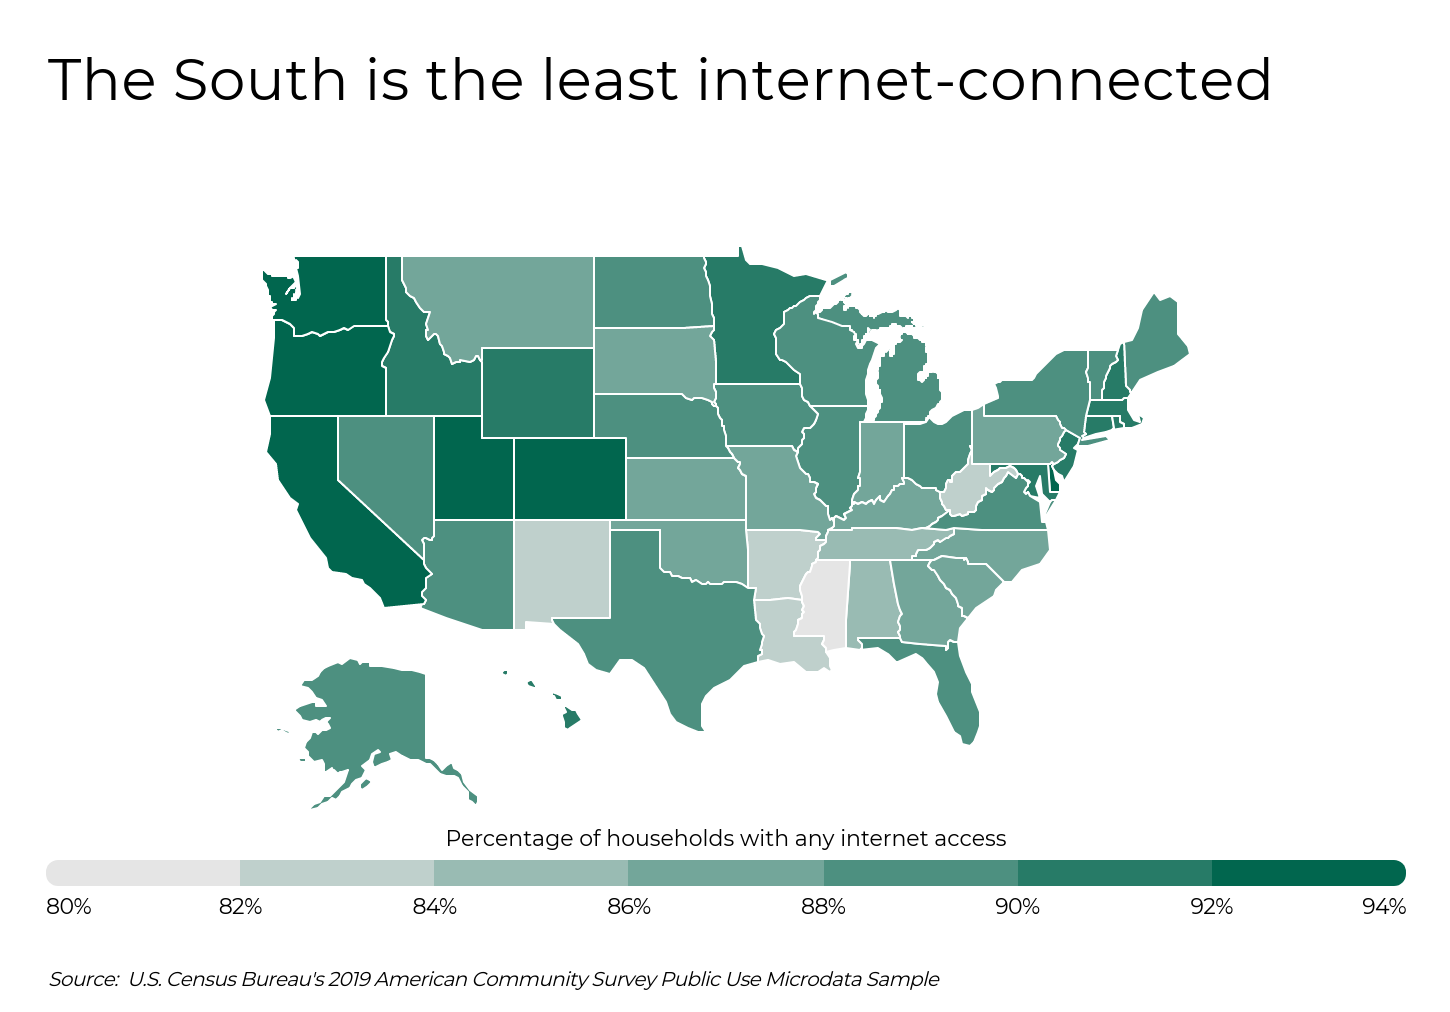
In addition to the socioeconomic and demographic differences in household internet access, there are geographic divides. On a regional basis, the South tends to have lower rates of household internet access while the West has the highest rates. With just 79.8% of households with any internet access, Mississippi has the lowest rate among all 50 states. At the opposite end of the spectrum, Utah households are the most likely to have access, where 94.4% of households have internet connections.
TRENDING Filterbuy’s MERV 13 air filters trap 98% of airborne particles, including mold, bacteria, and those that carry viruses. Consider replacing your home air filters with Filterbuy today.
To determine the least internet-connected metropolitan areas, Filterbuy analyzed data on internet access from the U.S. Census Bureau. Metro areas were ranked by the percentage of households who have any access to the internet—including broadband, satellite, dial-up, or cellular data. Researchers also calculated statistics on high-speed access, computer and smartphone ownership, cellular data plan usage, and household income.
Only metropolitan areas with at least 100,000 people were included in the analysis. Additionally, metro areas were grouped into the following cohorts based on population size:
Small metros: 100,000–349,999
Midsize metros: 350,000–999,999
Large metros: 1,000,000 or more
Here are the least internet-connected U.S. metros.
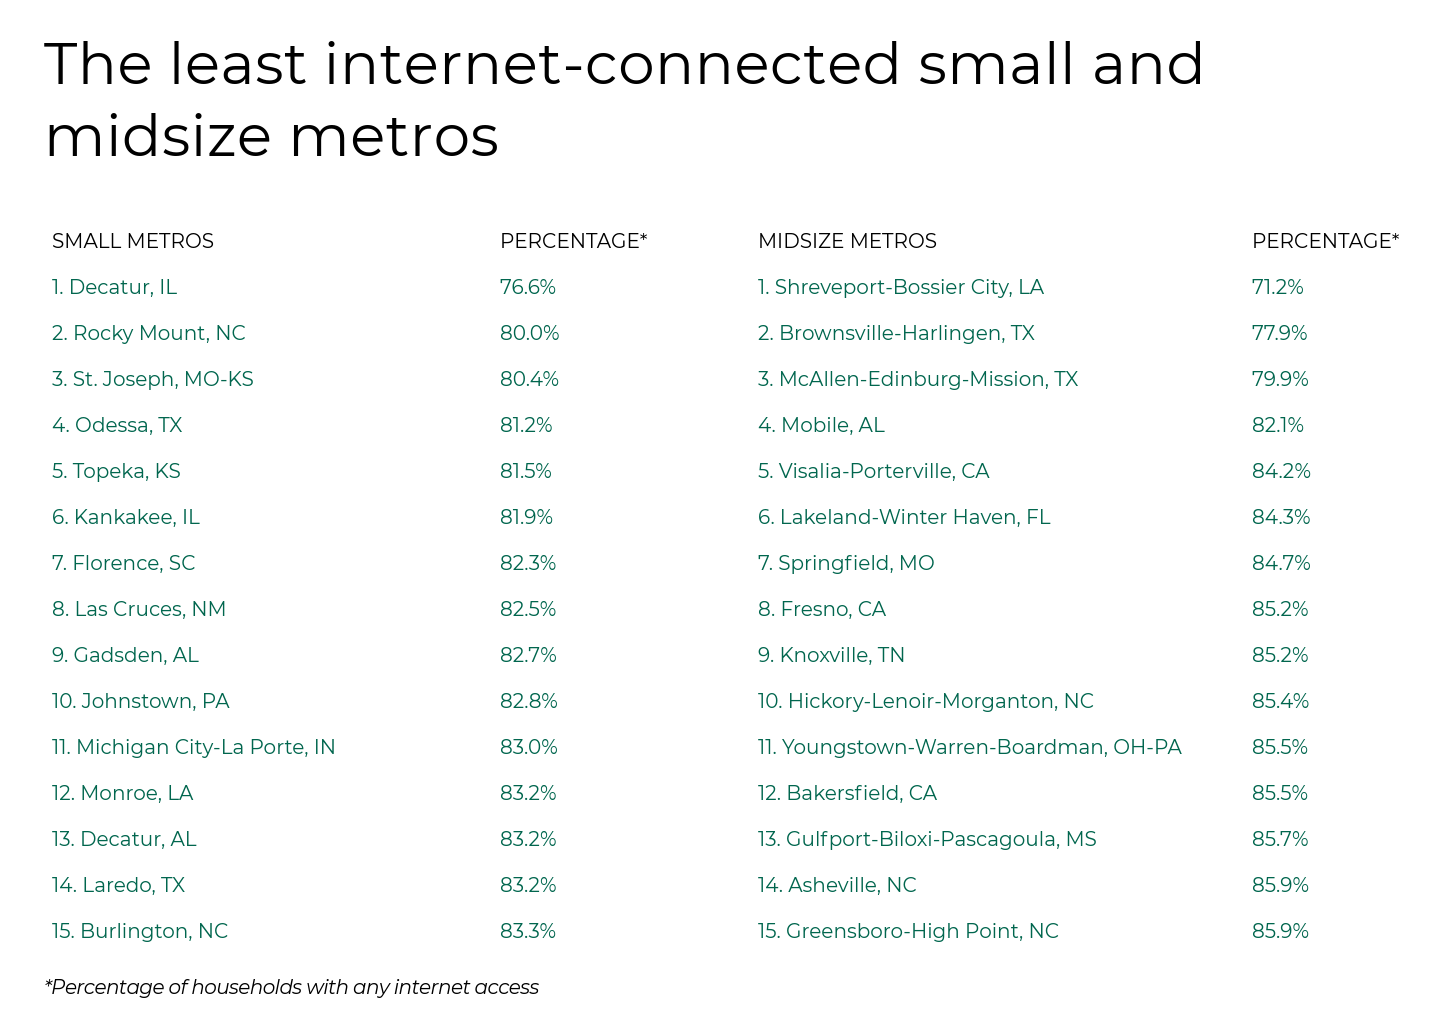

Photo Credit: Alamy Stock Photo
Households with any internet access: 89.2%
Households with high-speed internet access: 70.2%
Households with a computer or laptop: 75.2%
Households with a smartphone: 90.0%
Households whose only internet is a cellular data plan: 11.5%
Median household income: $60,600

Photo Credit: Alamy Stock Photo
Households with any internet access: 89.1%
Households with high-speed internet access: 74.5%
Households with a computer or laptop: 76.2%
Households with a smartphone: 82.3%
Households whose only internet is a cellular data plan: 9.6%
Median household income: $70,000

Photo Credit: Alamy Stock Photo
Households with any internet access: 89.1%
Households with high-speed internet access: 72.0%
Households with a computer or laptop: 76.3%
Households with a smartphone: 82.4%
Households whose only internet is a cellular data plan: 10.6%
Median household income: $61,000

Photo Credit: Alamy Stock Photo
Households with any internet access: 89.0%
Households with high-speed internet access: 72.5%
Households with a computer or laptop: 72.5%
Households with a smartphone: 88.5%
Households whose only internet is a cellular data plan: 9.0%
Median household income: $61,000

Photo Credit: Alamy Stock Photo
Households with any internet access: 89.0%
Households with high-speed internet access: 71.3%
Households with a computer or laptop: 74.6%
Households with a smartphone: 81.0%
Households whose only internet is a cellular data plan: 11.6%
Median household income: $58,800

Photo Credit: Alamy Stock Photo
Households with any internet access: 88.6%
Households with high-speed internet access: 71.0%
Households with a computer or laptop: 76.2%
Households with a smartphone: 85.7%
Households whose only internet is a cellular data plan: 11.4%
Median household income: $62,000

Photo Credit: Alamy Stock Photo
Households with any internet access: 88.5%
Households with high-speed internet access: 73.7%
Households with a computer or laptop: 75.7%
Households with a smartphone: 82.1%
Households whose only internet is a cellular data plan: 10.2%
Median household income: $63,000

Photo Credit: Alamy Stock Photo
Households with any internet access: 88.4%
Households with high-speed internet access: 71.7%
Households with a computer or laptop: 78.6%
Households with a smartphone: 90.1%
Households whose only internet is a cellular data plan: 10.3%
Median household income: $59,500

Photo Credit: Alamy Stock Photo
Households with any internet access: 88.1%
Households with high-speed internet access: 72.7%
Households with a computer or laptop: 76.2%
Households with a smartphone: 83.7%
Households whose only internet is a cellular data plan: 9.2%
Median household income: $66,500

Photo Credit: Alamy Stock Photo
Households with any internet access: 87.5%
Households with high-speed internet access: 63.0%
Households with a computer or laptop: 72.3%
Households with a smartphone: 85.9%
Households whose only internet is a cellular data plan: 16.4%
Median household income: $57,100

Photo Credit: Alamy Stock Photo
Households with any internet access: 87.3%
Households with high-speed internet access: 66.6%
Households with a computer or laptop: 73.4%
Households with a smartphone: 86.7%
Households whose only internet is a cellular data plan: 14.6%
Median household income: $60,400

Photo Credit: Alamy Stock Photo
Households with any internet access: 87.1%
Households with high-speed internet access: 70.3%
Households with a computer or laptop: 77.6%
Households with a smartphone: 86.3%
Households whose only internet is a cellular data plan: 10.8%
Median household income: $67,800

Photo Credit: Alamy Stock Photo
Households with any internet access: 86.0%
Households with high-speed internet access: 67.4%
Households with a computer or laptop: 71.9%
Households with a smartphone: 85.9%
Households whose only internet is a cellular data plan: 12.1%
Median household income: $55,000

Photo Credit: Alamy Stock Photo
Households with any internet access: 85.3%
Households with high-speed internet access: 69.4%
Households with a computer or laptop: 74.3%
Households with a smartphone: 83.3%
Households whose only internet is a cellular data plan: 8.7%
Median household income: $55,760

Photo Credit: Alamy Stock Photo
Households with any internet access: 83.1%
Households with high-speed internet access: 63.2%
Households with a computer or laptop: 68.5%
Households with a smartphone: 84.0%
Households whose only internet is a cellular data plan: 11.4%
Median household income: $54,500
The least internet-connected large metros are mostly a mix of lower-income Southern and Rust Belt cities. Compared to the national rate, these metros tend to have much lower rates of household internet access, ranging from 83.1% to 89.2%. Nationally, 89.1% of households have any internet access. However, this rate is pulled downwards by rural areas, which tend to have lower rates of internet access. Among all large metros, the average rate of household internet access is nearly 91%.
Nationally, the percentage of households with high-speed internet access is 70.8%, but households in the least-connected small and midsize metros are less likely to have high-speed internet, with high-speed internet rates among households as low as 38%. Similarly, households in the least internet-connected small and midsize are less likely to have a computer or a smartphone. Nationally, 11% of households only access the internet via a smartphone with a cellular data plan. But households in some of the smaller metros are much more likely to be in this situation—29% of households in the Brownsville, TX metro, for example, only access the internet with a smartphone and accompanying data plan.
Households without any internet access have been disproportionately impacted by the shift towards remote work and schooling. These households tend to be lower-income and are located in smaller cities and rural areas, which also have lower rates of household high-speed internet access and higher rates of smartphone-only internet access. A lack of high-speed internet access or smartphone-only internet access is also a big impediment to remote work and school.
To determine the least internet-connected metropolitan areas, Filterbuy analyzed data on internet access from the U.S. Census Bureau’s 2019 American Community Survey Public Use Microdata Sample. Metro areas were ranked by the percentage of households who have any access to the internet. In the event of a tie, the metro with the lower number of households with any internet access was ranked higher. Researchers also calculated the percentage of households with high-speed internet access, the percentage of households with a computer or laptop, the percentage of households with a smartphone, the percentage of households whose only internet access is via a smartphone and cellular data plan, and median household income.
Only metropolitan areas with at least 100,000 people were included in the analysis. Additionally, metro areas were grouped into the following cohorts based on population size:
Small metros: 100,000–349,999
Midsize metros: 350,000–999,999
Large metros: 1,000,000 or more