
Air Quality in Indiana
Air quality index (AQI⁺) and PM2.5 air pollution in Indiana •


Get Alerts For Unhealthy AQI In Your Area
When air quality in your area reaches unhealthy levels, we'll send you a quick alert, along with expert tips on how to reduce your exposure.
Live Air Quality Ratings in Indiana
Live Most Polluted City Ranking
Real-time most polluted cities in Indiana
Live Cleanest City Ranking
Real-time cleanest cities in Indiana
The Right Air Filter For High AQI Days
When outdoor air quality drops, the EPA recommends upgrading to a MERV 13 filter — or the highest-rated filter your HVAC system can handle — to help capture more of the fine particulate (PM2.5) that comes with poor air quality. MERV 13 is the highest rating most residential systems can run without restricting airflow.
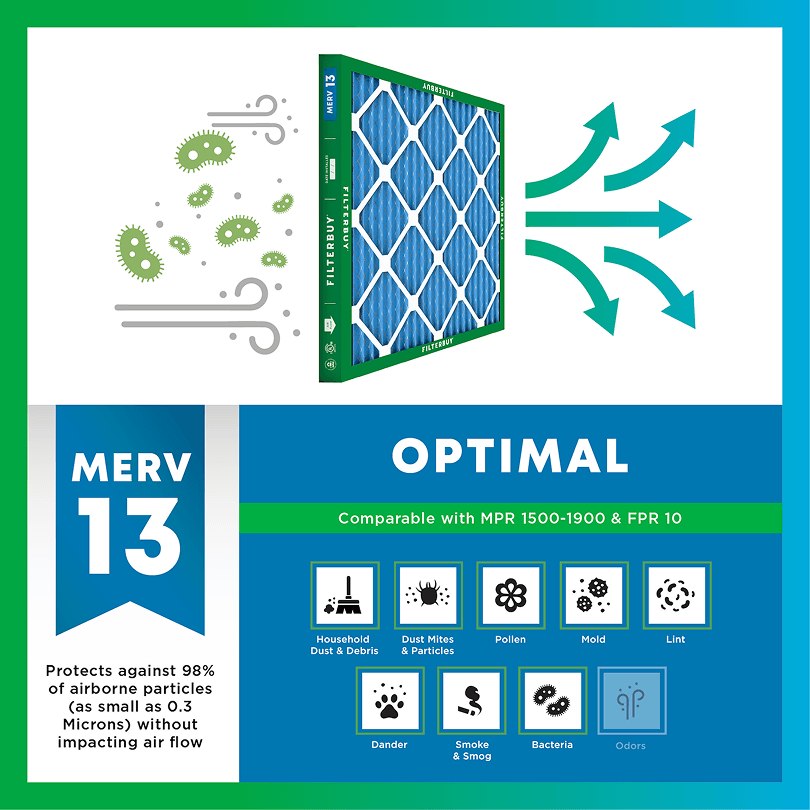

- Captures PM2.5 and other fine particulates
- Filters ash, soot, and smoke particles
- Rated to capture particles as small as 0.3 microns
- Matches the filter rating the EPA suggests during high-AQI and smoke events

AQI FAQs
What is AQI?
AQI stands for Air Quality Index, the EPA's scale for reporting daily air quality. It runs from 0 to 500. The higher the number, the greater the level of air pollution. Values at or below 100 are generally considered satisfactory; values above 100 mean air quality is unhealthy, first for sensitive groups, then for everyone as numbers climb.
What does AQI measure?
The AQI tracks five major pollutants regulated by the Clean Air Act: ground-level ozone, particle pollution (PM2.5 and PM10), carbon monoxide, sulfur dioxide, and nitrogen dioxide. The reported AQI value reflects whichever pollutant is highest at that time — most often ozone or fine particles (PM2.5).
How is AQI calculated?
Monitoring stations measure pollutant concentrations, and the EPA converts each into a standardized 0–500 score using set breakpoints. Each pollutant gets its own sub-index, and the highest sub-index becomes the reported AQI. That's why a single number can represent different pollutants on different days.
What is a good AQI?
An AQI of 0–50 is rated "Good" — air quality poses little or no risk. 51–100 is "Moderate," acceptable for most people though unusually sensitive individuals may want to limit prolonged outdoor exertion. Anything at or below 100 is generally considered satisfactory air quality.
What does an AQI of 100 (or 150) mean?
100 is the dividing line: at or below it, air quality is satisfactory for the general public. From 101–150, air is "Unhealthy for Sensitive Groups" — people with respiratory conditions, older adults, and children. From 151–200, it's "Unhealthy" and everyone may begin to feel effects.
Why is the AQI bad today?
Short-term AQI spikes usually come from wildfire smoke, temperature inversions that trap pollutants near the ground, high-ozone weather (hot, sunny, stagnant days), or heavy traffic and industrial activity. Check a real-time source like the map on this page to see which pollutant is driving today's reading in your area.
What AQI is bad for running or exercise?
Many runners follow the EPA category lines: below 50, no adjustment needed; 51–100, unusually sensitive people may shorten intense workouts; above 100, sensitive groups are advised to reduce prolonged or heavy outdoor exertion; above 150, that advice extends to everyone. Exercise increases how much air you breathe in, which is why thresholds matter more during workouts.
What AQI is safe to open windows?
A common rule of thumb is to keep windows open when the AQI is under 100 and close them when it climbs above, especially during wildfire smoke events when fine particles are elevated. When windows are closed, running your HVAC system with a fresh filter helps capture particles circulating indoors.
Should I wear a mask based on AQI?
Public health agencies generally suggest considering a well-fitted N95-style respirator outdoors when the AQI exceeds 150, particularly during smoke events. Cloth and surgical masks don't filter fine particles effectively. Follow guidance from your local health department, which may adjust recommendations during severe episodes.
Check Today's Live Real Time Air Quality Index AQI Map in Indiana Now
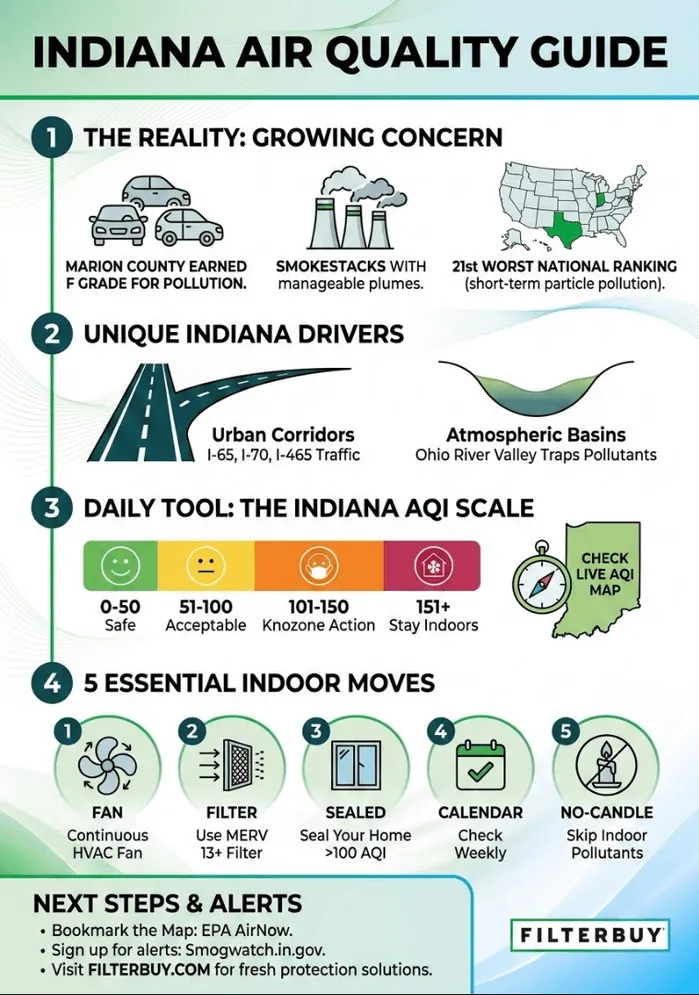
Marion County earned an F for both ozone and particle pollution in the most recent State of the Air report. Indianapolis-Carmel-Muncie now sits 21st on the national worst-list for short-term particle pollution. That's the headline most Hoosiers haven't read yet, and it's why this map matters.
After manufacturing filters for over a decade and serving more than two million households, we know what happens next. Outdoor AQI doesn't stay outdoors. The same particles a Marion County monitor flags at noon are circulating through your bedroom by dinner if nothing catches them on the way in.
The live readings below come from EPA AirNow stations across Indianapolis, Fort Wayne, Bloomington, and Evansville. Underneath the map, you'll find what those numbers mean for the people most at risk in your house, what's driving them this week, and the indoor moves that hold up when outdoor air refuses to.
TL;DR Quick Answers
What is the air quality in Indiana today?
The live map above shows real-time AQI readings for Indianapolis, Fort Wayne, Bloomington, Evansville, and the rest of the state. Indiana's calm-day baseline runs from 25 to 75 on the AQI scale, with documented spikes during ozone season, pollen peaks, and wildfire smoke transport events.
Indiana AQI bands and what they mean:
0 to 50 (Good, green): Safe for everyone, all activities
51 to 100 (Moderate, yellow): Acceptable for most, though sensitive individuals may notice symptoms
101 to 150 (Unhealthy for Sensitive Groups, orange): Knozone Action Day territory, where sensitive groups should limit outdoor exertion
151 to 200 (Unhealthy, red): Reduce outdoor activity for everyone
201+ (Very Unhealthy / Hazardous, purple/maroon): Stay indoors and run the HVAC fan continuously with a fresh, properly rated filter
Indiana's most common AQI drivers:
Ground-level ozone (May through September)
PM2.5 from vehicle emissions and industrial sources
Transported wildfire smoke from Canadian boreal fires
When to check:
Every morning during May through October, twice daily during active smoke events, and before any extended outdoor activity for sensitive groups year-round.
Top 5 Takeaways
Outdoor AQI determines indoor air quality without active filtration. Filters from Indiana customers run measurably dirtier during the summer months than winter ones.
Indiana's pollution sources stack. Vehicle emissions, ozone formation, agricultural burns, and Canadian wildfire smoke can all hit the same week.
Knozone Action Days are Indiana's early warning system. Sign up at smogwatch.in.gov to get alerts before unhealthy air arrives.
Sensitive groups span roughly 1 in 5 Marion County residents. Children, older adults, pregnant individuals, outdoor workers, and anyone with asthma, COPD, or heart disease should treat AQI checks as a daily habit during ozone season.
Indoor protection works. Closed windows, continuous fan, and a fresh filter make a measurable difference, and a properly rated filter handles the rest.
Why Indiana Air Goes from Clean to Unhealthy in Hours
The Indiana AQI in Plain Terms
The Air Quality Index is EPA's 0-to-500 scale. It packs ozone, particulate matter, carbon monoxide, sulfur dioxide, and nitrogen dioxide into a single number you can read at a glance. Indiana's calm-day baseline runs between 25 and 75. The bands climb from Good (0 to 50, green) through Moderate, Unhealthy for Sensitive Groups, Unhealthy, Very Unhealthy, and finally Hazardous (maroon, 301 to 500). Anything above 100 means somebody in your house should pay attention.
Most of Indiana's worst air days don't get cooked up in Indiana. Chemistry you can't see, and weather patterns transporting smoke from a thousand miles north do most of the damage.
What's Actually Polluting Indiana's Air
Three forces dominate. Vehicle emissions along I-65, I-70, and I-465 release nitrogen oxides that cook into ozone every time the sun gets aggressive. Industrial activity across Marion, Lake, and Porter counties adds particulate matter and volatile organic compounds. The wild card, increasingly the loudest one, is transported wildfire smoke from Canadian boreal fires that has driven repeated multi-day air quality alerts in Indiana since 2023.
Stack seasonal pollen, late-summer agricultural burns, and fall harvest dust on top of that, and you get a year-round pollutant calendar that shifts almost weekly.
How Knozone Action Days Work
The Indianapolis Office of Sustainability runs the public alert program called Knozone. When forecasted ozone or PM2.5 is expected to reach the Unhealthy for Sensitive Groups range, the city declares a Knozone Action Day. On those days, the city advises sensitive groups to limit outdoor exertion, including children, older adults, pregnant individuals, outdoor workers, and anyone managing asthma, COPD, or heart disease. Hoosiers can subscribe to text or email alerts at smogwatch.in.gov so the warning arrives before the air does.
Knozone Action Days cluster from May through September, when ozone formation peaks. They also show up during stagnant late-summer or early-autumn weather windows that trap PM2.5 close to the ground.
The Indiana Cities to Watch
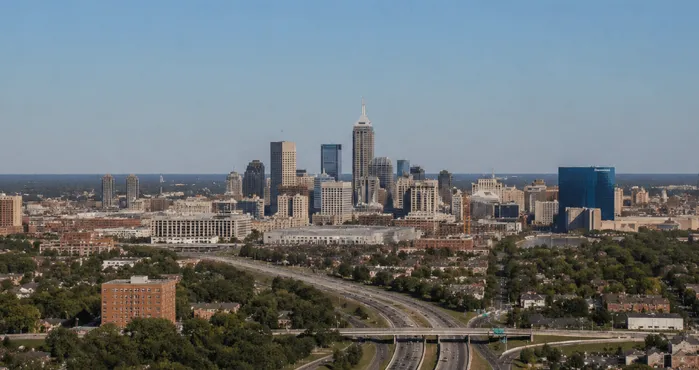
Indianapolis carries the worst grades in the state. The State of the Air F for both pollutants isn't an accident. Urban heat island effects, dense I-465 traffic, and the city's central position in the smoke transport corridor combine to push monitors higher here than anywhere else in Indiana. The Indianapolis live AQI map shows real-time readings from individual stations, including the West 18th Street and I-70 corridor monitors.
Fort Wayne usually breathes cleaner than Indianapolis, but not always. The I-69 corridor and proximity to Lake Michigan smoke transport patterns can spike summer PM2.5 sharply. Industrial activity around the St. Joseph and Maumee River basins adds local particulate sources during temperature inversions.
Bloomington tends to post the cleanest summer averages in central and southern Indiana, helped by elevation and lighter traffic density. IU campus seasonal swings and historical limestone quarry dust during dry weeks can push spring readings into the Moderate range. Pollen from the surrounding hardwood forests is more often the local concern than industrial emissions.
Evansville sits in the Ohio River valley, which creates atmospheric basin effects that trap pollutants during temperature inversions. Power generation and barge traffic along the river produce a particle pollution profile that doesn't look like northern or central Indiana.
Indiana's Pollen Calendar
Indiana's pollen calendar runs harder than most states'. Tree pollen from oak, maple, birch, and sycamore takes over from late March through May. Grass pollen runs the show from May through July. By August, fall ragweed combines with agricultural harvest dust through October, which tends to be the worst stretch of the year for allergy and asthma sufferers.
Pollen counts don't always show up on the official AQI band, because AQI tracks ozone and particulates rather than allergen concentrations. Cross-reference local pollen forecasts with AQI when planning outdoor time during transition seasons.
When Wildfire Smoke Reaches Indiana
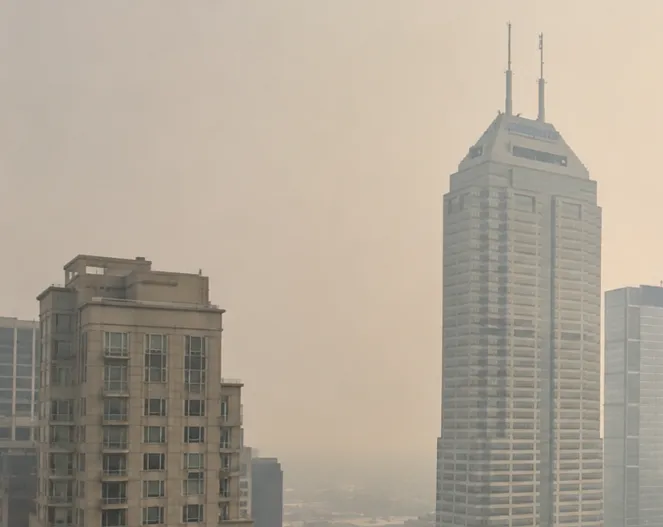
Smoke from Canadian boreal fires has become a regular feature of Indiana summers. In 2023, transported smoke triggered Knozone Action Days across multiple weeks in June and July. The pattern repeated in 2024 and again in 2025. PM2.5 from these events can stay elevated for 3 to 7 days at a time. On the worst stretches, you can see the haze hanging over downtown Indianapolis from the highway.
When wildfire smoke is in play, the AQI band can shift from Good to Unhealthy in under 12 hours as a smoke plume moves through. Checking the map twice a day during summer is a reasonable habit for anyone in a sensitive group.
How Indiana Air Quality Forecasts Work
Daily forecasts come from a combination of NOAA modeling, EPA AirNow data, and IDEM meteorologists who issue SmogWatch advisories for ozone and fine particulate matter. Forecasts are most reliable 24 to 48 hours out. They tend to slip during fast-moving smoke events. Knozone Action Day declarations usually arrive 12 to 24 hours before the unhealthy conditions show up.
The Indoor Moves That Actually Work
A few specific changes inside your house make the biggest difference once the outdoor AQI in Indiana climbs past 100.
Close windows and doors. Fresh air isn't always clean air.
Switch your HVAC fan to continuous instead of auto. More cycles through your filter means more particles captured.
Check your filter weekly during ozone season and smoke events. A loaded filter passes contaminants instead of holding them.
Step up to a higher-rated filter during the months when AQI spikes are predictable. Spring through early fall is when most Indiana homes benefit.
Skip indoor pollution sources when outdoor air is already loaded. Candles, the wood-fire pizza experiment, and deep-frying nights all add to what your filter has to handle.
Our customer data from Indiana ZIP codes confirms the pattern. Filter returns from June, July, and August arrive at significantly higher loading levels than winter shipments. That's direct evidence that outdoor AQI does what the maps suggest, only quietly, inside the homes that don't take action.
In Indiana, we see something that catches a lot of homeowners off guard: the same week that brings spring pollen also brings the first ozone alerts of the season, and by July, the wildfire smoke transport adds a third layer most filters aren't sized for. The right MERV rating during those weeks isn't a comfort decision. It's a respiratory one.
— Filterbuy Team
Essential Indiana Air Quality Resources
Seven authorities Hoosiers can lean on for context, alerts, and indoor-protection guidance. Each one comes from a federal, state, or city source that publishes Indiana data directly.
-
1
AirNow (EPA) Indiana State AQI Tracker
Real-time monitor-by-monitor readings, forecasts, and current AQI for every Indiana city with active monitoring.
-
2
Indiana Department of Environmental Management (IDEM) Air Quality Data
IDEM’s near-real-time statewide maps, pollutant concentrations, and meteorological data through the Data Management and Display System.
Source: Indiana Department of Environmental Management (IDEM) Air Quality Data
-
3
Indianapolis Office of Sustainability
The city’s sustainability program page with current Action Day declarations, historical records, and resident action steps.
-
4
American Lung Association Indianapolis-Carmel-Muncie Metro Page
Annual State of the Air grades, pollution rankings, and population-at-risk data for the Indianapolis metro region.
Source: American Lung Association Indianapolis-Carmel-Muncie Metro Page
-
5
EPA Wildfires and Indoor Air Quality
Practical guidance on protecting homes during smoke events, including clean room setup and HVAC filter recommendations.
-
6
CDC Air Pollutants Explainer
Health-effects breakdown of particulate matter and ozone with specific guidance for sensitive groups.
Source: CDC Air Pollutants Explainer
-
7
National Weather Service Indianapolis
Local forecast office page with regional weather and air quality outlooks specific to central Indiana.
Indiana Air Quality by the Numbers
Three figures Indiana homeowners should know:
-
1
Indianapolis-Carmel-Muncie Ranked 21st Worst in the Nation for Short-Term Particle Pollution
The Indianapolis-Carmel-Muncie metro area averages 9.8 unhealthy particle pollution days per year, and Marion County received an F grade for both ozone and particle pollution in the American Lung Association’s 2025 State of the Air report.
Source: lung.org State of the Air, Indianapolis-Carmel-Muncie metro
-
2
Americans Spend About 90 Percent of Their Time Indoors
EPA research shows indoor pollutant concentrations are often 2 to 5 times higher than outdoor levels, meaning Indiana’s outdoor AQI directly shapes the air most Hoosiers actually breathe every day.
-
3
Nearly 650,000 Indiana Adults Currently Live With Asthma
Approximately 9.7 percent of Indiana adults, around 647,729 people, currently live with asthma according to Indiana State Department of Health data based on CDC Behavioral Risk Factor Surveillance System reporting.
Source: Indiana State Department of Health, Respiratory Health Data and Reports
Final Thoughts
Tracking the AQI map matters, but it doesn't change anything on its own. The map tells you what you're up against. It doesn't change what gets into your bedroom, your kid's nursery, or the chair you read in. That's the homeowner's job, and it's where the real difference happens. Hoosiers shouldn't have to rebuild their lives around a Knozone alert. They should be able to keep living and trust their filtration to handle the rest. That's the entire reason we make what we make.
Next Steps
Three things to do before the next high-AQI day in Indiana:
Bookmark this page. Check it each morning during ozone season (May through September) and during any active wildfire smoke event. The map updates hourly from EPA monitoring stations.
Subscribe to alerts at smogwatch.in.gov. Knozone Action Day declarations will reach you before the air does. Text and email options are both free.
Inspect your HVAC filter today. If it's been in place longer than 30 days during pollen or smoke season, replace it. A fresh filter at the start of a high-AQI stretch will hold more contaminants over the next 30 days than a half-loaded one starting out.
Frequently Asked Questions
Get the Detail That Matters Most
For real-time city-level readings (including the West 18th Street and I-70 corridor monitors), check our dedicated Indianapolis page linked in the Cities to Watch section above.
To make sure your indoor air handles whatever the outdoor AQI throws at it, browse Filterbuy's filter selection by size and rating. Made in Alabama, Florida, Pennsylvania, and Utah. Shipped directly from our factory to your door.