
Air Quality in North Carolina
Air quality index (AQI⁺) and PM2.5 air pollution in North Carolina •


Get Alerts For Unhealthy AQI In Your Area
When air quality in your area reaches unhealthy levels, we'll send you a quick alert, along with expert tips on how to reduce your exposure.
Live Air Quality Ratings in North Carolina
Live Most Polluted City Ranking
Real-time most polluted cities in North Carolina
Live Cleanest City Ranking
Real-time cleanest cities in North Carolina
The Right Air Filter For High AQI Days
When outdoor air quality drops, the EPA recommends upgrading to a MERV 13 filter — or the highest-rated filter your HVAC system can handle — to help capture more of the fine particulate (PM2.5) that comes with poor air quality. MERV 13 is the highest rating most residential systems can run without restricting airflow.
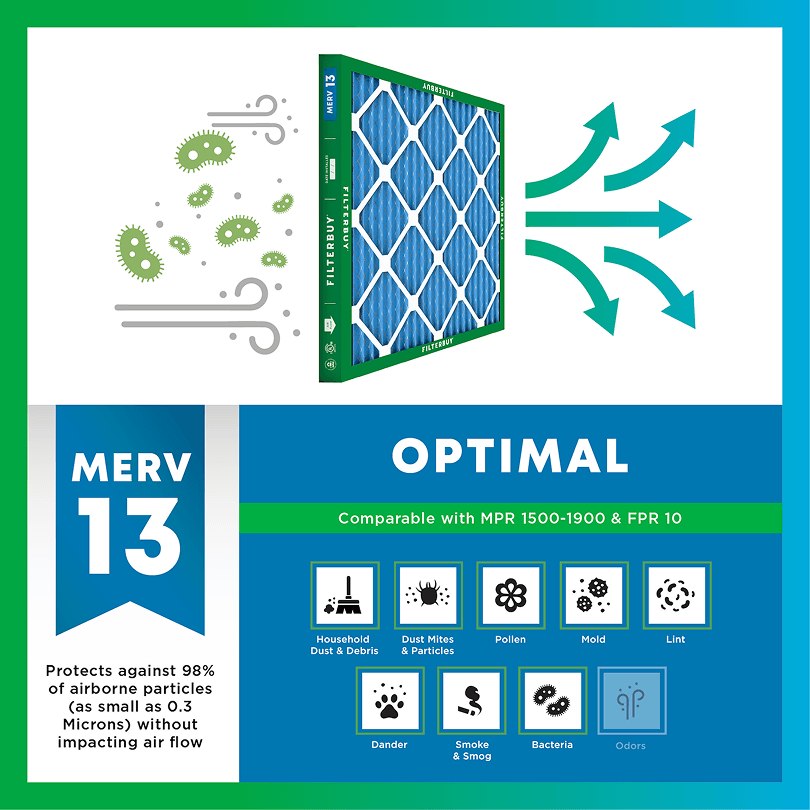
- Captures PM2.5 and other fine particulates
- Filters ash, soot, and smoke particles
- Rated to capture particles as small as 0.3 microns
- Matches the filter rating the EPA suggests during high-AQI and smoke events

AQI FAQs
What is AQI?
AQI stands for Air Quality Index, the EPA's scale for reporting daily air quality. It runs from 0 to 500. The higher the number, the greater the level of air pollution. Values at or below 100 are generally considered satisfactory; values above 100 mean air quality is unhealthy, first for sensitive groups, then for everyone as numbers climb.
What does AQI measure?
The AQI tracks five major pollutants regulated by the Clean Air Act: ground-level ozone, particle pollution (PM2.5 and PM10), carbon monoxide, sulfur dioxide, and nitrogen dioxide. The reported AQI value reflects whichever pollutant is highest at that time — most often ozone or fine particles (PM2.5).
How is AQI calculated?
Monitoring stations measure pollutant concentrations, and the EPA converts each into a standardized 0–500 score using set breakpoints. Each pollutant gets its own sub-index, and the highest sub-index becomes the reported AQI. That's why a single number can represent different pollutants on different days.
What is a good AQI?
An AQI of 0–50 is rated "Good" — air quality poses little or no risk. 51–100 is "Moderate," acceptable for most people though unusually sensitive individuals may want to limit prolonged outdoor exertion. Anything at or below 100 is generally considered satisfactory air quality.
What does an AQI of 100 (or 150) mean?
100 is the dividing line: at or below it, air quality is satisfactory for the general public. From 101–150, air is "Unhealthy for Sensitive Groups" — people with respiratory conditions, older adults, and children. From 151–200, it's "Unhealthy" and everyone may begin to feel effects.
Why is the AQI bad today?
Short-term AQI spikes usually come from wildfire smoke, temperature inversions that trap pollutants near the ground, high-ozone weather (hot, sunny, stagnant days), or heavy traffic and industrial activity. Check a real-time source like the map on this page to see which pollutant is driving today's reading in your area.
What AQI is bad for running or exercise?
Many runners follow the EPA category lines: below 50, no adjustment needed; 51–100, unusually sensitive people may shorten intense workouts; above 100, sensitive groups are advised to reduce prolonged or heavy outdoor exertion; above 150, that advice extends to everyone. Exercise increases how much air you breathe in, which is why thresholds matter more during workouts.
What AQI is safe to open windows?
A common rule of thumb is to keep windows open when the AQI is under 100 and close them when it climbs above, especially during wildfire smoke events when fine particles are elevated. When windows are closed, running your HVAC system with a fresh filter helps capture particles circulating indoors.
Should I wear a mask based on AQI?
Public health agencies generally suggest considering a well-fitted N95-style respirator outdoors when the AQI exceeds 150, particularly during smoke events. Cloth and surgical masks don't filter fine particles effectively. Follow guidance from your local health department, which may adjust recommendations during severe episodes.
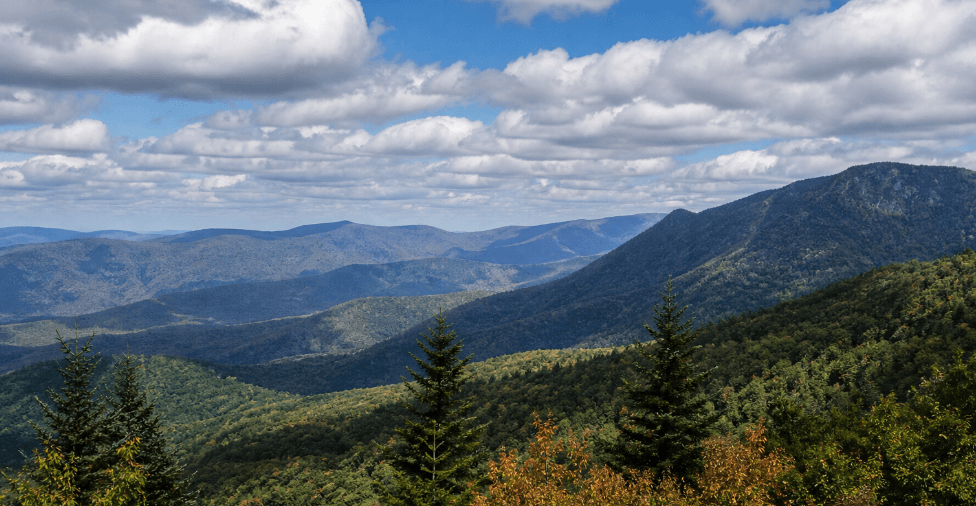
Check Today's Live Real Time Air Quality Index AQI Map in North Carolina Now
Open the live map above. The number for your county came from an EPA monitor minutes ago, and it will refresh again before you finish this paragraph. NCDAQ runs 48 monitor sites across the state, and what those sites pick up depends almost entirely on whether you live in Charlotte's Catawba Valley, the French Broad basin around Asheville, or somewhere in between.
What the map cannot tell you on its own is why Charlotte's reading at noon looks nothing like Asheville's. Charlotte's smog tends to pool in the Catawba Valley after a hot afternoon. Asheville's air is more often carrying smoke, sometimes from a fire two ridges away in Pisgah or Nantahala, sometimes from Western US plumes that reach the Appalachians on the upper-atmosphere jet. Triangle residents are usually fighting pollen and I-40 traffic instead of wildfire. The Coastal Plain runs on its own clock altogether, with Gulf moisture, prescribed burn smoke from Croatan and Holly Shelter, and the occasional hurricane aftermath setting the seasonal pattern.
Filterbuy built this page so you can see what's happening outside before deciding what to do about what's happening inside. Indoor air doesn't match the outdoor AQI most days. It usually runs worse, sometimes by an order of magnitude, depending on what filter is in your air handler right now and how long it has been there.
TL;DR Quick Answers
What's the AQI in North Carolina Right Now?
Check the live map at the top of this page for the current AQI in your county. NC air quality changes by the hour and varies sharply by region:
Mountains: Wildfire smoke and overnight inversion spikes are the dominant risk. Check before sunrise.
Piedmont (Charlotte, Triangle, Triad): Summer ozone and spring pollen dominate, with peak Code Orange days running from June through August.
Coastal Plain: Humidity, prescribed burn smoke from Croatan and Holly Shelter, and tropical-system aftermath set the pattern.
If today's reading is Yellow or higher, sensitive groups should limit outdoor exertion. For Orange or above, close windows, run your HVAC system on recirculate, and check that your filter is at least MERV 11. During active wildfire smoke events, the floor moves up to MERV 13.
Top Takeaways
Outdoor AQI is one signal among several. Indoor air usually runs worse than the map shows, because outdoor pollutants infiltrate through every opening in the building envelope, plus whatever fresh air your HVAC system pulls in.
North Carolina's air quality varies sharply by region. The Mountains contend with wildfire smoke and overnight inversion spikes, the Piedmont fights ozone and pollen across the Triangle, Triad, and Charlotte metros, and the Coastal Plain runs on humidity, prescribed burn smoke, and tropical-system aftermath.
Sensitive groups should treat Code Yellow as the warning line. Asthma, cardiovascular disease, pregnancy, and age over 65 all push the threshold for outdoor activity downward.
MERV rating sets the ceiling on what your filter can capture. MERV 8 handles basic dust and lint, MERV 11 adds pollen and mold spores plus most household particulates, and MERV 13 catches the 0.3-micron range that wildfire smoke and combustion sources actually occupy.
Filter change cadence is the move you actually control. Sixty days is a reasonable baseline for an average NC home, but drop to 45 during pollen peaks and run weekly visual checks during any active smoke event.
How to Read North Carolina's Live AQI Map Today
The map above pulls real-time particulate matter (PM2.5) and ozone readings from the same EPA monitor network behind every other US air quality dashboard, with hourly NowCast values that smooth out short spikes. Color-coded circles show the current AQI category at each station. Blue flame icons mark reported fire incidents, and purple markers flag satellite-detected hot spots that ground crews have not yet confirmed. When orange or red circles cluster anywhere near your county, that's the cue to close windows and check what's in your air handler.
The AQI scale runs from 0 to 500 across six categories: Good, Moderate, Unhealthy for Sensitive Groups, Unhealthy, Very Unhealthy, and Hazardous. Each category triggers a different set of actions for sensitive groups. EPA established the scale in the 1970s as the federal standard for communicating air pollution risk, and it has held that role through every revision of the National Ambient Air Quality Standards since.
For the science of how PM2.5, ozone, NO2, SO2, and CO concentrations roll up into the daily index, see the Air Quality Index page on Wikipedia. For most NC residents, two pollutants drive the daily reading: ozone in summer (May through September) and fine particulate matter year-round. PM2.5 is the dominant concern during pollen weeks, the prescribed burn season, and any wildfire smoke event.
Why Air Quality Varies Across North Carolina
Air quality patterns across North Carolina follow the same geographic lines as the state itself. What you see on the map for Asheville behaves differently from what you see in Charlotte, and the Coastal Plain runs on a third pattern altogether. Knowing which region you live in tells you which AQI category to watch first.
Mountains and Western North Carolina
Western North Carolina catches wildfire smoke from inside the state when Pisgah or Nantahala burns, from Western US fires that reach the Appalachians on prevailing winds, and increasingly from Canadian wildfires whose smoke drifts south on the upper-atmosphere jet during warm-season events. The French Broad Valley around Asheville also produces overnight temperature inversions that trap whatever pollutants happen to be near ground level. Asheville's AQI often runs worse before sunrise than at noon, which is why morning checks matter more here than in flatter parts of the state.
Piedmont, the Triangle, and the Triad
NC's ozone hotspots run through the Piedmont. The Triangle metros (Raleigh, Durham, Cary) and the Triad cities of Greensboro, Winston-Salem, and High Point lead the state in summer ozone exceedances, with Charlotte at the southwestern end of the same Piedmont arc. Ground-level ozone forms when vehicle and industrial emissions react with sunlight, and the I-40, I-85, and I-77 corridors keep a steady supply of those precursors flowing through these metros. Charlotte fights extra smog accumulation from the Catawba Valley terrain, which holds onto warm air longer than the open Piedmont. For Triangle-specific data, see Raleigh's live AQI map.
Coastal Plain
The Coastal Plain runs on a different schedule. Gulf moisture and prescribed burn smoke drifting north from Croatan and Holly Shelter set the seasonal pattern, with hurricane aftermath sometimes adding a particulate spike that lingers for weeks. High humidity creates secondary aerosols and accelerates indoor mold growth whenever outdoor PM2.5 spikes coincide with high dew points. The Wilmington metro has ranked among the cleanest US cities for multiple consecutive years, but coastal air still carries its share of seasonal smoke and tropical-system dust.
What's Actually Driving North Carolina's AQI Today
Ground-Level Ozone (May Through September)
Ozone runs the show in summer here. NCDAQ issues daily ozone forecasts from March 1 through October 31 because hot, sunny afternoons bake vehicle and power-plant emissions into the smog that the Piedmont's terrain tends to hold onto. The worst Code Orange ozone days usually arrive in late June through August, with the Triangle and Triad topping the exceedance counts most years and Charlotte not far behind.
Pollen and Biogenic Compounds
NC's pollen counts run among the highest in the country, with pine and oak leading the spring spike and grass species filling in through May. Pollen doesn't factor into the official AQI calculation, but it drives respiratory symptoms in millions of NC residents and infiltrates indoor air alongside whatever else the AQI map happens to be showing that day. The peak window stretches from late February through early May, with a secondary spike from late-summer ragweed.
Wildfire Smoke
North Carolina has its own wildfire history, not just imported smoke. The Western NC fire complex of fall 2016, including the Chimney Rock and Party Rock incidents around Lake Lure, saw 17 wildfires burning more than 53,000 acres across the region by late November, with AQI readings reaching Code Purple (Very Unhealthy) in Cherokee, Clay, Graham, and Macon counties during peak smoke days. Canadian wildfire smoke transport in June 2023 pushed Triangle air quality into Code Red (Unhealthy) territory, with Code Orange alerts spreading across most of the state, and Eastern coastal counties feeling the lightest load. Western US smoke arrives most often in late summer, carried east on the upper-atmosphere jet stream, with downwind impact across NC depending on how the plume mixes toward the surface.
Regional Transport and Industrial Emissions
Pollution doesn't respect state lines. Ohio Valley industrial emissions and I-95 corridor traffic both contribute to NC's baseline particulate load, particularly in the Piedmont, where prevailing westerly winds carry transported pollutants into the state. NCDAQ's monitoring network tracks these contributions through its 48 sites, operated jointly with the local programs in Buncombe, Forsyth, and Mecklenburg counties.
How NC's Outdoor Air Becomes Your Indoor Air
Here's the part the AQI map can't show you. Indoor air isn't separate from outdoor air. It's a delayed, concentrated version of it, dragged into the building through every door that opens, every window seal that has loosened, and every HVAC fresh-air intake your system runs.
After manufacturing filters for over a decade and serving more than two million households, we have watched a consistent pattern play out in NC home filters. Indoor PM2.5 typically reaches a lower peak than outdoor concentrations, with infiltration ratios ranging from about 0.2 to 0.7 depending on building airtightness, air change rate, and HVAC filtration. Indoor concentrations tend to respond within 1–2 hours of outdoor changes during smoke events, with tighter homes and high-efficiency filtration pulling those ratios lower. Indoor ozone runs at roughly 10–50% of outdoor levels because of rapid reactions with indoor surfaces (a 7–10 minute indoor half-life), so it tracks outdoor patterns in close to real time but at much lower concentrations. How long that delay actually runs comes down to how tight the building is, how often the HVAC system cycles, and what filter is currently sitting in the air handler. The AQI you watch at 3 PM is roughly the air you'll be breathing at bedtime.
The piece you actually control is the filter in your air handler right now. MERV 8 catches dust, lint, and basic pet dander, which is fine for an average week with low outdoor pollution. MERV 11 adds pollen and mold spores on top of most household particulates, which makes it the right ceiling for NC pollen weeks and Code Yellow ozone days. MERV 13 reaches down to 0.3-micron particles, the size range that wildfire smoke and most combustion-source PM2.5 actually occupy, and for NC homes during peak pollen or active smoke events, MERV 13 is the right call.
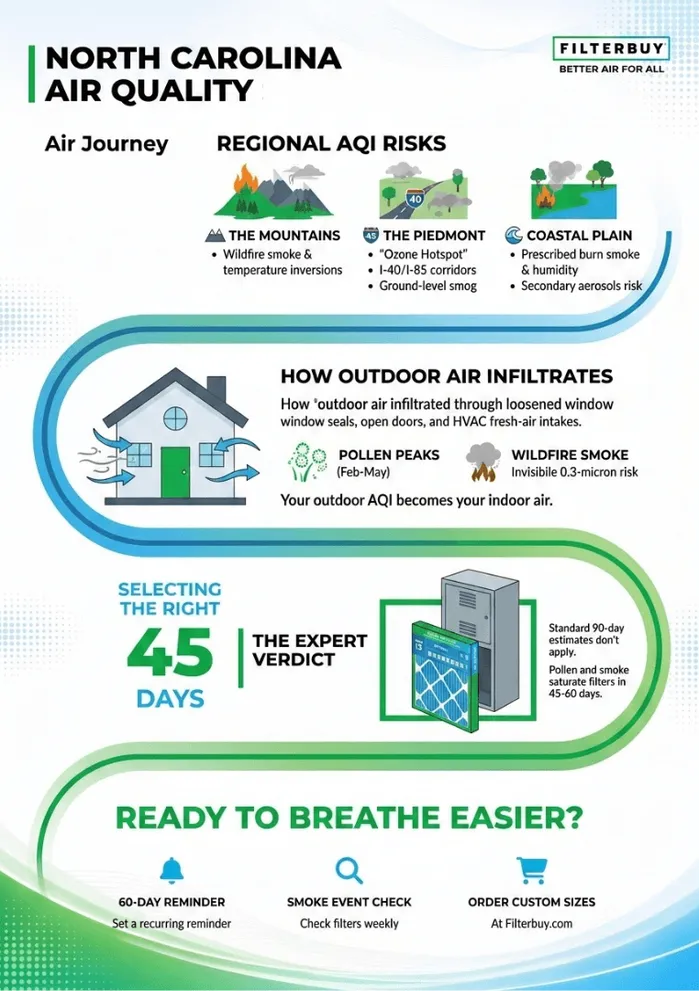
“After years of inspecting filters returning from North Carolina homes, I can tell you the spring pollen window from late March into early May pushes filter saturation faster than any other stretch on the calendar. A filter that would last 90 days in a low-particulate environment is at the end of its useful life in 45 to 60 days during Triangle and Piedmont pollen peaks. During wildfire smoke events, it drops to 30 days or less. The MERV rating you choose matters, but the change cadence matters at least as much.”
— Filterbuy Team
7 Essential Resources for North Carolina Air Quality
These seven sources do the heavy lifting when you're trying to make daily decisions about outdoor activity, school drop-offs, or weekend plans based on NC air quality. Each one comes from a different agency or organization, so you get coverage across federal monitoring, state forecasting, university science, and public health contexts.
EPA AirNow — North Carolina
The EPA's official AQI hub for North Carolina pulls real-time data from regulatory-grade monitors across all 100 counties. Search by ZIP code or city to find hourly NowCast values and the daily forecast, which covers ozone from March 1 through October 31 and PM2.5 year-round. The site also runs EnviroFlash, a one-click email alert that pings you whenever your county crosses an AQI category threshold you set. Bookmark this one. It's the foundation every other NC air quality routine on this list builds on.
Source: https://www.airnow.gov/?city=Raleigh&state=NC&country=USA
North Carolina Division of Air Quality
NCDAQ operates 48 monitoring sites across the state and publishes the daily AQI forecast, which EPA AirNow then displays on its map. The agency runs seven regional offices in Asheville, Mooresville, Winston-Salem, Raleigh, Fayetteville, Wilmington, and Washington, with each one handling air complaints, prescribed burn permits, and local compliance for the counties it covers. If you have ever wondered who actually runs the monitor near your house, this is the agency.
Source: https://www.deq.nc.gov/about/divisions/air-quality
North Carolina Air Quality Portal — Ambient Information Reporter
The State Climate Office at NC State University and the Division of Air Quality jointly run this portal. The AIR Tool inside it (Ambient Information Reporter) shows past, current, and forecasted air quality conditions for the entire state on a single interactive map, with live weather alongside. The portal also publishes the Forecast Discussion written by NC's air quality forecasters, which explains why today's number is what it is. That commentary is useful context you won't find on a generic AQI dashboard.
Source: https://airquality.climate.ncsu.edu/
American Lung Association: State of the Air
The Lung Association grades every NC county each year on its ozone load, on day-to-day particle spikes, and on year-round average particle pollution. The 2026 edition draws from 2022 to 2024 monitor data and lets you compare Charlotte, Raleigh-Durham, Asheville, and Wilmington against US peers on long-term trends. The report also breaks out population-at-risk numbers for asthma and cardiovascular disease, both of which shift the AQI threshold downward for the people in your home who have either condition.
Source: https://www.lung.org/research/sota
EPA Wildland Fires and Smoke
The EPA's central hub for wildfire smoke health information covers what to do before a smoke event arrives, during it, and afterward. The page hosts the Reduce Your Smoke Exposure factsheet, the Prepare for Fire Season checklist, and clean-room setup guidance, including which HVAC filter ratings actually move the needle when PM2.5 spikes. Western NC residents will find it most relevant during late-summer fire weather. Eastern NC residents will need it on Canadian smoke transport days, which have become more frequent since 2023.
Source: https://www.epa.gov/air-quality/wildland-fires-and-smoke
North Carolina DHHS Asthma Program
The North Carolina Department of Health and Human Services Asthma Program runs the state's official asthma surveillance and education work. The site publishes county-level prevalence data, school-based trigger management resources, and the Asthma Action Plan template that NC pediatricians and pulmonologists recommend for every household with an asthmatic member. The program's data dashboard helps put a Code Yellow or Code Orange day into perspective when someone in your house has reactive airways, and the page connects directly to the Healthy Schools NC initiative for classroom air quality.
Source: https://www.ncdhhs.gov/divisions/public-health/chronic-disease-and-injury-section/asthma-program
USDA Forest Service — National Forests in North Carolina
North Carolina has four National Forests (Pisgah, Nantahala, Uwharrie, and Croatan) covering more than 1.25 million acres of federal forest land. The Forest Service's NC page is where active fire conditions, prescribed burn schedules, and Stage 1 or Stage 2 fire restrictions get posted whenever fire weather warrants. When smoke shows up in the air around you, this is also the page that tells you whether it came from a managed burn or from an actual wildfire incident.
Source: https://www.fs.usda.gov/main/nfsnc/home
3 Supporting Statistics on North Carolina Air Quality
These three figures, drawn from federal and national health sources, frame why the AQI map at the top of this page actually matters for North Carolina families.
Indoor Air Pollution Often Runs Higher Than Outdoor
EPA exposure studies have found that indoor pollutant levels often run two to five times higher than outdoor concentrations, and in some cases more than a hundred times higher, even in homes nowhere near an industrial source. North Carolinians spend roughly 90 percent of their time indoors. Whatever the outdoor map shows for your county, the air your family is actually breathing is usually the larger health driver.
Source: https://www.epa.gov/report-environment/indoor-air-quality
North Carolina Counties Continue to Receive Failing Air Quality Grades
The American Lung Association's 2026 State of the Air report finds that 152.3 million Americans live in counties with failing grades for ozone or particle pollution. Several North Carolina counties continue to receive failing or borderline ozone grades, especially in the Charlotte and Raleigh-Durham metros, where summer heat and steady traffic on the I-40 and I-77 corridors interact with Piedmont topography to push photochemical smog past the federal standard.
Source: https://www.lung.org/research/sota/city-rankings/states/north-carolina
Hundreds of Thousands of NC Adults Live with Asthma
CDC's 2022 Behavioral Risk Factor Surveillance System publishes adult current asthma prevalence figures for every state. NC's adult population includes hundreds of thousands of residents living with asthma, and EPA categorizes every one of them as a sensitive group whenever AQI exceeds 100. That makes a Code Orange day in NC a doctor's orders day for a meaningful share of the state's working-age adults.
Source: https://www.cdc.gov/asthma-data/brfss-prevalence/2022-adult-current-prevalence-state-territory.html
Final Thoughts and Filterbuy's Opinion
Most AQI guides stop at the number. The number tells you whether to walk the dog right now. It doesn't tell you whether your family is breathing cleaner air than the family next door, because that depends entirely on what's happening inside your house.
From years of shipping filters into NC homes and watching what comes back after Triangle pollen weeks and Western NC smoke events, our position is straightforward. Outdoor AQI matters, but it's a single number. The numbers you actually control as a homeowner are your filter's MERV rating, your change cadence, and how long your HVAC system runs each day. Most NC households are underweight.
Air-obsessed isn't marketing copy at Filterbuy. It's a reading position. We use the AQI map as a daily prompt. Your filter sets the daily verdict every time the HVAC system cycles, and the cadence at which you replace that filter is what makes the verdict reliable.
Next Steps for Cleaner North Carolina Indoor Air
Six concrete actions, in order. None of them requires buying anything yet.
Bookmark a North Carolina-specific AQI source and check it once each morning, especially March through September.
Sign up for EnviroFlash alerts for your county so you don't have to remember to check on bad-air days.
If anyone in your home has asthma, seasonal allergies, or any cardiovascular condition, cross-reference your county's State of the Air grade against their personal tolerance threshold and adjust outdoor activity accordingly.
Check your current air filter today. If it's gray, brown, or showing any visible darkening at all, replace it now and document the date.
Match your filter MERV rating to your local conditions. MERV 11 covers most NC pollen weeks and Code Yellow ozone days, and MERV 13 is the move for wildfire smoke events or Code Orange particulate days.
Set a recurring 60-day reminder to swap your filter. During pollen peaks, drop the cadence to 45 days, and during active smoke events, run weekly visual inspections to catch saturation early.
Frequently Asked Questions on North Carolina AQI
Find the Right Air Filter for Your North Carolina Home
North Carolina's outdoor AQI is outside your control. The lever you do have is the air filter sitting in your HVAC system right now, and replacing it on a cadence that matches actual conditions gets you most of the way there. Find the MERV rating that fits your local pollutant load, the size that fits your air handler, and a delivery schedule that ensures a fresh filter is in the system when pollen, smoke, or Code Orange days arrive.
Filterbuy handles every part of that.