
Naperville Real-Time AQI Tracker


Get Alerts For Unhealthy AQI In Your Area
When air quality in your area reaches unhealthy levels, we'll send you a quick alert, along with expert tips on how to reduce your exposure.
What's Actually In Naperville Air Today?
What High AQI Means for Your Lungs in Naperville
How to Read AQI
The Air Quality Index (AQI) measures how polluted the air is and how it may affect your health.
0–50 (Good): Air quality is satisfactory.
51–100 (Moderate): Acceptable, but some pollutants may pose minor concerns.
101–150 (Unhealthy for Sensitive Groups)
151–200 (Unhealthy)
201–300 (Very Unhealthy)
301+ (Hazardous)
Moderate
Still okay for most, but if you have asthma or allergies, take it easy and avoid long outdoor workouts.
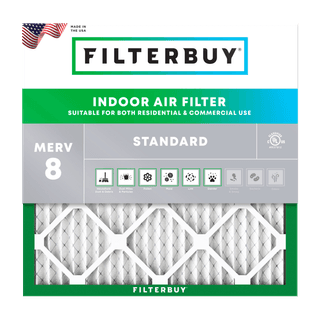
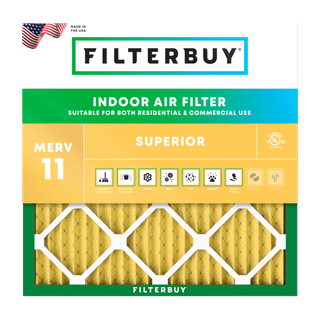
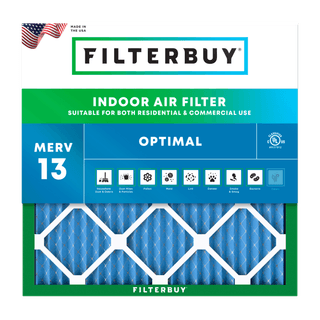
Shop MERV 11 filters→What's the Right Filter for Your AQI Level?



Check Today's Live Real Time Air Quality Index AQI Map in Naperville, IL Now
Author: Michelle Wan Reviewed by: David Clark, Licensed HVAC Technician Published: August 26, 2026 Updated: August 26, 2026
TL;DR
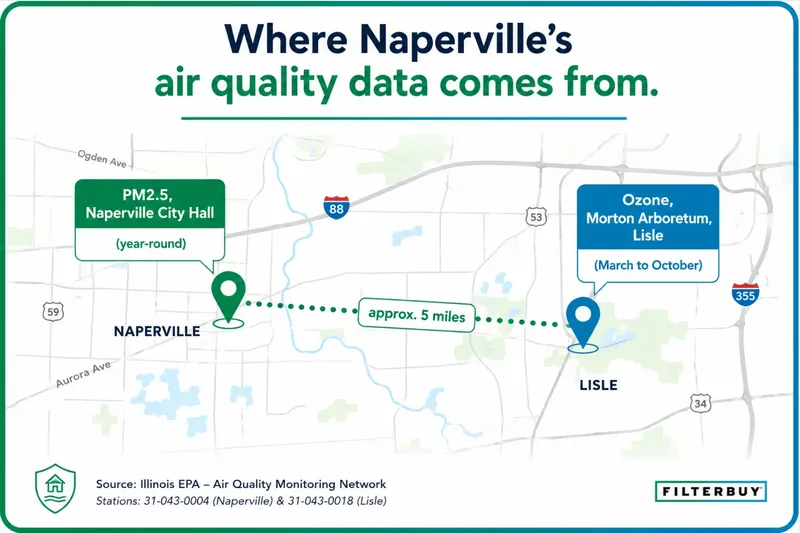
Naperville's air quality is measured by two different government monitors, and which one matters depends on the day. Fine particles (PM2.5) are measured here in town at Naperville City Hall, year-round. Ozone isn't measured in Naperville at all, so those readings come from the Morton Arboretum in Lisle, five miles northeast, and only from March through October. The "current" number on any app is also a 12-hour weighted calculation rather than a live reading. Below: which pollutant is behind today's figure, and what to do indoors.
Key Takeaways
An AQI at or below 50 is Good. Above 100 it's unhealthy for sensitive groups: children, older adults, anyone with asthma or COPD.
Naperville's only EPA regulatory monitor measures PM2.5, not ozone. It sits at City Hall, 400 S. Eagle Street (site ID 17-043-4002).
Ozone drives the worst summer afternoons, and the closest ozone monitor is five miles away at the Morton Arboretum in Lisle, running March through October.
DuPage County is in "Serious" ozone nonattainment as of January 16, 2025, with an August 3, 2027 deadline.
The metro exceeds two federal standards: ozone design value 109% of the limit, annual PM2.5 107%.
A MERV 13 filter captures fine particles, including wildfire smoke. It does not remove ozone.
Upgrade filter depth before rating. Our lab data shows a 4-inch MERV 13 strains a blower less than a 1-inch MERV 11.
What Is the Air Quality in Naperville Today?
Naperville's air quality today is whatever number the live map above is showing. The Air Quality Index folds pollutant concentrations into a single figure on a 0 to 500 scale, and it tracks health effects rather than how the sky looks. On a hot July afternoon the air can look perfectly clear at an AQI of 130, because ozone is invisible.
Most air quality pages stop right there. That's the least useful part, since the number itself is a feed anyone can license. The useful question is what it's measuring.
Where Does Naperville's AQI Number Actually Come From?
Naperville has exactly one EPA regulatory monitor inside city limits, and it measures fine particulate matter only. There is no ozone monitor in town, so any ozone reading attributed to Naperville comes from the next site over, in Lisle.
| Monitor Details | PM2.5 Monitor | Ozone Monitor |
|---|---|---|
| Location | Naperville City Hall, 400 S. Eagle St. | Morton Arboretum, Route 53, Lisle |
| EPA Site ID | 17-043-4002 | 17-043-6001 |
| Distance from Downtown | In town | ~5 miles northeast |
| Operating Season | Year-round | March–October only |
| Represents | Urban scale (citywide) | Urban scale (citywide) |
Source: Illinois EPA 2026 Ambient Air Monitoring Network Plan, Tables 1 to 3.
Two things follow. From November through February, Naperville has no local ozone data at all, so any winter figure has been modeled or borrowed. And both monitors are classified "urban," meaning each reading describes conditions across several miles rather than the air on your street, beside Route 59 at rush hour, or downwind of a neighbor's fire pit.
Why the Live Number Can Lag the Air Outside Your Door
The "current" AQI on this map, or on any air quality app, is not a live reading. It's the EPA's NowCast: a weighted average of the last 12 hours, tilted toward recent readings. In stable air it behaves like a straight 12-hour average, and when conditions shift quickly it compresses toward roughly a 3-hour average. Either way, it trails a fast-moving plume.
The AQI was designed as a daily measure, using a 24-hour average for PM2.5 and the day's highest 8-hour average for ozone. That works for tracking exposure over time, but nobody planning a 4 p.m. run wants yesterday's average, so the EPA publishes the NowCast alongside it.
On smoke days that weighting matters: a fast-rising plume shows up on screen smaller than it really is. A sharp one-hour spike may register at roughly half its size in the next hour's NowCast before the number catches up. So if you smell smoke the map hasn't registered yet, trust your nose, go inside, and check again in an hour.
Which Pollutant Is Driving Today's Number?
Most of Naperville's high-AQI days sort into one of two patterns, and telling them apart takes a few seconds.
Hot, sunny, still afternoon, 2 to 7 p.m., May through September? Almost certainly ground-level ozone. It forms when sunlight cooks vehicle and industrial emissions, so it peaks with the heat and clears overnight.
Hazy sky, campfire smell, or readings that persist overnight? That's PM2.5, usually transported wildfire smoke, or a winter inversion trapping exhaust near the ground.
Smoke is the more dramatic of the two. On July 16, 2026, wildfires in Canada and Minnesota pushed Chicago-area AQI into the Hazardous range, with readings above 600 in some northern suburbs, worse than June 2023. Filterbuy's wildfire smoke and AQI guide covers what to do when it happens again.
How Does Naperville's Air Compare to Federal Standards?
The EPA measures compliance with a "design value," averaging three years of readings at each monitor. Of the three standards that apply here, the metro clears one.
| Pollutant | Federal Standard | 2022–2024 Design Value | Status |
|---|---|---|---|
| Ozone (8-hour) | 70 ppb | 109% (≈76 ppb) | Exceeds |
| PM2.5 (annual) | 9.0 µg/m³ | 107% (≈9.6 µg/m³) | Exceeds |
| PM2.5 (24-hour) | 35 µg/m³ | 70% (≈24.5 µg/m³) | Meets |
Source: Illinois EPA 2026 Network Plan. The annual PM2.5 standard tightened to 9.0 µg/m³ in May 2024.
Is the Air Quality Bad in Naperville Today? What to Do at Each Level
| AQI | Category | What to Do |
|---|---|---|
| 0–50 | Good | Normal activity. Windows open. |
| 51–100 | Moderate | Fine for most; sensitive people may notice symptoms. |
| 101–150 | Unhealthy for Sensitive Groups | Kids, older adults, asthmatics shorten exertion. Close windows, fan to ON. |
| 151–200 | Unhealthy | Everyone limits exertion outside. Fan ON; no candles, frying, or non-HEPA vacuuming. |
| 201+ | Very Unhealthy / Hazardous | Stay indoors. Fan ON continuously; check the filter afterward. |
Categories per EPA AQI Basics. See Filterbuy's guide to choosing a MERV rating for high-AQI days.
What Outdoor Air Quality Means Inside Your Naperville Home
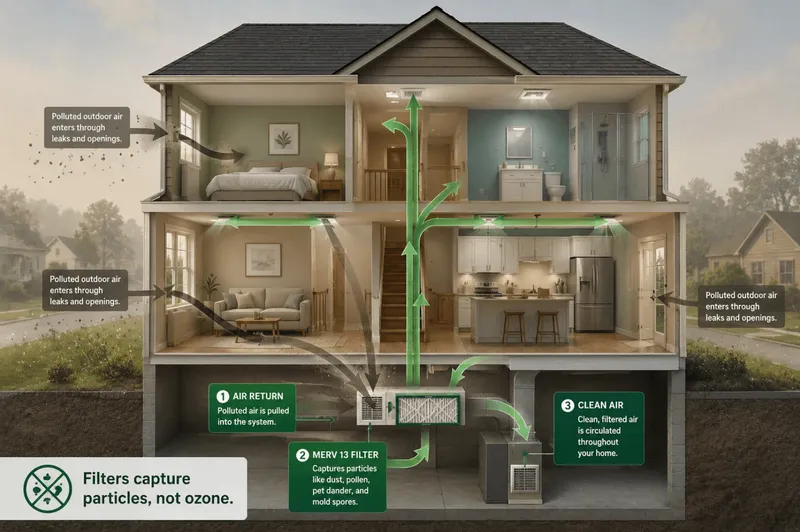
Fine particles don't respect your walls. PM2.5 slips through gaps around windows, doors, and ductwork, which is why indoor readings track outdoor smoke with only a short lag. The EPA notes that indoor levels of some pollutants run 2 to 5 times higher than outdoors, because what drifts in gets joined by what's already generated inside: cooking, cleaning products, dust, and pet dander.
Your HVAC filter is the one piece of equipment already sitting in the right place to do something about it. Under the ASHRAE 52.2 test method, a MERV 13 filter captures at least 50% of particles between 0.3 and 1.0 microns and at least 85% between 1.0 and 3.0 microns, which is where wildfire smoke lives. Running the fan continuously pulls room air through it repeatedly, instead of only when the AC cycles on.
One limitation is worth stating plainly. A MERV-rated media filter captures particles rather than gases, so it does nothing about ozone. On a high-ozone afternoon, the move that works is closing the windows and staying in. Filterbuy sells filters for a living, and we'll still tell you that anyone marketing one as an ozone solution is overselling it.
What Our Own Lab Data Says That Most Filter Advice Gets Backwards
Filterbuy is an American air filter manufacturer. We've built filters in the U.S. since 2013, and our published pressure-drop testing draws on more than two million of them. Two findings change what we'd tell a homeowner heading into smoke season.
Thickness beats rating. At 1,000 CFM, a 4-inch MERV 13 measures about 0.11" w.g. of airflow resistance, while a 1-inch MERV 11 measures 0.15 to 0.18". The higher-rated filter is the easier one on your blower, provided your return is deep enough. Upgrade depth before rating.
System age sets the ceiling. Equipment built in 2015 or later handles MERV 13 comfortably. But if your furnace predates 2005 and you only have a 1-inch slot, MERV 13 can push static pressure past the 0.5" most residential systems are designed for. That's the one case where we'd tell you not to buy our highest-rated filter.
Naperville’s own monitor only measures particles. On a hot July afternoon, the reading most people are looking at came from five miles away in Lisle, and it’s measuring the one pollutant a filter can’t touch. Knowing which number you’re reading tells you whether the fix is your filter or your windows.
David Heacock, Founder & CEO, Filterbuy
When you order, the number printed on your filter frame is the nominal size, usually about half an inch larger than the actual dimensions. Filterbuy makes more than 600 standard sizes plus custom dimensions, and auto-delivery sends the right one on schedule.
Supporting Statistics
Three findings from federal and national health authorities put those numbers in context.
1. The Metro Still Fails on Ozone, Though the Trend Is Improving
18 unhealthy ozone days a year in Cook County, the metro's worst-scoring county, down from 20.3.
Ranked 15th worst of 226 U.S. metros for ozone.
2,206,982 Illinois children live where the air earned a failing grade.
Source: American Lung Association, "State of the Air" 2026, Illinois findings, April 21, 2026
2. Wildfire Smoke Is Now the Largest Source of U.S. Fine Particle Pollution
Wildland fires produced 52% of all PM2.5 emitted nationwide, more than every other source combined.
A hazy Naperville afternoon is as likely to have started 800 miles north as on Route 59.
Source: U.S. EPA, Wildland Fire Research: Reducing Exposures, 2020 National Emissions Inventory
3. Filtration Cuts Indoor Particle Levels Roughly in Half
EPA guidance for physicians gives three figures, best to worst:
~50% lower indoor PM2.5. MERV 13 or higher, fan switched from AUTO to ON.
~24% lower. Typical low-efficiency filter, fan running continuously.
55 to 60% of outdoor levels. Windows closed, no filter upgrade, no air cleaner.
The gap between the first line and the third is what your filter choice is worth.
Frequently Asked Questions
Glossary
AQI (Air Quality Index): a 0 to 500 EPA scale converting pollutant concentrations into one color-coded number. 0 to 50 Good; 301+ Hazardous.
NowCast: the EPA's weighted hourly calculation for current AQI, drawn from the last 12 hours of data.
PM2.5: fine particulate matter 2.5 micrometers or smaller, roughly 1/30th the width of a human hair and small enough to reach deep into the lungs.
Ozone (ground-level): a gas formed when sunlight reacts with vehicle and industrial emissions. The main ingredient in smog.
NAAQS: the EPA's health-based National Ambient Air Quality Standards for six criteria pollutants.
Design value: a multi-year average calculated at each monitor and compared against the NAAQS.
Nonattainment: an EPA designation for an area exceeding a federal standard. Tiers run Marginal, Moderate, Serious, Severe, Extreme.
MERV: Minimum Efficiency Reporting Value, a 1 to 16 scale under ASHRAE 52.2 rating how well a filter captures particles.
AirNow: the EPA's official air quality reporting platform, run with state agencies like the Illinois EPA