
Orange Real-Time AQI Tracker


Get Alerts For Unhealthy AQI In Your Area
When air quality in your area reaches unhealthy levels, we'll send you a quick alert, along with expert tips on how to reduce your exposure.
What's Actually In Orange Air Today?
What High AQI Means for Your Lungs in Orange
How to Read AQI
The Air Quality Index (AQI) measures how polluted the air is and how it may affect your health.
0–50 (Good): Air quality is satisfactory.
51–100 (Moderate): Acceptable, but some pollutants may pose minor concerns.
101–150 (Unhealthy for Sensitive Groups)
151–200 (Unhealthy)
201–300 (Very Unhealthy)
301+ (Hazardous)
Moderate
Still okay for most, but if you have asthma or allergies, take it easy and avoid long outdoor workouts.
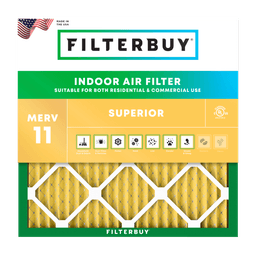
Shop MERV 11 filters→What's the Right Filter for Your AQI Level?


Check Today's Live Real Time Air Quality Index AQI Map in Orange, CA Now
By Michelle Wan, Brand Manager and Air Quality Writer at Filterbuy, a U.S. air filter manufacturer · Technically reviewed by David Clark, Licensed HVAC Technician, Filterbuy HVAC Solutions · Updated August 28, 2026
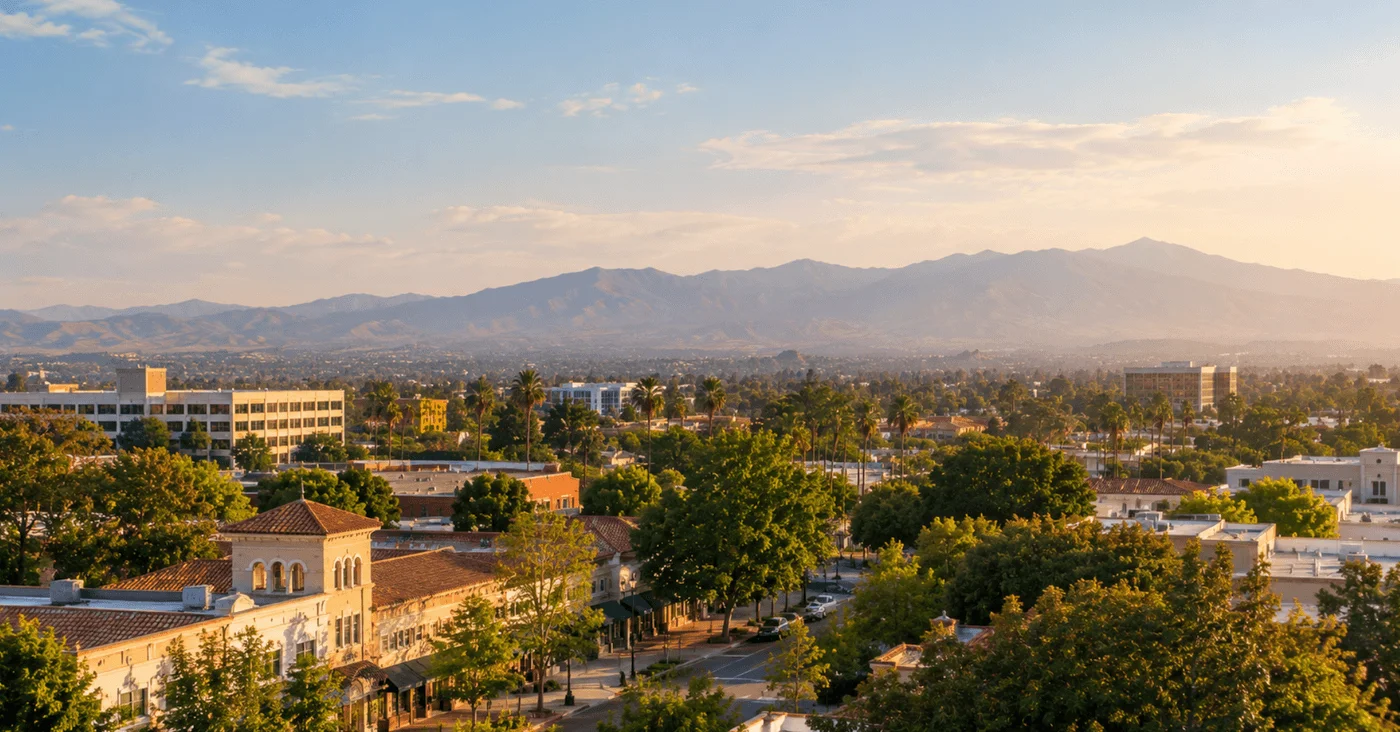
Orange sits in a spot that makes air quality hard to guess from your window. Four freeways frame the city, the Santa Ana Mountains rise a few miles east, and Santiago Canyon opens onto its eastern edge. The map above reads the air itself, so you know what is out there before your eyes do.
→ Check the Live Air Quality Map of Orange, CA
TL;DR Quick Answers
Live Air Quality Index Now Today in Orange, CA
The city falls inside South Coast AQMD’s Central Orange County monitoring area, Source Receptor Area 17. The Filterbuy live map above pulls hourly readings from EPA and AQMD stations, including Anaheim–Loara School and the Anaheim Route 5 near-road site. Most days here run Good (0–50) or Moderate (51–100).
AQI Scale Quick Reference
| AQI Range | Category | What to Do in Orange |
|---|---|---|
| 0–50 | Good | No precautions. |
| 51–100 | Moderate | Unusually sensitive people ease off. |
| 101–150 | Unhealthy for Sensitive Groups | Kids, adults over 65, and anyone with asthma or heart disease cut back. |
| 151–200 | Unhealthy | Everyone cuts outdoor time. |
| 201–300 | Very Unhealthy | Stay in, HVAC recirculating. |
| 301+ | Hazardous | Emergency. |
Top Takeaways
Orange’s air changes by pollutant and season, not by a yearly average. Ozone peaks summer afternoons, particles during autumn Santa Anas and winter inversions.
The South Coast Air Basin, Orange County included, carries the EPA’s “Extreme” ozone nonattainment classification on the federal Green Book list.
Check which pollutant drives the number. Ozone and PM2.5 at the same AQI call for opposite responses, and only one is a filtration problem.
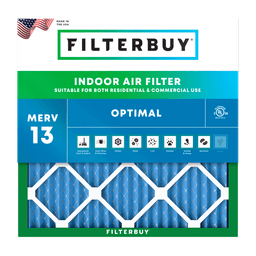
MERV 13 is the smoke-season upgrade; MERV 11 handles everyday air. Only run what your HVAC is rated for.
Zoom out with California’s statewide AQI map, or compare Los Angeles in the same air basin.
How to Read Today’s Orange Air Quality Map
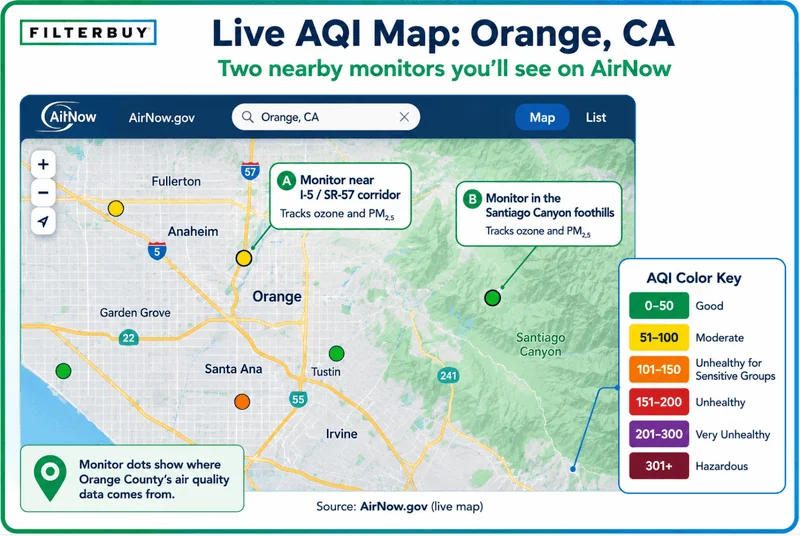
Each colored dot is a live AQI reading from a nearby monitor, green through maroon. In Orange, which dot you read matters more than in almost any city we cover. The Orange Crush interchange, where the I-5, SR-22, and SR-57 converge inside city limits, moves an estimated 629,000 vehicles a day, and SR-55 runs the eastern flank. Monitors near that traffic catch exhaust and brake particles a foothill monitor may never see.
That split maps onto real neighborhoods. The western edge near the Orange Crush often reads higher than Orange Park Acres, El Modena, and Santiago Hills toward Santiago Canyon Road, with Old Towne Orange and Chapman University between them. Read the dot nearest you rather than the city average, and make it a habit if anyone at home has asthma, COPD, or heart disease. Our guide to reading an AQI map by ZIP code goes deeper.
What Drives Poor Air Quality in Orange, CA
Three sources do most of the work here, and they rarely arrive together.
Ground-level ozone is the summer problem, and Orange’s position works against it. The sea breeze pushes coastal emissions inland all afternoon, so the foothill side of the city receives smog formed miles away. The EPA classifies the Los Angeles–South Coast Air Basin as an Extreme ozone nonattainment area, the most severe class the Clean Air Act assigns.
Traffic particles are the quieter baseline underneath it all. They never spike the way smoke does, which is why people stop noticing them. Regulators would not have sited a near-road station here if one city number told the story.
Wildfire smoke is the sharpest spike, and it arrives with the wind rather than the calendar. CAL FIRE records the Canyon 2 Fire at 9,217 acres and 25 structures destroyed after it started on October 9, 2017, with the City of Orange in the unified command. Our PM2.5 guide and the EPA’s overview explain what those particles do.
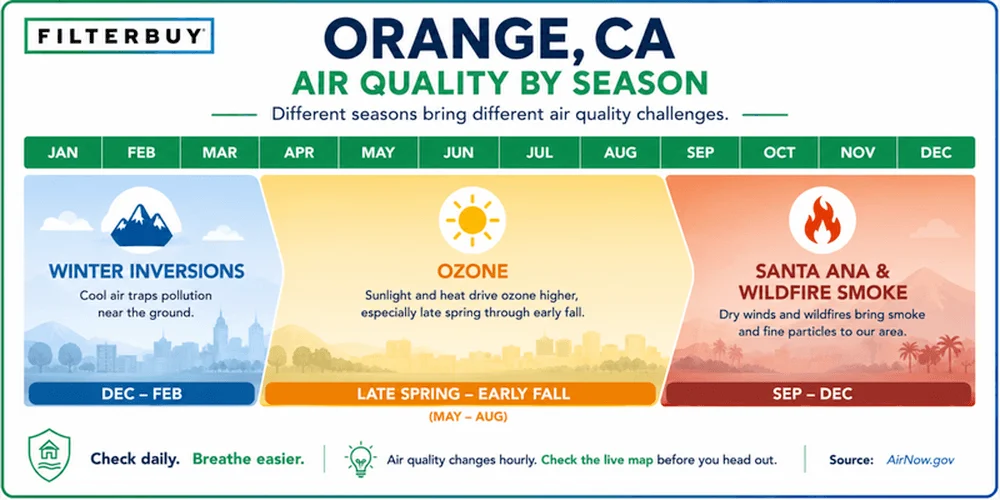
Orange’s Air Quality Calendar, and When to Check the Map
Orange runs on a seasonal rhythm, so your routine should change with it.
Late spring to early fall, ozone season. Readings climb through the afternoon and peak roughly 1 p.m. to 6 p.m.
September to December, Santa Ana season. Offshore winds funnel down the canyons, humidity collapses, and fire risk climbs. With a fire within 100 miles, check every two to four hours.
December to February, inversions. Cool, stable air traps particles near the ground, worst before dawn and after dinner.
When the map turns orange, move hard exercise to early morning and away from the freeways. Cap kids’ play above AQI 100 and bring them in above 150.
What the AQI Number Doesn’t Tell You
An AQI reading names only the worst pollutant, so two Orange days can both read 95 and call for opposite responses.
When ozone drives it, typical on hot afternoons here, the pollutant is a gas. Sealing the house and running the HVAC helps less than people expect, because pleated filters capture particles rather than gases. Timing is the lever instead: stay in through the peak, then reopen once ozone falls.
When PM2.5 drives it, meaning smoke, Santa Ana dust, or a winter inversion, the pollutant is a particle and filtration genuinely works. Close the house, recirculate, and let a MERV 11 or 13 do its job.
Every live AQI map names the driving pollutant beside the number, including the Orange map on this page. Read it first. It sorts a response that works from one that only feels productive.
Protecting Indoor Air in Your Orange Home
During a smoke event, set the system to recirculate and close the fresh-air damper, then pick one room to keep cleaner than the rest, ideally a bedroom with few exterior walls. Most Orange homes do well on a Filterbuy MERV 11 year-round, with MERV 13 swapped in for smoke if the blower is rated for it. We say rated for it deliberately, because a filter your system cannot pull air through protects less than the one it replaced. Our MERV-by-AQI breakdown shows how to check yours.
For the chemical smell that lingers once smoke passes, Filterbuy’s Odor Eliminator carbon filter adds what a fiber-only filter cannot. South Coast AQMD’s smoke and ash guidance covers cleanup afterward.
Our Honest Take on Checking Air Quality in Orange
Most people check the AQI the way they check the weather, once, at breakfast. In Orange that fails, because ozone crests in late afternoon and winter inversions crest overnight. A breakfast reading lands in the calmest stretch of either day.
The other trap is subtler, because it runs against your senses. Santa Ana days look spectacular. Haze lifts off the basin, the mountains sharpen, and the air feels bone dry. That is precisely when people throw the windows open, and it is the same wind carrying canyon dust and smoke across the city. Trust the number, not the view.
People treat the AQI as one yes-or-no answer for the whole day. In Orange it isn’t. The freeway side and the canyon side are different questions, and so are morning and late afternoon. Check twice, and read the dot nearest you.
Michelle Wan, Brand Manager and Air Quality Writer, Filterbuy
We come at this from the manufacturing side. Filterbuy has built pleated filters in the U.S. since 2013, across four plants and a California distribution center, and that vantage teaches something unglamorous. Southern California orders climb within hours of a canyon fire igniting, so the window has closed by the time most people act. The filter sitting in your system when smoke arrives is the only one that protects anybody. Buy it in August.
Supporting Statistics
The research behind Filterbuy’s guidance on this page.
1. Orange Sits Inside the Metro Ranked Worst in the Nation for Ozone
The figure: 159.2 unhealthy ozone days a year for Los Angeles–Long Beach, first in 26 of the report’s 27 years.
The fine print: ALA ranks a metro by its single worst county, and that number comes from inland San Bernardino, not Orange. Coastal Orange County runs cleaner.
Why it matters: the regional ozone problem is real, but metro headlines overstate what Orange breathes on an average day.
Source: American Lung Association, “State of the Air” 2026, California findings
2. More Than 45 Million Americans Live Within 300 Feet of a Major Road
Linked effects: asthma onset, cardiovascular disease, impaired lung development in kids.
Orange’s roads: I-5, SR-22, SR-57 inside city limits, plus SR-55 on the eastern flank.
Why it matters: why a near-road monitor operates here.
Source: U.S. EPA, Research on Near Roadway and Other Near Source Air Pollution
3. In High-Ozone Communities, Kids Playing Three or More Team Sports Developed Asthma at 3.3 Times the Rate
Who: 3,535 Southern California children, no asthma history, 12 communities, five years.
Control: sports carried no added risk in low-ozone communities.
Caveat: 1990s ozone ran higher than today’s, so treat the ratio as directional.
Why it matters: the clearest evidence for moving hard play off hot afternoons.
Sources: California Air Resources Board, The Children’s Health Study · McConnell et al., The Lancet, 2002 (PubMed)
Frequently Asked Questions
Glossary
AQI (Air Quality Index): the EPA’s 0-to-500 scale turning pollutant levels into one number, reporting only the worst one. See our AQI scale explainer.
PM2.5: fine particles under 2.5 microns, small enough to reach deep lung tissue, and the pollutant a filter captures. See PM10 vs. PM2.5.
Ground-level ozone: a gas formed when sunlight reacts with vehicle emissions. Orange’s summer pollutant, and one filters don’t catch.
Source Receptor Area 17: South Coast AQMD’s Central Orange County forecast area, which contains Orange.
Santa Ana winds: dry offshore winds flowing down Southern California canyons toward the coast, September through February.
MERV: the 1-to-16 scale for how well a filter captures particles.