
Ontario Real-Time AQI Tracker


Get Alerts For Unhealthy AQI In Your Area
When air quality in your area reaches unhealthy levels, we'll send you a quick alert, along with expert tips on how to reduce your exposure.
What's Actually In Ontario Air Today?
What High AQI Means for Your Lungs in Ontario
How to Read AQI
The Air Quality Index (AQI) measures how polluted the air is and how it may affect your health.
0–50 (Good): Air quality is satisfactory.
51–100 (Moderate): Acceptable, but some pollutants may pose minor concerns.
101–150 (Unhealthy for Sensitive Groups)
151–200 (Unhealthy)
201–300 (Very Unhealthy)
301+ (Hazardous)
Moderate
Still okay for most, but if you have asthma or allergies, take it easy and avoid long outdoor workouts.
Shop MERV 11 filters→What's the Right Filter for Your AQI Level?






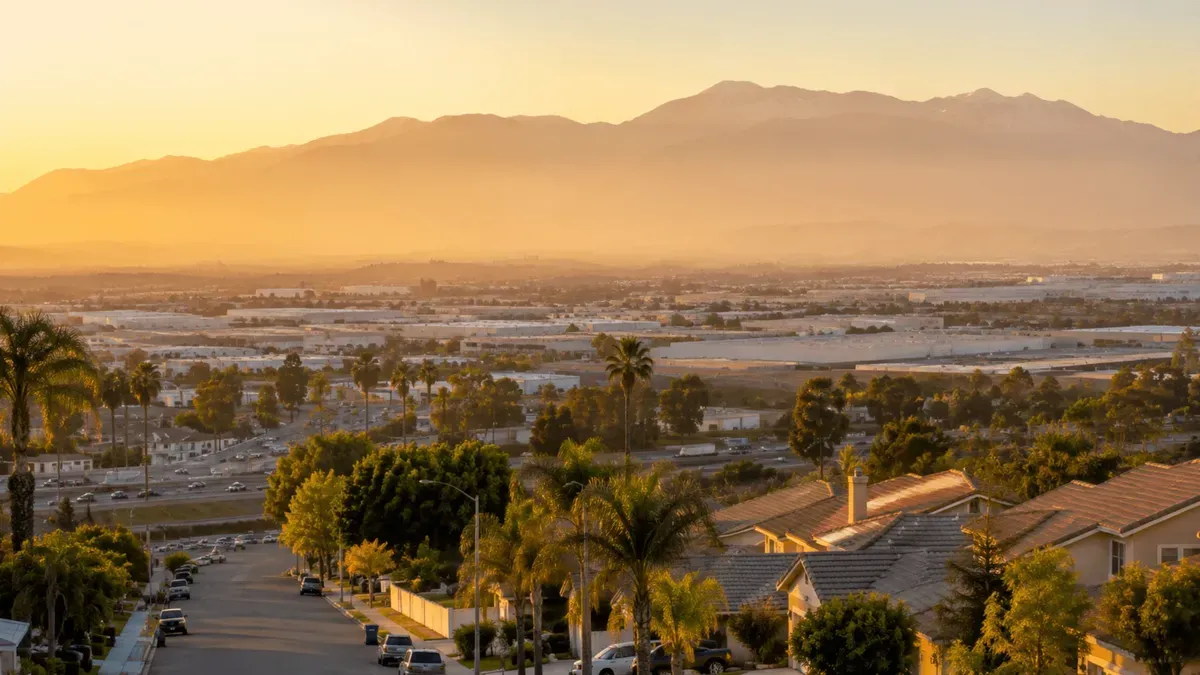
Check Today's Live Real Time Air Quality Index AQI Map in Ontario, CA Now
By Michelle Wan, Brand Manager and Air Quality Writer at Filterbuy · Reviewed by David Clark, Licensed HVAC Technician, Filterbuy HVAC Solutions · Published and updated August 4, 2026
TL;DR
Ontario, California sits in one of the most ozone-polluted air basins in the United States. (This is the San Bernardino County city in the Inland Empire, not Ontario, Canada.) Use the live AQI map below for real-time conditions. Ontario’s readings are driven by ozone on hot afternoons and traffic particles near its freight corridors, so the number often changes sharply between morning and evening.
Key Takeaways
Ontario is in San Bernardino County, ranked worst in the nation for ozone in the American Lung Association’s State of the Air 2026, with a weighted average of 159.2 unhealthy ozone days.
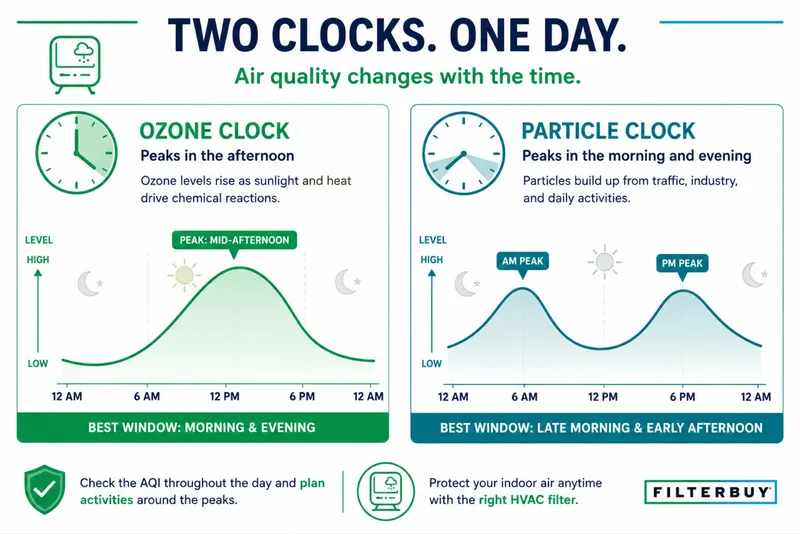
Ontario’s AQI runs on two clocks. Ozone peaks late morning to early evening, May through October. Freight particles track truck hours and cool, still weather.
The Ontario CA-60 Near Road monitor recorded the basin’s highest annual PM2.5 in 2022, at 13.7 micrograms per cubic meter, per South Coast AQMD.
More than 600 warehouses sit inside Ontario’s roughly 50 square miles, generating an estimated 96,000 truck trips a day (Warehouse CITY).
A MERV-rated filter captures particles but does not remove ozone gas. On high-ozone afternoons, closing up and running recirculate matters more than a filter upgrade.
What Is the Air Quality in Ontario, CA Today?
Ontario’s current AQI appears on the live map above, drawn from EPA AirNow and South Coast AQMD. The scale runs 0 to 500, lower is better, and 101 or higher means sensitive groups should limit outdoor exertion: children, older adults, and anyone with asthma or a heart condition.
One quirk: Ontario’s AQI is a maximum, not an average. It shows whichever pollutant is worst right then, usually ozone or PM2.5, and which one it is changes the right response.
Ontario’s Air Quality Runs on Two Clocks
Ontario’s unhealthy air comes from two pollutants on two schedules, and a single map reading hides whichever is spiking.
Ontario sits downwind of Los Angeles. The daytime sea breeze carries coastal emissions inland, where nitrogen oxides and volatile organic compounds cook into ground-level ozone under strong sunlight. That is why inland cities record higher ozone than the coastal cities producing much of the pollution.
Separately, heavy freight traffic along Interstate 10, Interstate 15, State Route 60 and Ontario International Airport produces fine particles and nitrogen dioxide, which follow truck and commute hours rather than sunlight.
Table 1: Ontario’s Two Pollution Clocks
Ozone forms when sunlight reacts with pollution transported inland from the Los Angeles basin. Sources: U.S. EPA AirNow; South Coast AQMD.
Line the two clocks up and they hand off to each other. Ozone runs May through October. Records from South Coast AQMD put basin PM2.5 exceedances almost entirely between November and February. Ontario does not get a clean season. It gets two different ones.
Practical read: a climb on a hot, clear afternoon is ozone. A climb on a cool, still morning or evening, or near the 60 or the 15, is particles.
Why Ontario’s Readings Run High
Ontario stacks a regional ozone problem on top of the region’s heaviest freight corridor.
The EPA Green Book classifies San Bernardino County’s portion of the Los Angeles-South Coast Air Basin as Extreme nonattainment for the 2015 8-hour ozone standard, the highest classification the Clean Air Act defines, and CARB’s analysis gives the basin until 2037 to comply. The American Lung Association ranked the county worst in the nation for ozone, with 159.2 weighted unhealthy ozone days and failing grades on all three measures.
Ontario also holds more warehouse space than any other city in the region. The Warehouse CITY tool from Pitzer College’s Redford Conservancy and Radical Research LLC, documented in Environment and Planning B, counts more than 600 warehouses across roughly 50 square miles, about 16% of the city’s land, generating an estimated 96,000 truck trips a day. CARB attributes roughly 70 percent of California’s known airborne cancer risk to diesel exhaust.
That shows up in the data: the Ontario CA-60 Near Road station recorded an annual PM2.5 design value of 13.7 micrograms per cubic meter for 2022, the highest of any station in the basin, per South Coast AQMD. The county’s ozone day count did fall from 177 in the prior period, so the trend is improving.
The Map Shows the City. You Live on a Block.
A single AQI reading covers roughly 50 square miles, and exposure near Ontario’s freight corridors runs well above it.
CARB recommends siting homes, schools, daycares and playgrounds at least 500 feet from a freeway or an urban road carrying 100,000 vehicles a day. Its Air Quality and Land Use Handbook adds a threshold that matters more in Ontario than almost anywhere: avoid siting sensitive land uses within 1,000 feet of a distribution center handling 100 or more trucks per day.
In a city with more than 600 warehouses, that is a yardstick you can hold up to your own address. If your home or your child’s school falls inside those distances, your particle exposure runs higher than the map suggests, even at Moderate. Ozone is regional and does not care which block you are on.
Inside those buffers, treat the particle clock as the default. Run the fan more, inspect the filter more often, and watch the morning and evening hours rather than only the afternoon.
Wildfire Smoke Is the Third Input
Smoke follows neither clock. A wildfire event can push Ontario’s AQI past anything local ozone or traffic produce, at any hour, in any month, from a fire nowhere near the county.
Smoke behaves like the particle clock, only more so. Close the house, run recirculation, keep the fan on continuously, and use the highest-efficiency filter your system supports, per EPA guidance. Filters load in weeks rather than months during an event, so keep a spare on hand before fire season. Filterbuy stocks MERV 13 in more than 600 sizes, and auto-delivery puts that spare in your closet early.
How to Read the AQI Map for Ontario
Match the number to the action, then check twice daily.
Table 2: AQI Scale, Read for Ontario
Air Quality Index categories follow the U.S. EPA scale. Check the live map again in the afternoon during ozone season, May through October.
During ozone season the morning and afternoon readings often land in different categories, and the afternoon one governs evening plans. Readings above 301 are rare but serious. Cross-check anything unusual against the EPA AirNow map.
What Actually Helps Indoors
Filtration is the right lever on particle days and the wrong one on ozone days. Knowing which day you are having is the whole skill.
Filterbuy has manufactured pleated air filters in the United States for over a decade, in more than 600 sizes, from plants in Alabama, Florida, Pennsylvania and Utah. That lens cuts both ways.
We make particle filters for a living, so the easy thing would be to tell Ontario homeowners a filter upgrade fixes their air. It does not. Much of Ontario’s bad air is ozone, and ozone walks straight through the best pleated filter we build. The skill is not picking a MERV number. It is knowing which problem you have this afternoon.
Michelle Wan, Brand Manager and Air Quality Writer, Filterbuy
On high-ozone days, filtration is not the main lever. Ozone is a gas and MERV filters capture particles, so they will not remove it. Keep windows closed through the afternoon peak and run your HVAC on recirculate. Activated carbon media is the option that addresses gases.
On high-particle days, filtration is exactly the lever. EPA recommends the highest-efficiency filter your system handles, fan running continuously. MERV 13 captures a large share of PM2.5 and is a reasonable default here rather than an upgrade, though older equipment can struggle with it and MERV 11 is the sensible fallback. EPA finds Americans spend about 90 percent of their time indoors, where some pollutants run 2 to 5 times outdoor levels, so expect to change filters more often here than the label suggests.
MERV 13 is right for Ontario’s particle days, but ‘the highest your system can handle’ is doing real work in that sentence. Plenty of older equipment here cannot hold normal airflow behind a one-inch MERV 13. If you have the return space, a four-inch media cabinet gets the same filtration with less resistance.
David Clark, Licensed HVAC Technician and CEO, Filterbuy HVAC Solutions
7 Essential Resources for Tracking Ontario Air Quality
The live map answers what it is right now. These seven answer everything after that, and all are government agencies, health nonprofits, or peer-reviewed research.
1. See the Regulatory Numbers Behind the Map
South Coast AQMD monitor data publishes hourly readings from the agency that operates Ontario’s stations. Use it when you want raw instrument values rather than colors a map interpolates between stations.
2. Cross-Check Today’s Reading and Tomorrow’s Forecast
The EPA interactive AirNow map carries a forecast tab and a 24-hour slider, the fastest way to check an Ontario reading against neighboring stations.
3. Know What to Do at Each Ozone Level
AirNow’s Air Quality Guide for Ozone translates every AQI band into specific outdoor-activity advice. Bookmark it for May through October.
4. Understand Why Ozone Hits Your Lungs So Hard
The EPA’s summary of ozone health effects explains what ozone does to the respiratory system and which groups face the greatest risk.
5. Get the Federal Guidance on Filtering Smoke and Particles
EPA’s Reduce Your Smoke Exposure is where the MERV 13 recommendation comes from, plus advice on running the fan continuously.
6. Check San Bernardino County’s Annual Report Card
The American Lung Association’s State of the Air report card grades county ozone and particle pollution year over year, updated each April.
7. See the Research Behind Ontario’s Warehouse Footprint
Warehouse CITY, the peer-reviewed study by Phillips and McCarthy, quantifies warehouse acreage, truck trips and diesel emissions city by city.
Supporting Statistics: The Research Behind Ontario’s Air
Three findings from federal and state agencies, each from a primary government source.
1. San Bernardino County holds the federal government’s most severe ozone classification.
The EPA Green Book lists the county’s portion of the Los Angeles-South Coast Air Basin as Extreme nonattainment for the 2015 8-hour ozone standard.
Extreme is the highest classification the Clean Air Act defines.
CARB’s attainment analysis gives the basin until 2037 to comply.
Why it matters here: this is the regulatory version of what the live map shows on a hot afternoon.
2. Diesel exhaust drives roughly 70 percent of California’s known airborne cancer risk.
The California Air Resources Board attributes about 70 percent of the state’s estimated known cancer risk from toxic air contaminants to diesel engine emissions.
Diesel particulate matter makes up roughly 8 percent of outdoor PM2.5.
Why it matters here: Ontario moves an estimated 96,000 truck trips a day.
3. Americans spend about 90 percent of their time indoors.
EPA’s Report on the Environment puts average time spent indoors at approximately 90 percent.
Indoor concentrations of some pollutants run 2 to 5 times typical outdoor levels.
Why it matters here: the outdoor AQI is half the job. Your windows and your filter are the other half.
Frequently Asked Questions
Glossary
AQI (Air Quality Index): The U.S. EPA’s 0-to-500 scale for how polluted outdoor air currently is. Higher numbers mean more pollution.
Ozone (O3): A gas formed when sunlight reacts with nitrogen oxides and VOCs. Ontario’s main driver of unhealthy air days. Not removable by particle filters.
PM2.5: Fine particles 2.5 micrometers or smaller, small enough to reach deep into the lungs. Ontario sources: diesel exhaust, road dust, wildfire smoke.
NO2: A traffic-related gas measured near roadways and a precursor to ozone formation.
MERV: Minimum Efficiency Reporting Value, the 1-to-16 scale for how effectively an HVAC filter captures airborne particles.
Design value: The statistic comparing a monitoring station against federal standards.
South Coast AQMD: The air district regulating pollution across Orange County and parts of Los Angeles, Riverside and San Bernardino counties.
Sources
EPA Green Book · EPA AirNow · EPA Smoke Exposure · EPA Report on the Environment · South Coast AQMD PM2.5 Plan · CARB · ALA State of the Air 2026 · Warehouse CITY, Environment and Planning B, 2024
Reviewed for technical accuracy by David Clark, Licensed HVAC Technician. General information, not medical advice. If you have asthma, COPD or a heart condition, follow your physician’s guidance.