May 5, 2026

By David Heacock
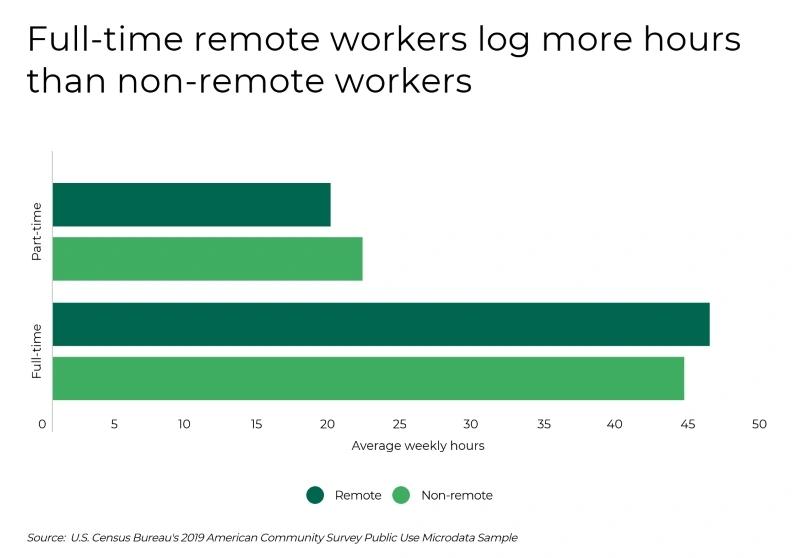
The COVID-19 pandemic has prompted a historic shift in how much people work from home. But now that a majority of eligible Americans are at least partially vaccinated, many businesses are planning how to bring workers back to the office safely and whether to continue allowing for remote work. Data collected over the past year shows that workers are just as productive—if not more—at home, and they tend to work longer hours. Interestingly, this phenomenon isn’t unique to the pandemic; Census Bureau data shows that full-time remote workers logged almost two additional hours per week, on average, than non-remote workers in 2019.
The most recent data on work hours from the Census Bureau reveals that part-time remote workers worked less, on average, than their non-remote counterparts, at 19.3 hours per week compared to 21.5 weekly hours. However, full-time remote workers worked an average of 45.6 hours per week, compared to an average 43.8 hours for non-remote full-time workers. Overall, remote workers were less likely to work full-time in 2019, as approximately two-thirds of remote workers were full-time, compared to 73% of non-remote workers.
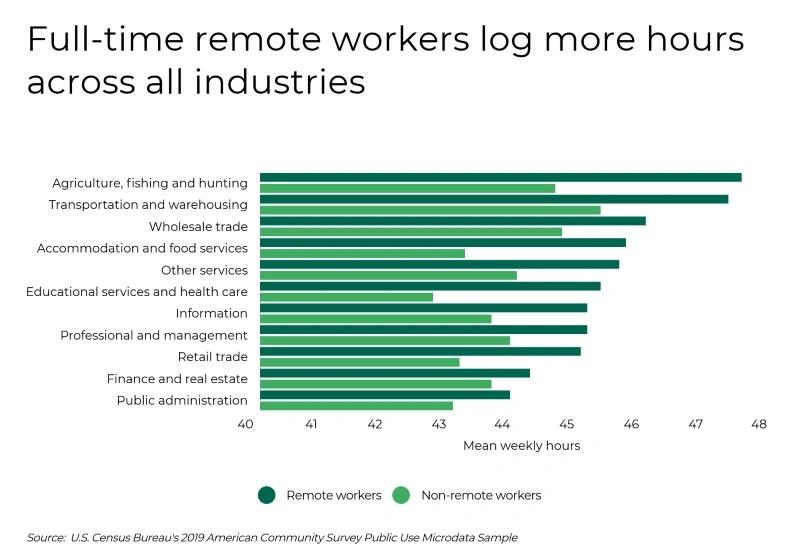
At the industry level, full-time remote workers in the agriculture sector worked the longest hours overall (47.5 hours per week)—and also reported the largest difference in average hours compared to non-remote workers—at nearly three more hours per week. On the other hand, remote workers in the finance and public administration sectors worked the fewest hours, logging just slightly more time than their non-remote counterparts on a weekly basis.
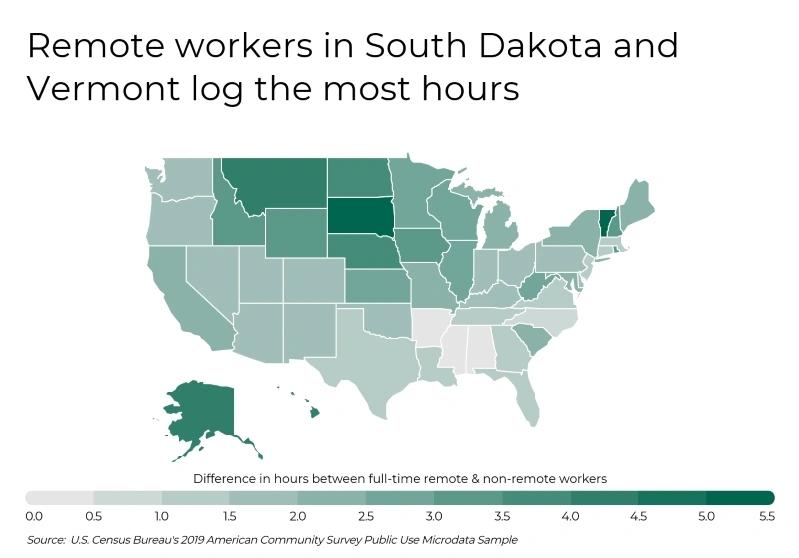
The difference in average weekly work hours for remote and non-remote workers also varied geographically, ranging from no difference to several hours. At the state level, South Dakota and Vermont had the largest difference in weekly hours between full-time remote and non-remote workers, both at 5.7 hours. In contrast, remote and non-remote workers in the South tended to work a similar amount. There was no statistically significant difference in work hours between full-time remote and non-remote workers in Arkansas, Alabama, or Mississippi.
RELATED Remote work likely means a lot more time spent at home. Be sure to replace your home air filters often. For the best protection, consider Filterbuy’s MERV 13 air filters.
To determine the metropolitan areas where remote workers logged the most hours, researchers at Filterbuy analyzed data from the U.S. Census Bureau’s 2019 American Community Survey. Metro areas were ranked according to the difference in average weekly work hours between full-time remote and non-remote workers. Researchers also calculated average weekly hours worked for full-time remote and non-remote workers, the percentage of remote workers who worked full-time, and the percentage of non-remote workers who worked full-time.
Only metropolitan areas with at least 100,000 people were included in the analysis. Additionally, metro areas were grouped into the following cohorts based on population size:
Small metros: 100,000–349,999
Midsize metros: 350,000–999,999
Large metros: 1,000,000 or more
Here are the metro areas with the biggest difference in hours between full-time remote and non-remote workers.
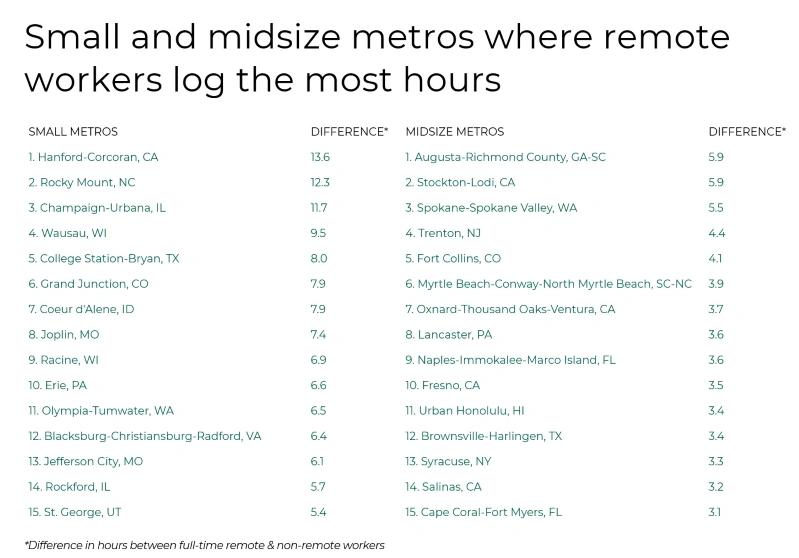

Photo Credit: Alamy Stock Photo
Difference in hours between full-time remote & non-remote workers: 1.8
Average weekly hours for full-time remote workers: 45.5
Average weekly hours for full-time non-remote workers: 43.7
Percentage of remote workers who work full-time: 71.2%
Percentage of non-remote workers who work full-time: 73.1%

Photo Credit: Alamy Stock Photo
Difference in hours between full-time remote & non-remote workers: 1.8
Average weekly hours for full-time remote workers: 45.6
Average weekly hours for full-time non-remote workers: 43.9
Percentage of remote workers who work full-time: 61.9%
Percentage of non-remote workers who work full-time: 75.1%

Photo Credit: Alamy Stock Photo
Difference in hours between full-time remote & non-remote workers: 1.9
Average weekly hours for full-time remote workers: 45.4
Average weekly hours for full-time non-remote workers: 43.5
Percentage of remote workers who work full-time: 70.3%
Percentage of non-remote workers who work full-time: 74.1%

Photo Credit: Alamy Stock Photo
Difference in hours between full-time remote & non-remote workers: 1.9
Average weekly hours for full-time remote workers: 45.4
Average weekly hours for full-time non-remote workers: 43.5
Percentage of remote workers who work full-time: 73.1%
Percentage of non-remote workers who work full-time: 73.9%

Photo Credit: Alamy Stock Photo
Difference in hours between full-time remote & non-remote workers: 1.9
Average weekly hours for full-time remote workers: 46.1
Average weekly hours for full-time non-remote workers: 44.2
Percentage of remote workers who work full-time: 69.9%
Percentage of non-remote workers who work full-time: 75.8%

Photo Credit: Alamy Stock Photo
Difference in hours between full-time remote & non-remote workers: 2.0
Average weekly hours for full-time remote workers: 44.9
Average weekly hours for full-time non-remote workers: 42.9
Percentage of remote workers who work full-time: 73.4%
Percentage of non-remote workers who work full-time: 74.7%

Photo Credit: Alamy Stock Photo
Difference in hours between full-time remote & non-remote workers: 2.1
Average weekly hours for full-time remote workers: 45.9
Average weekly hours for full-time non-remote workers: 43.8
Percentage of remote workers who work full-time: 63.0%
Percentage of non-remote workers who work full-time: 73.4%

Photo Credit: Alamy Stock Photo
Difference in hours between full-time remote & non-remote workers: 2.1
Average weekly hours for full-time remote workers: 45.9
Average weekly hours for full-time non-remote workers: 43.8
Percentage of remote workers who work full-time: 68.6%
Percentage of non-remote workers who work full-time: 73.9%

Photo Credit: Alamy Stock Photo
Difference in hours between full-time remote & non-remote workers: 2.2
Average weekly hours for full-time remote workers: 45.2
Average weekly hours for full-time non-remote workers: 43.1
Percentage of remote workers who work full-time: 62.0%
Percentage of non-remote workers who work full-time: 72.0%
Photo Credit: Alamy Stock Photo
Difference in hours between full-time remote & non-remote workers: 2.2
Average weekly hours for full-time remote workers: 45.4
Average weekly hours for full-time non-remote workers: 43.2
Percentage of remote workers who work full-time: 68.8%
Percentage of non-remote workers who work full-time: 69.1%

Photo Credit: Alamy Stock Photo
Difference in hours between full-time remote & non-remote workers: 2.4
Average weekly hours for full-time remote workers: 46.4
Average weekly hours for full-time non-remote workers: 44.1
Percentage of remote workers who work full-time: 65.6%
Percentage of non-remote workers who work full-time: 66.9%

Photo Credit: Alamy Stock Photo
Difference in hours between full-time remote & non-remote workers: 2.5
Average weekly hours for full-time remote workers: 46.5
Average weekly hours for full-time non-remote workers: 44.0
Percentage of remote workers who work full-time: 63.9%
Percentage of non-remote workers who work full-time: 74.1%

Photo Credit: Alamy Stock Photo
Difference in hours between full-time remote & non-remote workers: 2.6
Average weekly hours for full-time remote workers: 46.0
Average weekly hours for full-time non-remote workers: 43.4
Percentage of remote workers who work full-time: 69.7%
Percentage of non-remote workers who work full-time: 73.6%

Photo Credit: Alamy Stock Photo
Difference in hours between full-time remote & non-remote workers: 3.0
Average weekly hours for full-time remote workers: 46.6
Average weekly hours for full-time non-remote workers: 43.6
Percentage of remote workers who work full-time: 56.6%
Percentage of non-remote workers who work full-time: 67.6%

Photo Credit: Alamy Stock Photo
Difference in hours between full-time remote & non-remote workers: 3.2
Average weekly hours for full-time remote workers: 46.2
Average weekly hours for full-time non-remote workers: 43.0
Percentage of remote workers who work full-time: 65.6%
Percentage of non-remote workers who work full-time: 70.6%
While the metros with the biggest difference in hours between full-time remote and non-remote workers are scattered across the country, many are located in the Midwest and West. Among large metros with the largest differences in hours between full-time remote and non-remote workers, differences ranged from 1.8 to 3.2 hours. However, some small metros where remote workers tended to work extremely long hours—like Hanford-Corcoran, CA and Rocky Mount, NC—had much larger differences in hours between remote and non-remote workers, at upwards of 12 and 13 hours per week. These large differences were driven by long average work weeks for remote workers, at 55 weekly hours or more.
To determine the metropolitan areas where remote workers log the most hours, Filterbuy analyzed data from the U.S. Census Bureau’s 2019 American Community Survey Public Use Microdata Sample. Metro areas were ranked according to the difference in average weekly work hours between full-time remote and full-time non-remote workers. In the event of a tie, the metro with the higher number of average weekly work hours for remote workers was ranked higher. Researchers also calculated average weekly hours worked for full-time non-remote workers, the percentage of remote workers who worked full-time, and the percentage of non-remote workers who worked full-time.
Only metropolitan areas with at least 100,000 people were included in the analysis. Additionally, metro areas were grouped into the following cohorts based on population size:
Small metros: 100,000–349,999
Midsize metros: 350,000–999,999
Large metros: 1,000,000 or more