May 5, 2026

By David Heacock
Income inequality has been a major social, political, and economic issue since the Great Recession, and the uneven effects of the COVID-19 economy has only made the gaps between America’s haves and have-nots even starker. These divergent economic fortunes will continue to have a major effect on housing in the U.S.
During the pandemic, more affluent households were generally able to transition smoothly into working from home and had less disruption from COVID shutdowns. With higher savings rates from staying in and strong investment returns from the stock market, many of these households saw their wealth grow even amid the pandemic recession. Meanwhile, low-income workers were more likely to lose jobs or have their hours cut back, and their households depended on government relief like expanded unemployment benefits and other social safety net programs. As those programs wind down, more low-income families will struggle to make ends meet and build lasting wealth.
These trends have short- and long-term implications for the residential real estate market. Federally-funded rental assistance programs have been slow in many locations to get resources to families who need them, and the end of federal mortgage forbearance and the eviction moratorium is poised to put many economically challenged families out of their current homes. Simultaneously, better-off Americans’ improved economic fortunes have set off a rush to buy or upgrade their homes, creating one of the most competitive real estate markets in memory.
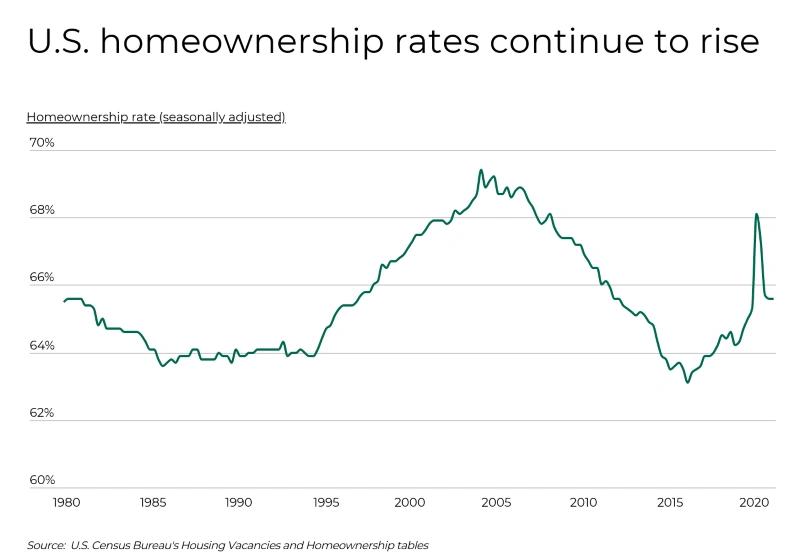
To some extent, however, interest in homeownership has been on a fairly consistent upward trajectory for several years as the post-recession economy improved. In addition to better economic conditions, one underlying driver is the aging of the millennial generation, who are currently ages 26 to 40. Many millennials graduated into the worst years of the Great Recession, saddled with more student debt than previous generations. But now, some millennials—America’s largest generational cohort—have firmer economic footing and are reaching an age where they are ready to start families and purchase homes.
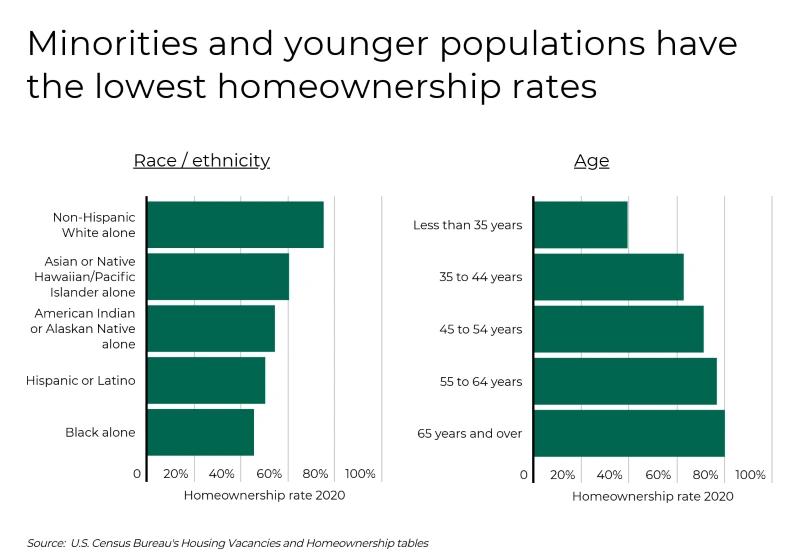
But younger Americans still have ground to make up compared to older generations. Only 39.1% of those under age 35 currently own a home, compared to 62.7% of those 35-44, the next cohort up in age. And other demographic groups have struggled to achieve the goal of homeownership as well. Non-Hispanic Whites have a homeownership rate of 75%, while racial and ethnic minorities lag behind, including Hispanic and Latino Americans with a 50.1% homeownership rate and Black Americans with a homeownership rate of just 45.1%.
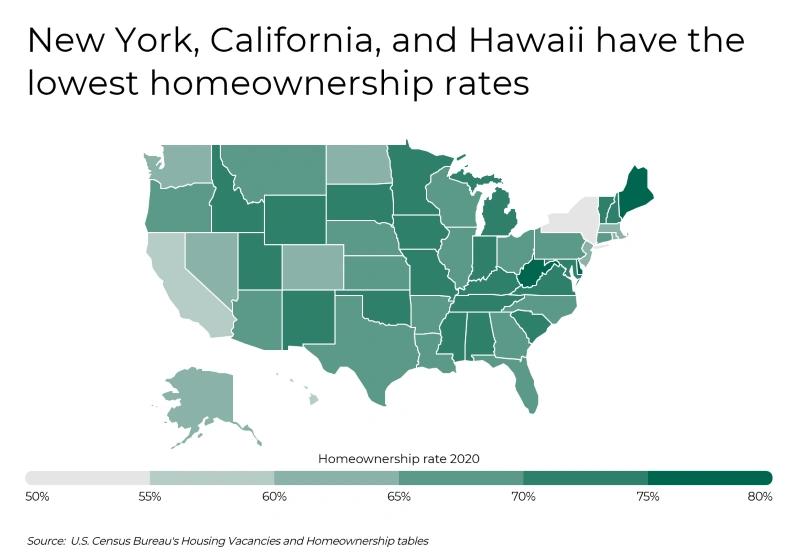
Rates of homeownership are also highly dependent on geography. Some locations have a higher cost of living—including higher home prices—that make it more difficult for would-be homeowners to afford to buy. These states include New York, California, and Hawaii, the three states with the lowest rates of homeownership. At the other end of the spectrum, states with greater rates of homeownership have more affordable real estate or a greater concentration of higher-earning, older, and less diverse residents. States with the highest homeownership rates include West Virginia, Delaware, Maine, and Alabama. Similar dynamics are at play at the metro level.
DID YOU KNOW? You can be sure that the air in your home is clean and healthy to breathe when you replace your home air filters regularly. For the best protection, consider Filterbuy’s MERV 13 air filters.
The data used in this analysis is from the U.S. Census Bureau, U.S. Bureau of Economic Analysis, and Zillow. To determine the locations with the highest homeownership rates, researchers at Filterbuy reported the average annual homeownership rate for 2020. In the event of a tie, the location with the greater number of total owner-occupied housing units was ranked higher. Only the 75 largest U.S. metropolitan areas with available data were considered in the analysis.
Here are the metros with the highest homeownership rates.

Photo Credit: f11photo / Shutterstock
Homeownership rate 2020: 70.7%
Homeownership rate 2016: 68.5%
Percentage point change in homeownership rate since 2016: +2.2
Total owner-occupied housing units: 751,471
Median home price: $345,194
Cost of living (compared to average): +5.8%

Photo Credit: doma / Shutterstock
Homeownership rate 2020: 71.1%
Homeownership rate 2016: 64.9%
Percentage point change in homeownership rate since 2016: +6.2
Total owner-occupied housing units: 624,717
Median home price: $228,977
Cost of living (compared to average): -9.4%

Photo Credit: Sean Pavone / Shutterstock
Homeownership rate 2020: 71.1%
Homeownership rate 2016: 66.4%
Percentage point change in homeownership rate since 2016: +4.7
Total owner-occupied housing units: 814,510
Median home price: $216,727
Cost of living (compared to average): -9.9%

Photo Credit: Wirestock Creators / Shutterstock
Homeownership rate 2020: 71.4%
Homeownership rate 2016: 61.0%
Percentage point change in homeownership rate since 2016: +10.4
Total owner-occupied housing units: 182,673
Median home price: $176,156
Cost of living (compared to average): -4.0%

Photo Credit: Patricia Elaine Thomas / Shutterstock
Homeownership rate 2020: 71.4%
Homeownership rate 2016: 66.0%
Percentage point change in homeownership rate since 2016: +5.4
Total owner-occupied housing units: 237,232
Median home price: $168,433
Cost of living (compared to average): -12.4%
Photo Credit: Photosbykaity / Shutterstock
Homeownership rate 2020: 71.8%
Homeownership rate 2016: 76.2%
Percentage point change in homeownership rate since 2016: -4.4
Total owner-occupied housing units: 284,876
Median home price: $267,929
Cost of living (compared to average): -8.0%

Photo Credit: Gerald Bernard / Shutterstock
Homeownership rate 2020: 71.8%
Homeownership rate 2016: 71.6%
Percentage point change in homeownership rate since 2016: +0.2
Total owner-occupied housing units: 1,235,398
Median home price: $220,309
Cost of living (compared to average): -4.7%

Photo Credit: Felix Mizioznikov / Shutterstock
Homeownership rate 2020: 72.1%
Homeownership rate 2016: 64.8%
Percentage point change in homeownership rate since 2016: +7.3
Total owner-occupied housing units: 220,223
Median home price: $206,095
Cost of living (compared to average): -9.5%

Photo Credit: Bonnie Fink / Shutterstock
Homeownership rate 2020: 72.2%
Homeownership rate 2016: 62.9%
Percentage point change in homeownership rate since 2016: +9.3
Total owner-occupied housing units: 886,963
Median home price: $295,532
Cost of living (compared to average): -1.2%

Photo Credit: AMB-MD Photography / Shutterstock
Homeownership rate 2020: 73.0%
Homeownership rate 2016: 69.1%
Percentage point change in homeownership rate since 2016: +3.9
Total owner-occupied housing units: 1,019,098
Median home price: $347,512
Cost of living (compared to average): +2.9%

Photo Credit: digidreamgrafix / Shutterstock
Homeownership rate 2020: 73.3%
Homeownership rate 2016: 66.2%
Percentage point change in homeownership rate since 2016: +7.1
Total owner-occupied housing units: 719,983
Median home price: $303,816
Cost of living (compared to average): -5.6%

Photo Credit: Sean Pavone / Shutterstock
Homeownership rate 2020: 75.5%
Homeownership rate 2016: 62.1%
Percentage point change in homeownership rate since 2016: +13.4
Total owner-occupied housing units: 229,502
Median home price: $332,240
Cost of living (compared to average): -2.9%
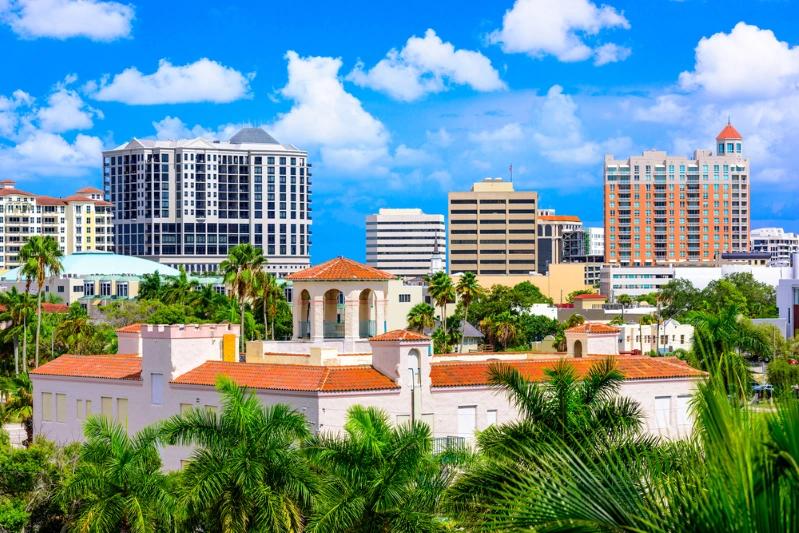
Photo Credit: Sean Pavone / Shutterstock
Homeownership rate 2020: 75.8%
Homeownership rate 2016: 73.4%
Percentage point change in homeownership rate since 2016: +2.4
Total owner-occupied housing units: 252,097
Median home price: $351,845
Cost of living (compared to average): +0.8%

Photo Credit: Sean Pavone / Shutterstock
Homeownership rate 2020: 76.0%
Homeownership rate 2016: 68.7%
Percentage point change in homeownership rate since 2016: +7.3
Total owner-occupied housing units: 325,785
Median home price: $204,114
Cost of living (compared to average): -11.7%
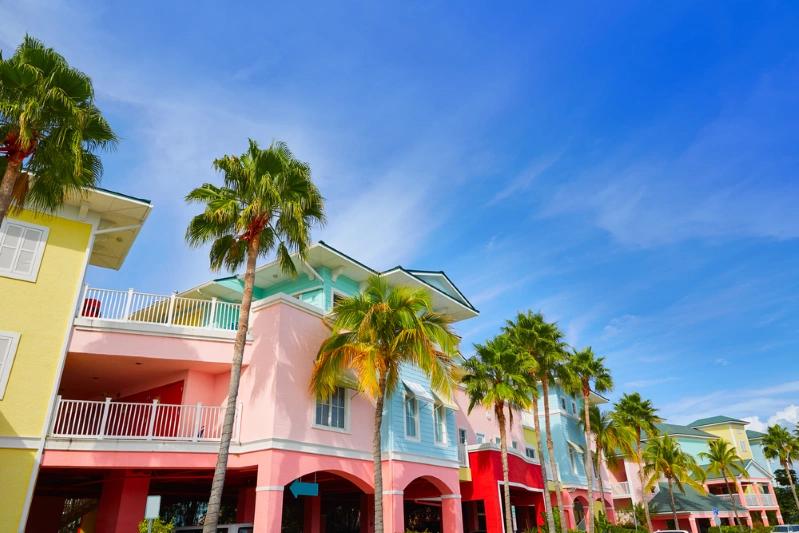
Photo Credit: lunamarina / Shutterstock
Homeownership rate 2020: 77.4%
Homeownership rate 2016: 66.5%
Percentage point change in homeownership rate since 2016: +10.9
Total owner-occupied housing units: 222,051
Median home price: $306,374
Cost of living (compared to average): -2.3%
The data used in this analysis is from the U.S. Census Bureau Housing Vacancies and Homeownership tables, the U.S. Census Bureau American Community Survey, Zillow Housing Data, and the U.S. Bureau of Economic Analysis Regional Price Parities dataset. To determine the locations with the highest homeownership rates, researchers reported the annual homeownership rate for 2020. In the event of a tie, the location with the highest number of total owner-occupied housing units was ranked higher. Only the 75 largest U.S. metropolitan areas with available data were considered in the analysis.