July 23, 2026

By David Heacock
For more than two years, delays, disruptions, and shortages in the supply chain have been a major economic consequence of the COVID-19 pandemic.
A number of factors have combined to create the widespread supply chain challenges the U.S. economy faces. The onset of the pandemic and subsequent waves temporarily shut down businesses or had them operating at limited capacity, while labor shortages in the logistics industry have frequently left goods sitting at ports and warehouses. These issues created additional challenges further downstream in the supply chain. Businesses that struggled to secure supplies, parts, or other materials faced increased difficulties meeting their own production quotas. And amid all of these struggles, demand for durable goods rose during the pandemic, further straining producers’ capacity. These factors have contributed to historically high inflation, which now threatens to send the U.S. economy into recession.
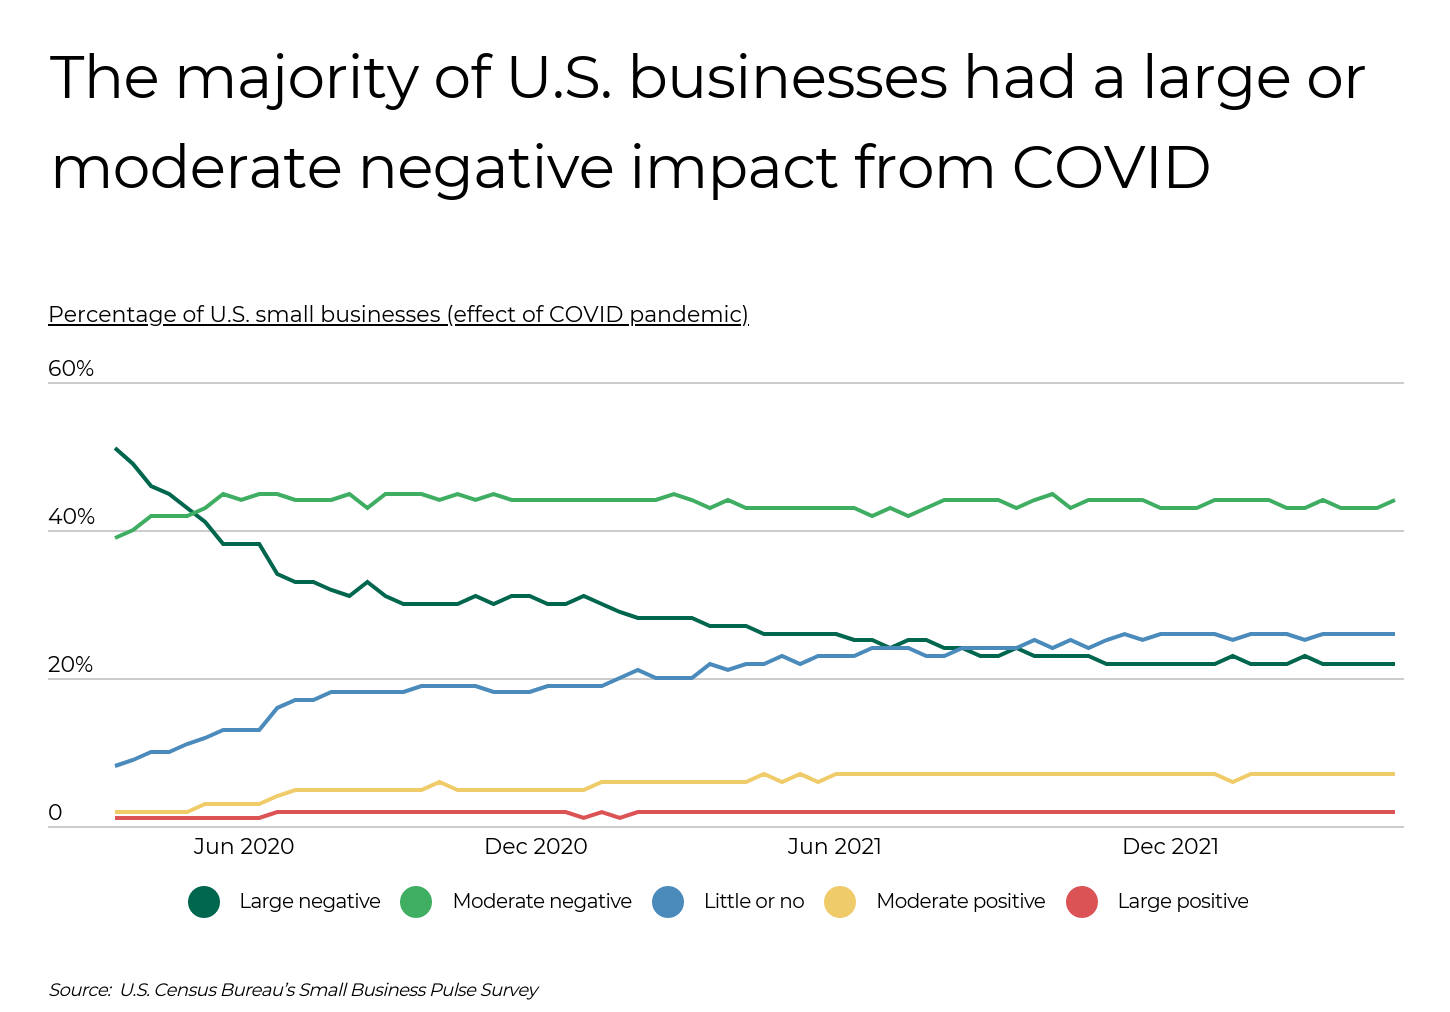
Most U.S. businesses have felt the effects of the pandemic. In April 2020, the share of businesses reporting a large or moderate negative impact from COVID was 90%, and two years later, that figure has only fallen to 66%. The share of businesses reporting a large negative impact has fallen from 51% early in the pandemic to 22% now, but the percentage reporting a moderate negative impact has held steady around 40% over time.
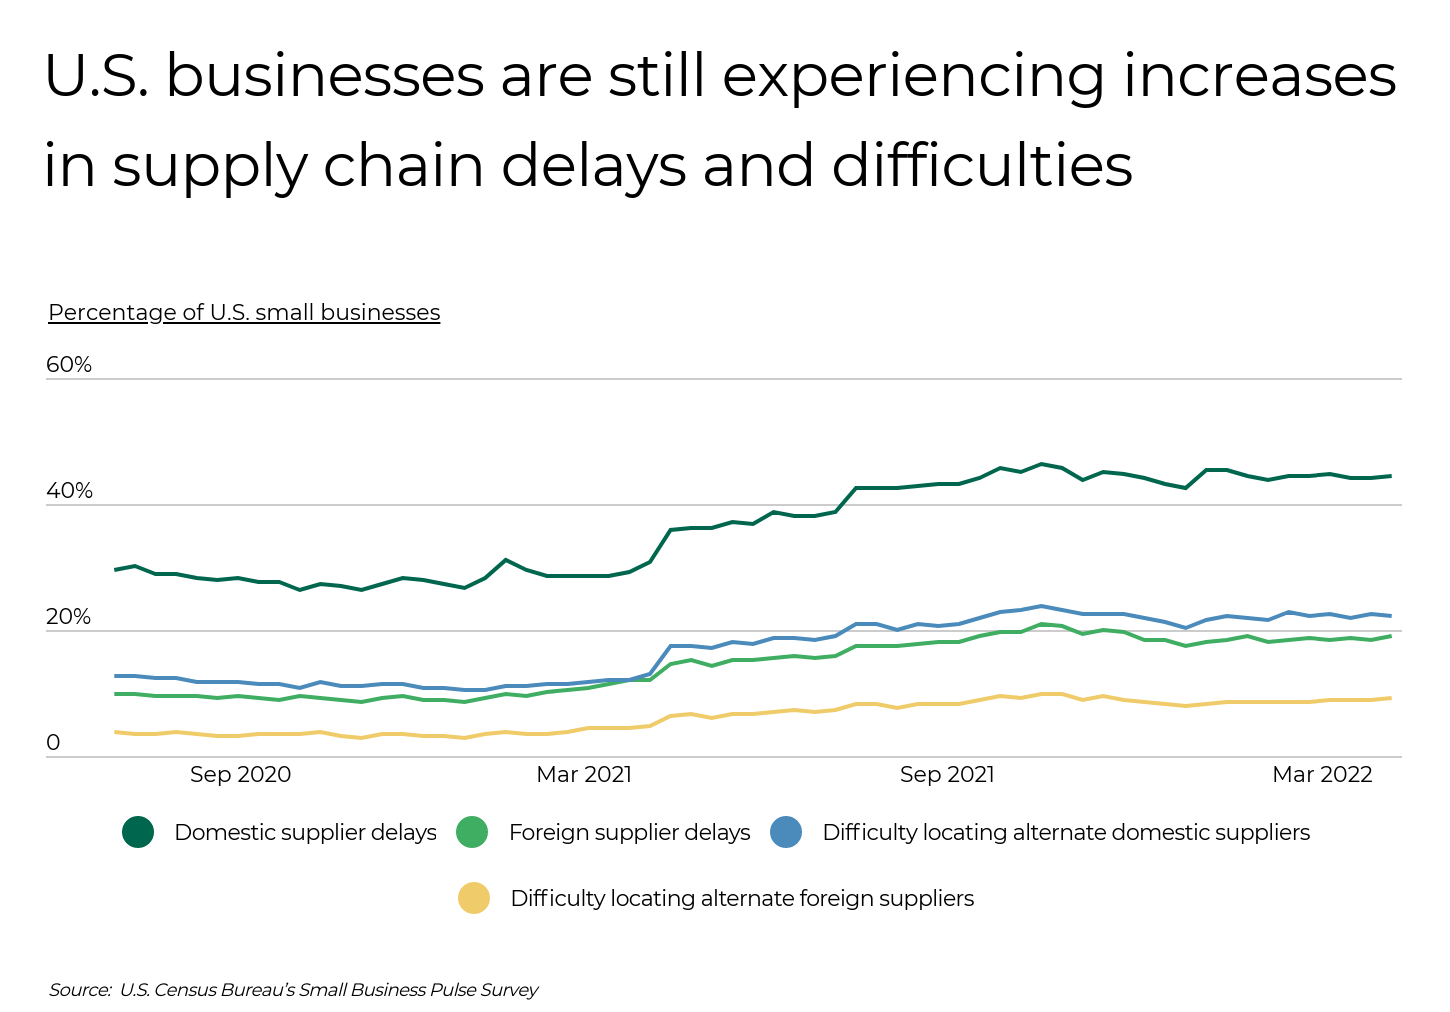
In some respects, the situation has worsened the longer the pandemic has gone on. Businesses today report delays and difficulties with both domestic and foreign suppliers at a higher percentage than they did in 2020. Delays from domestic suppliers are the primary challenge, affecting almost 45% of U.S. businesses.
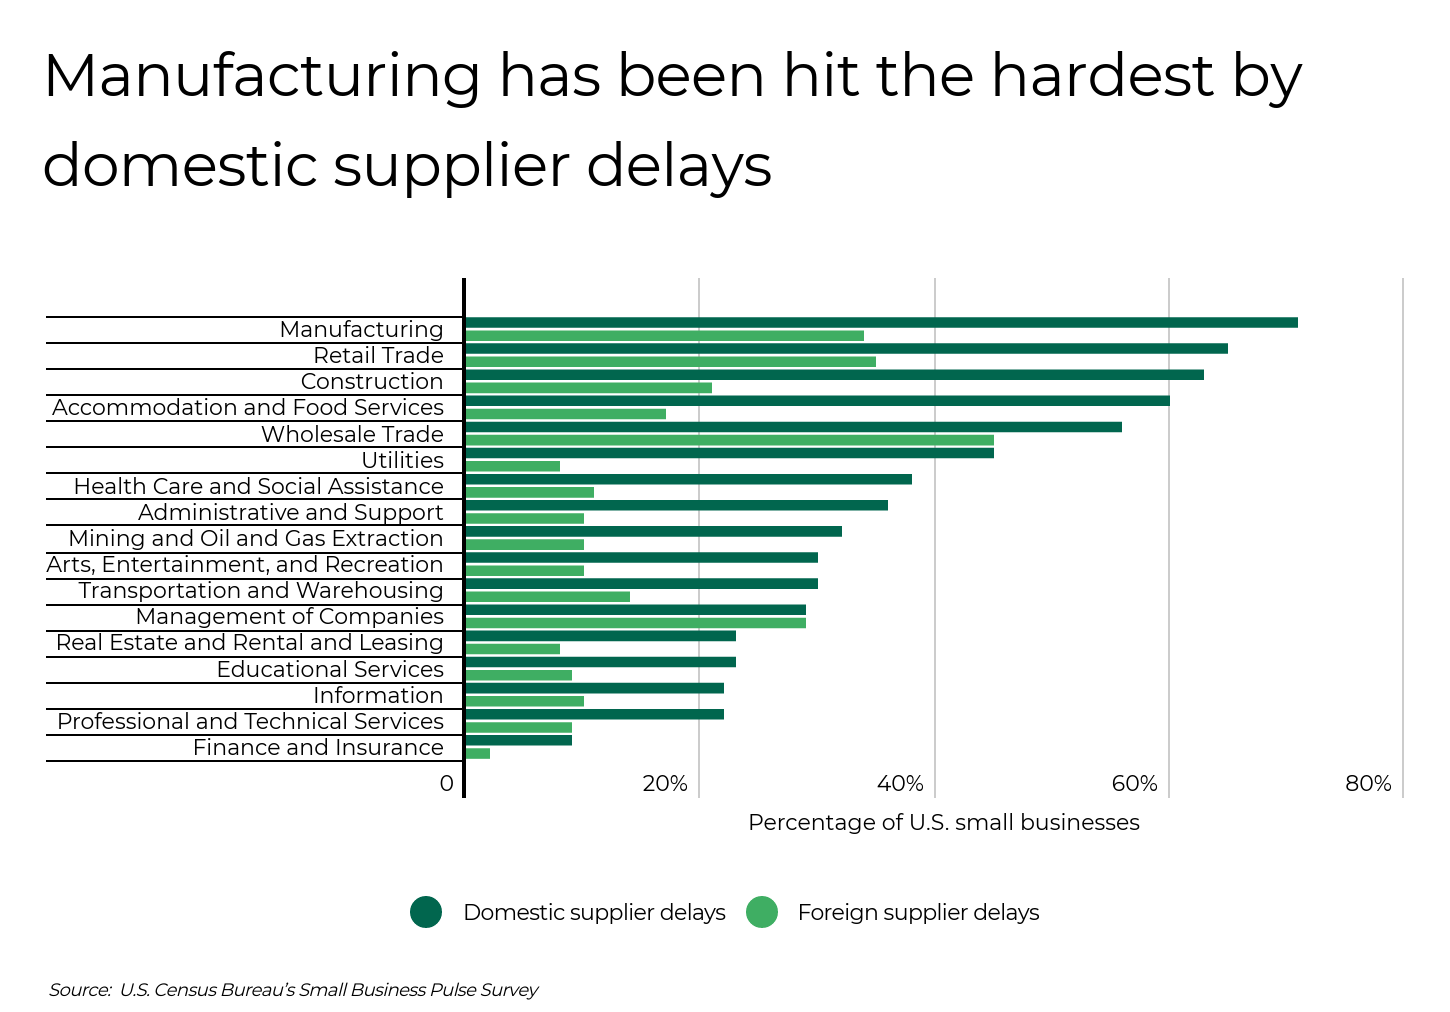
While the effects of supply chain disruptions have been widespread, some industries have suffered more than others. Manufacturing, retail trade, construction, and accommodation and food services have been hardest hit, with more than 60% of businesses in each sector reporting domestic supplier delays. The wholesale trade industry has also struggled, especially when it comes to foreign suppliers: 45% of wholesale trade businesses report delays from foreign suppliers, more than any other U.S. industry. Meanwhile, businesses that have felt less disruption include those in information- or service-based industries, which rely less on a supply of physical goods.
DID YOU KNOW? The concentration of some air pollutants can be up to 5X higher indoors than outdoors, which is why your home air filters are so important. For the best protection in your home, consider Filterbuy’s MERV 13 air filters, which trap 98% of airborne particles
With these differences between industries, states are also feeling disparate effects of supply chain disruptions. Some of the most heavily impacted U.S. states include those with strong manufacturing presences, like Wisconsin and Pennsylvania. More than half of all businesses in these two states report experiencing domestic supplier delays.
The data used in this analysis is from the U.S. Census Bureau’s Small Business Pulse Survey. To determine the states with the most supply chain disruptions, researchers at Filterbuy calculated the percentage of businesses experiencing domestic supplier delays. In the event of a tie, the state with the greater percentage of businesses experiencing delays in delivery or shipping to customers was ranked higher. Note: all calculations reflect the percentages for small businesses (less than 500 employees). All calculations, unless otherwise stated, compute the average of all weekly survey responses from January 3, 2022 through April 17, 2022 and represent the typical share of businesses experiencing the respective disruption during that period.
Here are the states with the most supply chain disruptions.
Photo Credit: RodClementPhotography / Shutterstock
Businesses experiencing domestic supplier delays: 47.5%
Businesses experiencing delays in delivery/shipping to customers: 25.9%
Businesses having difficulties locating alternative domestic suppliers: 21.7%
Businesses experiencing foreign supplier delays: 17.7%
Businesses having difficulties locating alternative foreign suppliers: 8.1%
Businesses experiencing production delays: 12.7%

Photo Credit: Jon Bilous / Shutterstock
Businesses experiencing domestic supplier delays: 47.5%
Businesses experiencing delays in delivery/shipping to customers: 27.5%
Businesses having difficulties locating alternative domestic suppliers: 24.4%
Businesses experiencing foreign supplier delays: 18.8%
Businesses having difficulties locating alternative foreign suppliers: 9.1%
Businesses experiencing production delays: 15.0%

Photo Credit: Henryk Sadura / Shutterstock
Businesses experiencing domestic supplier delays: 47.6%
Businesses experiencing delays in delivery/shipping to customers: 25.6%
Businesses having difficulties locating alternative domestic suppliers: 22.3%
Businesses experiencing foreign supplier delays: 17.6%
Businesses having difficulties locating alternative foreign suppliers: 7.9%
Businesses experiencing production delays: 13.7%
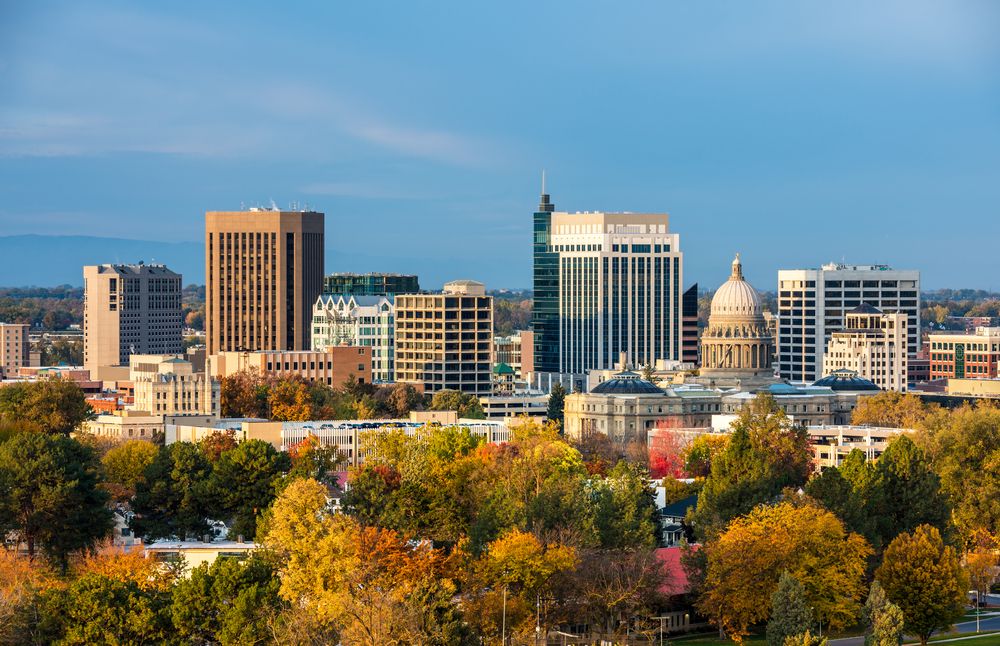
Photo Credit: Charles Knowles / Shutterstock
Businesses experiencing domestic supplier delays: 47.6%
Businesses experiencing delays in delivery/shipping to customers: 27.4%
Businesses having difficulties locating alternative domestic suppliers: 23.5%
Businesses experiencing foreign supplier delays: 18.5%
Businesses having difficulties locating alternative foreign suppliers: 10.8%
Businesses experiencing production delays: 14.8%
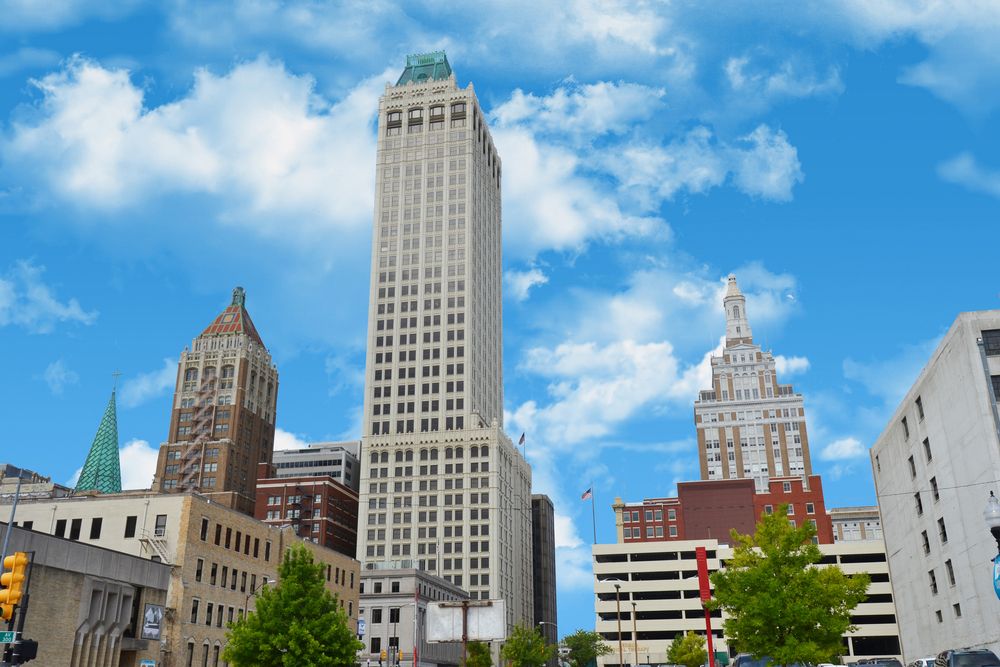
Photo Credit: Valiik30 / Shutterstock
Businesses experiencing domestic supplier delays: 47.7%
Businesses experiencing delays in delivery/shipping to customers: 24.9%
Businesses having difficulties locating alternative domestic suppliers: 24.1%
Businesses experiencing foreign supplier delays: 17.7%
Businesses having difficulties locating alternative foreign suppliers: 8.2%
Businesses experiencing production delays: 13.2%

Photo Credit: Rudy Balasko / Shutterstock
Businesses experiencing domestic supplier delays: 47.7%
Businesses experiencing delays in delivery/shipping to customers: 25.4%
Businesses having difficulties locating alternative domestic suppliers: 23.2%
Businesses experiencing foreign supplier delays: 18.4%
Businesses having difficulties locating alternative foreign suppliers: 7.7%
Businesses experiencing production delays: 15.1%
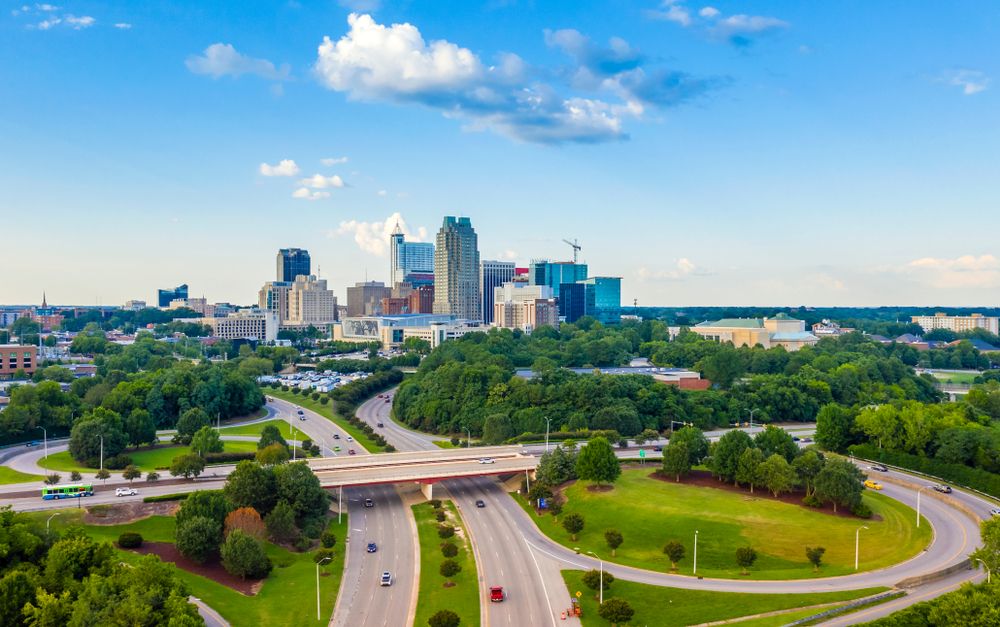
Photo Credit: Farid Sani / Shutterstock
Businesses experiencing domestic supplier delays: 47.9%
Businesses experiencing delays in delivery/shipping to customers: 26.7%
Businesses having difficulties locating alternative domestic suppliers: 24.1%
Businesses experiencing foreign supplier delays: 19.7%
Businesses having difficulties locating alternative foreign suppliers: 9.6%
Businesses experiencing production delays: 15.7%
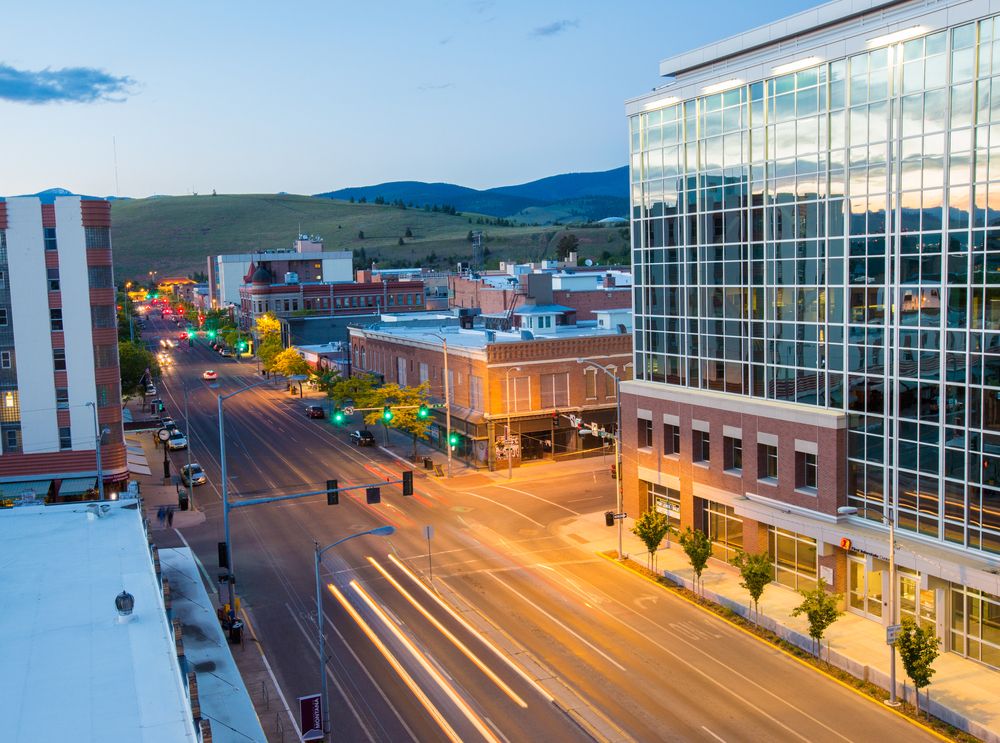
Photo Credit: Mary Vanier / Shutterstock
Businesses experiencing domestic supplier delays: 48.4%
Businesses experiencing delays in delivery/shipping to customers: 25.1%
Businesses having difficulties locating alternative domestic suppliers: 23.4%
Businesses experiencing foreign supplier delays: 19.2%
Businesses having difficulties locating alternative foreign suppliers: 11.3%
Businesses experiencing production delays: 14.2%
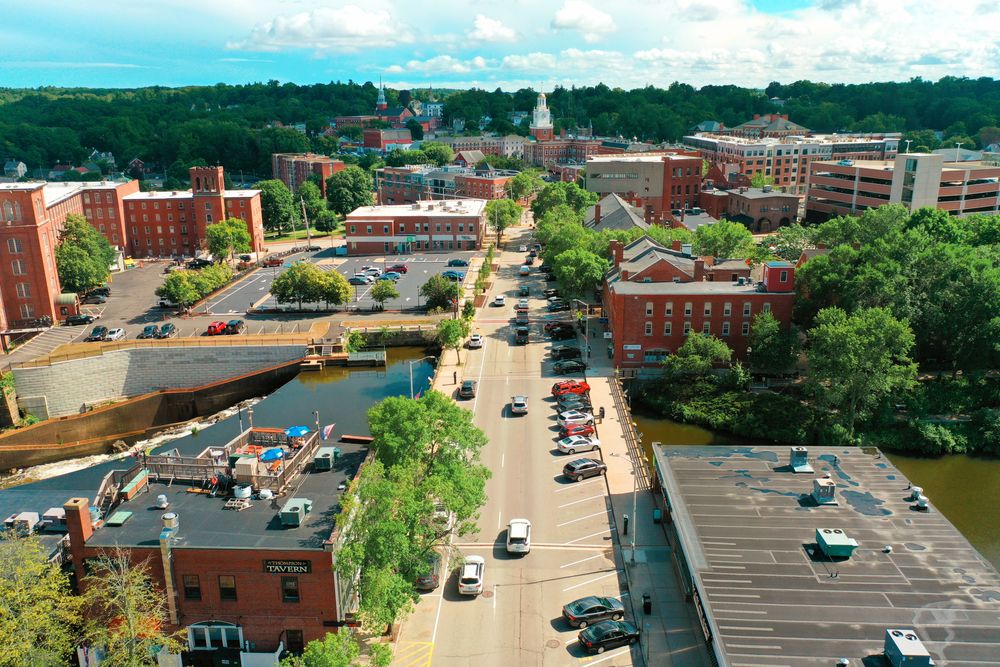
Photo Credit: Loud Canvas / Shutterstock
Businesses experiencing domestic supplier delays: 48.4%
Businesses experiencing delays in delivery/shipping to customers: 27.2%
Businesses having difficulties locating alternative domestic suppliers: 23.9%
Businesses experiencing foreign supplier delays: 17.5%
Businesses having difficulties locating alternative foreign suppliers: 9.0%
Businesses experiencing production delays: 11.8%
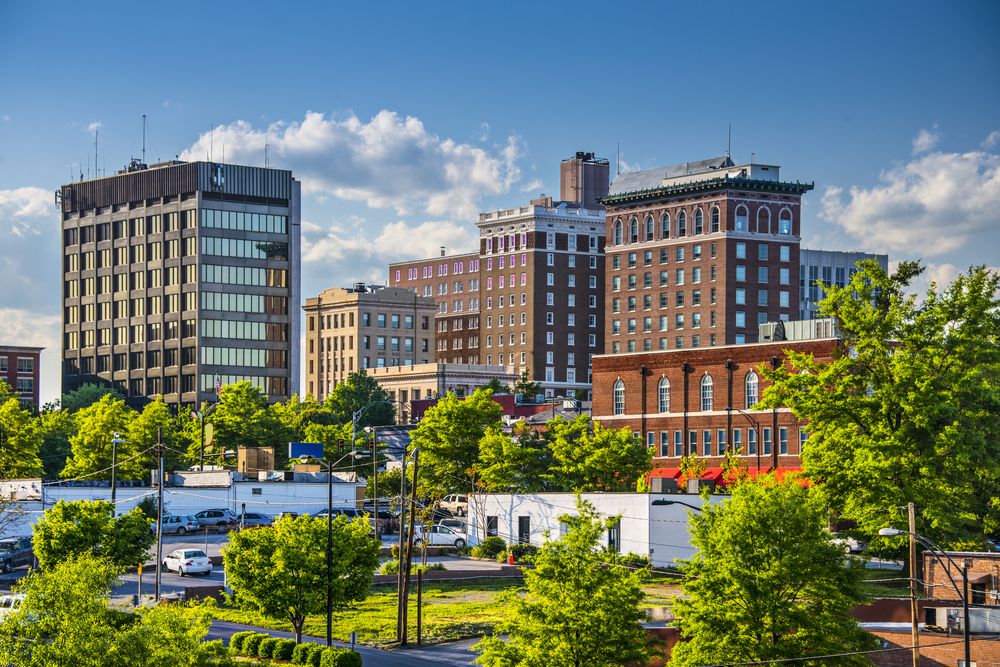
Photo Credit: Sean Pavone / Shutterstock
Businesses experiencing domestic supplier delays: 48.6%
Businesses experiencing delays in delivery/shipping to customers: 27.5%
Businesses having difficulties locating alternative domestic suppliers: 24.1%
Businesses experiencing foreign supplier delays: 19.6%
Businesses having difficulties locating alternative foreign suppliers: 9.4%
Businesses experiencing production delays: 13.3%

Photo Credit: Agnieszka Gaul / Shutterstock
Businesses experiencing domestic supplier delays: 48.8%
Businesses experiencing delays in delivery/shipping to customers: 27.8%
Businesses having difficulties locating alternative domestic suppliers: 24.3%
Businesses experiencing foreign supplier delays: 16.8%
Businesses having difficulties locating alternative foreign suppliers: 7.4%
Businesses experiencing production delays: 14.8%

Photo Credit: ESB Professional / Shutterstock
Businesses experiencing domestic supplier delays: 49.0%
Businesses experiencing delays in delivery/shipping to customers: 27.2%
Businesses having difficulties locating alternative domestic suppliers: 21.7%
Businesses experiencing foreign supplier delays: 18.6%
Businesses having difficulties locating alternative foreign suppliers: N/A
Businesses experiencing production delays: 16.2%

Photo Credit: haveseen / Shutterstock
Businesses experiencing domestic supplier delays: 49.3%
Businesses experiencing delays in delivery/shipping to customers: 24.0%
Businesses having difficulties locating alternative domestic suppliers: 23.5%
Businesses experiencing foreign supplier delays: 18.4%
Businesses having difficulties locating alternative foreign suppliers: 11.7%
Businesses experiencing production delays: 12.4%

Photo Credit: Gang Liu / Shutterstock
Businesses experiencing domestic supplier delays: 50.0%
Businesses experiencing delays in delivery/shipping to customers: 27.2%
Businesses having difficulties locating alternative domestic suppliers: 23.8%
Businesses experiencing foreign supplier delays: 19.3%
Businesses having difficulties locating alternative foreign suppliers: 9.0%
Businesses experiencing production delays: 13.6%
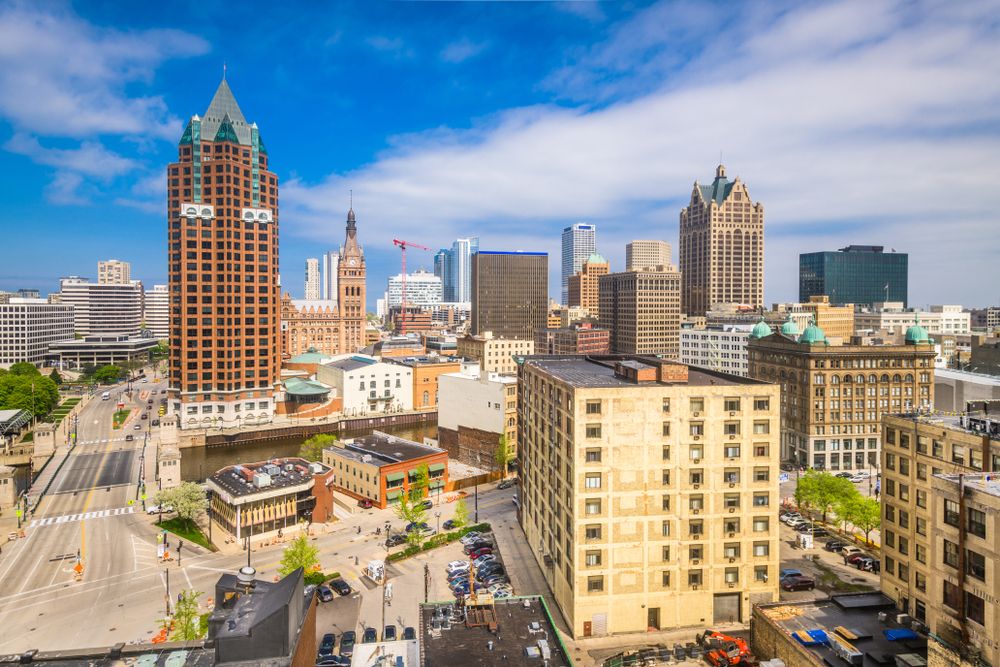
Photo Credit: Sean Pavone / Shutterstock
Businesses experiencing domestic supplier delays: 53.3%
Businesses experiencing delays in delivery/shipping to customers: 28.6%
Businesses having difficulties locating alternative domestic suppliers: 25.4%
Businesses experiencing foreign supplier delays: 19.4%
Businesses having difficulties locating alternative foreign suppliers: 8.2%
Businesses experiencing production delays: 14.4%
The data used in this analysis is from the U.S. Census Bureau’s Small Business Pulse Survey. To determine the states with the most supply chain disruptions, researchers calculated the percentage of businesses experiencing domestic supplier delays. In the event of a tie, the state with the greater percentage of businesses experiencing delays in delivery/shipping to customers was ranked higher. Note: all calculations reflect the percentages for small businesses (less than 500 employees). All calculations, unless otherwise stated, compute the average of all weekly survey responses from January 3, 2022 through April 17, 2022 and represent the typical share of businesses experiencing the respective disruption during that period.