May 5, 2026


Photo Credit: Alamy Stock Photo
By David Heacock
After more than a year of living through the pandemic, most of the signs lately suggest that the U.S. has turned the corner in the fight against COVID-19.
Average daily case numbers nationwide have fallen by around 80% from their peak in the U.S., from more than 250,000 per day in early January to just under 50,000 per day in early May. After a bumpy initial rollout, vaccines are now available to all adults nationwide, and the U.S. averaged more than 2 million doses administered per day during March and April. While COVID-19 still presents risks—more contagious variants continue to spread in some parts of the U.S. and vaccine hesitancy has begun to slow down the number of doses administered—a return to normalcy for many Americans now seems closer than it has at any point since the pandemic began.
More states and local governments are responding to these encouraging developments by loosening or entirely lifting restrictions that have been kept in place to minimize the spread of COVID-19 during the pandemic. Meanwhile, individuals are increasingly resuming their normal lives, comforted by the protection of the vaccines and the diminished spread of the virus.
This is all good news for the economy. Survey results from the Bureau of Labor Statistics show that more than half of U.S. businesses experienced reduced consumer demand as a result of the pandemic, leading to job losses and lost income. But as the COVID situation improves and restrictions are rolled back, policymakers and business owners are optimistic that economic activity will return to pre-pandemic levels this summer.
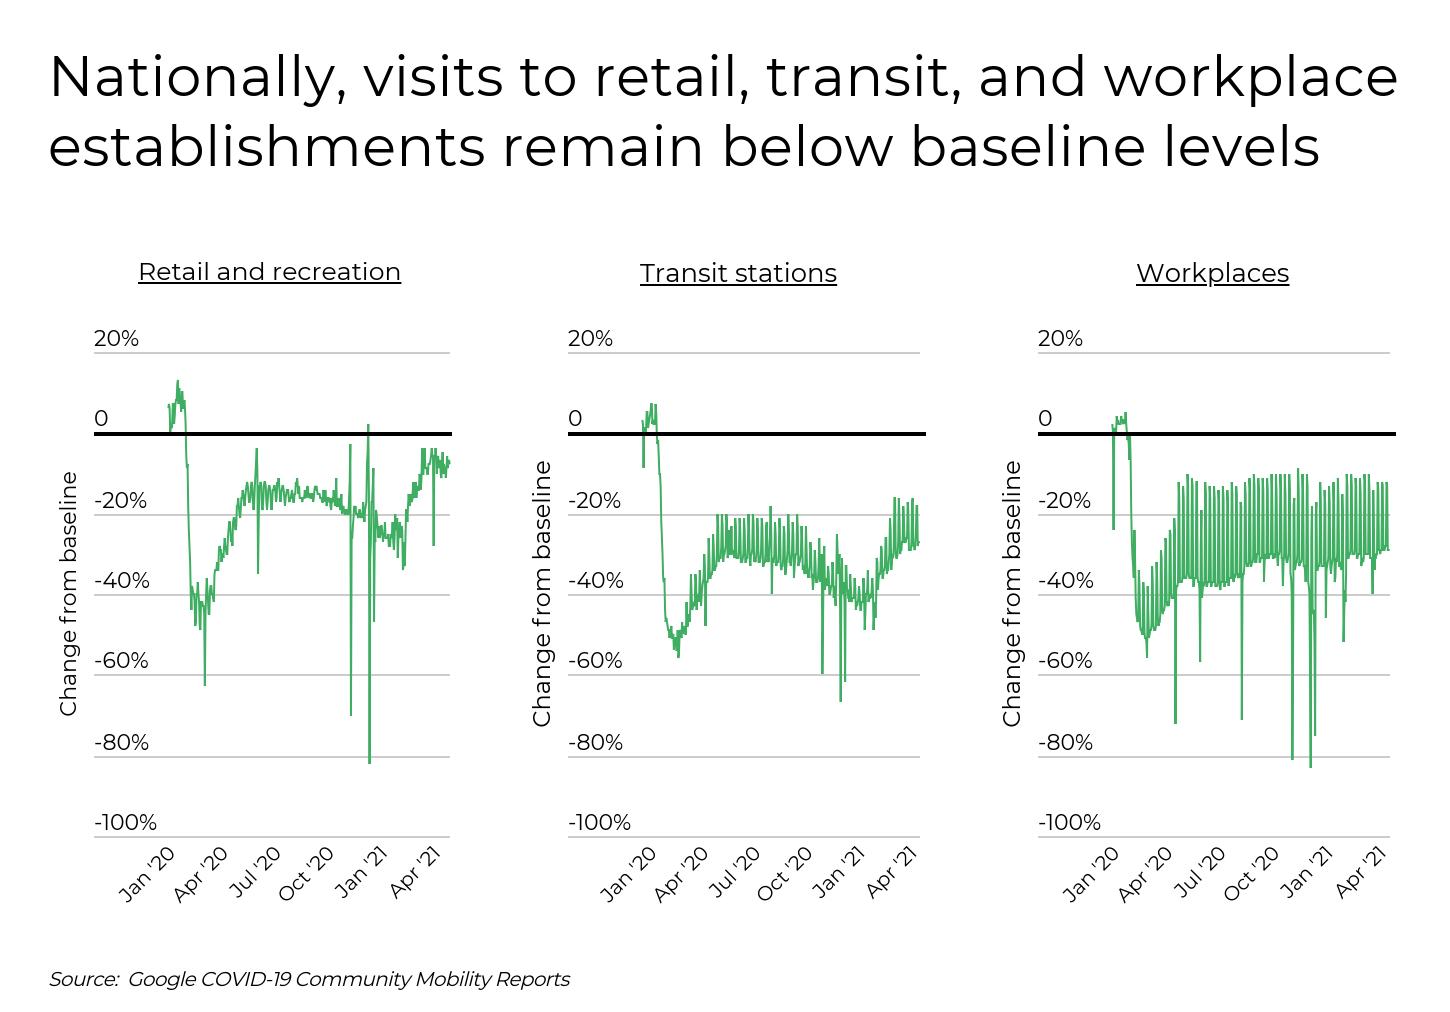
According to community mobility data that Google has collected during the pandemic, visits to retail and recreation establishments, transit stations, and workplaces (strong indicators of overall business activity) are still below their baseline levels from early 2020 but are moving in the right direction. Retail and recreation establishments are showing particularly positive trends, nearly returning to their baseline levels this spring with the drop in COVID cases and increase in vaccinations. Visits to transit stations and workplaces are down by around a quarter on average, a product of many workers continuing to work from home and forgoing business travel, but both categories have seen incremental increases since the start of 2021.
In addition to differences by type of establishment, reopening trends also vary significantly from state to state according to the Google data. One of the major reasons why states have reopened at different rates is that public attitudes toward COVID-19 became highly politicized throughout the contentious 2020 election cycle and beyond. This has affected both individuals’ behaviors and governments’ approach to public health restrictions: in general, more politically conservative areas have moved more quickly toward reopening and their politically liberal counterparts have shown more caution. Many of these more conservative states are also more rural and less densely populated, factors which also lower some of the perceived risks associated with COVID-19.
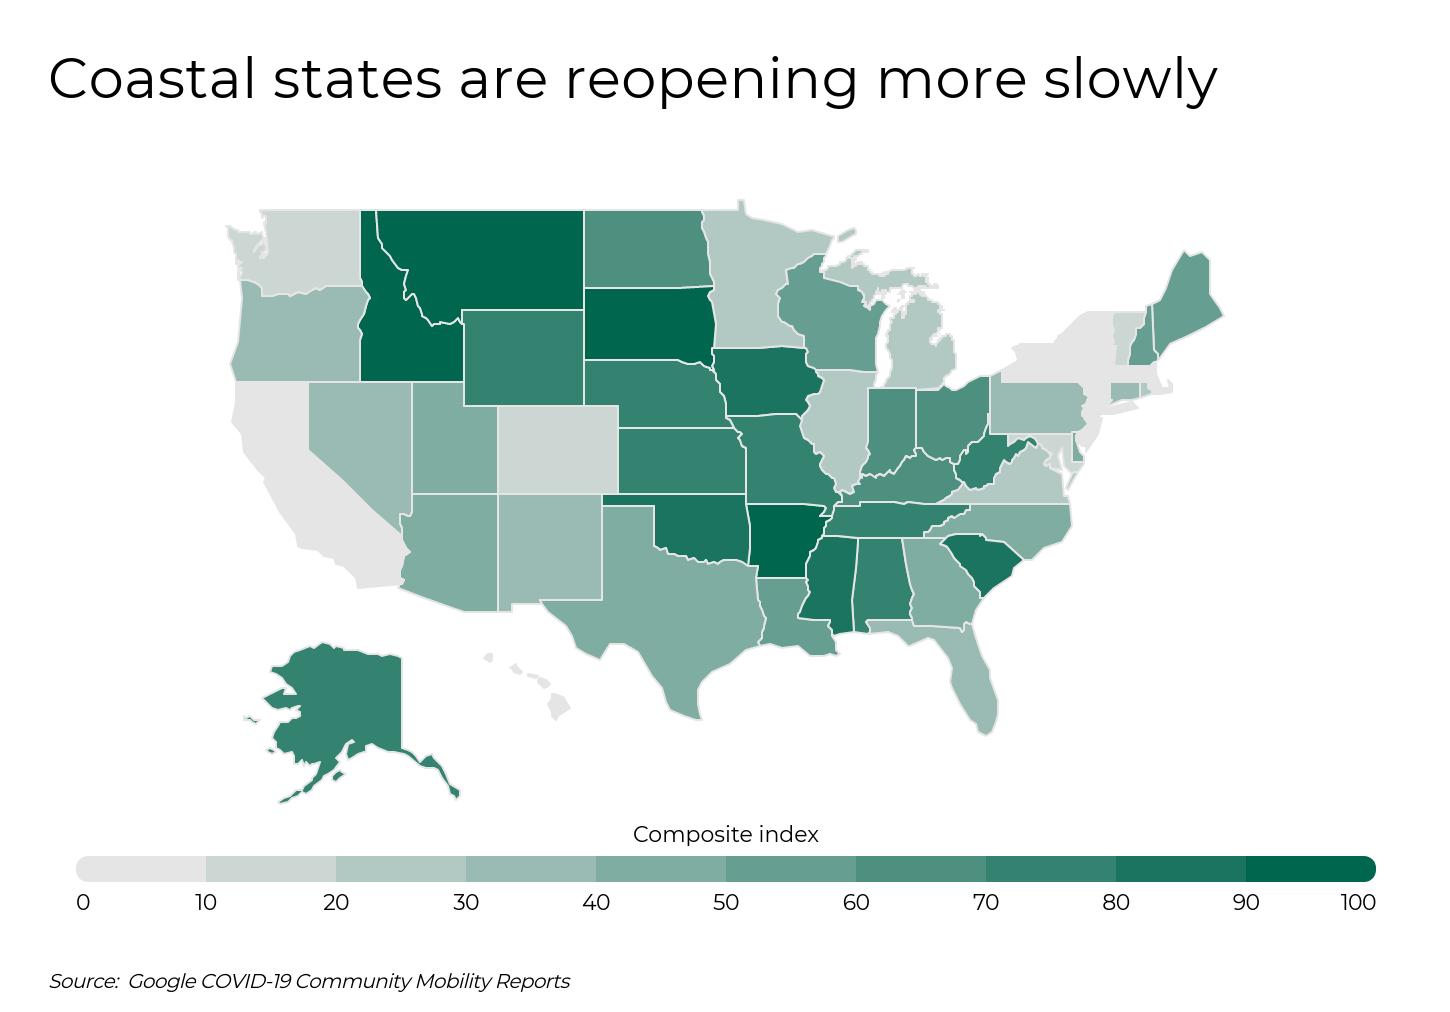
To identify the states that have reopened most quickly, Filterbuy researchers used data from Google’s COVID-19 Community Mobility Reports to create a composite index based on April 2021 visits to retail and recreation, transit, and workplace establishments. Filterbuy’s research team calculated the percentage change in visits to such establishments compared to a pre-pandemic baseline period of January 3 to February 6, 2020.
Here are the states that have started opening up for business.
Photo Credit: Alamy Stock Photo
Composite index: 75.47
Retail & recreation change from baseline: -4.6%
Transit stations change from baseline: 12.6%
Workplaces change from baseline: -16.7%
TRENDING Protect the people at your place of business with Filterbuy’s MERV 13 air filters—designed to trap 98% of airborne particles—including those that carry viruses.
Photo Credit: Alamy Stock Photo
Composite index: 76.83
Retail & recreation change from baseline: 1.2%
Transit stations change from baseline: 7.6%
Workplaces change from baseline: -18.2%
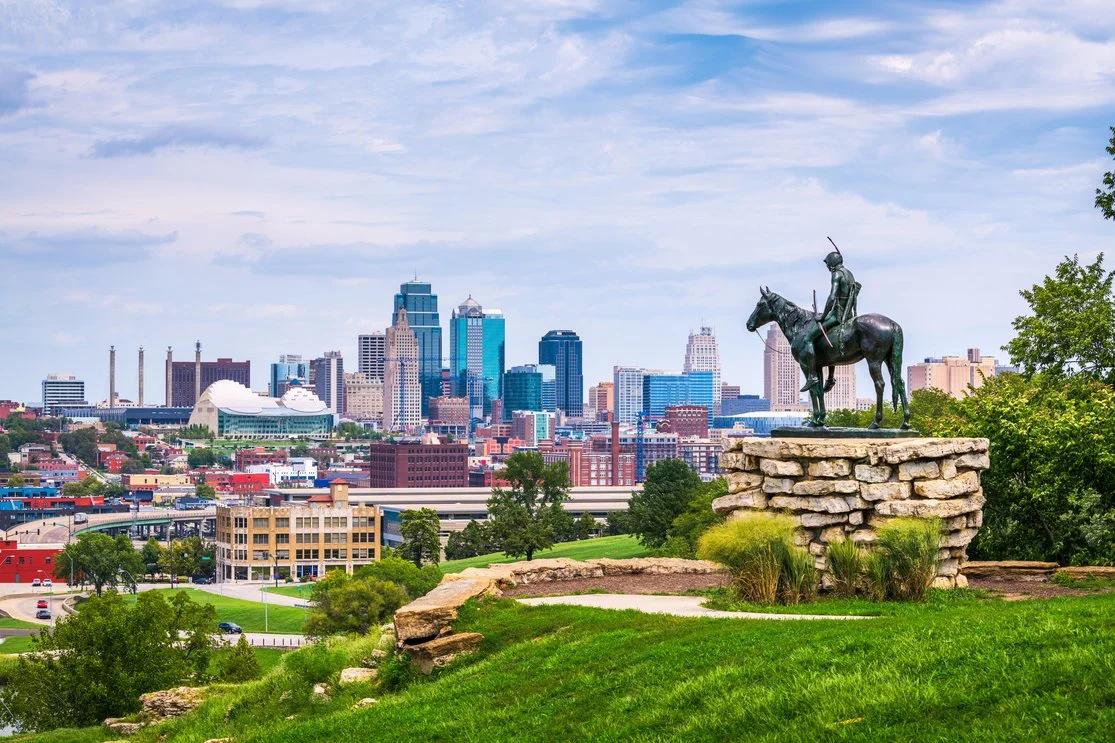
Photo Credit: Alamy Stock Photo
Composite index: 76.83
Retail & recreation change from baseline: 3.1%
Transit stations change from baseline: 0.9%
Workplaces change from baseline: -18.8%
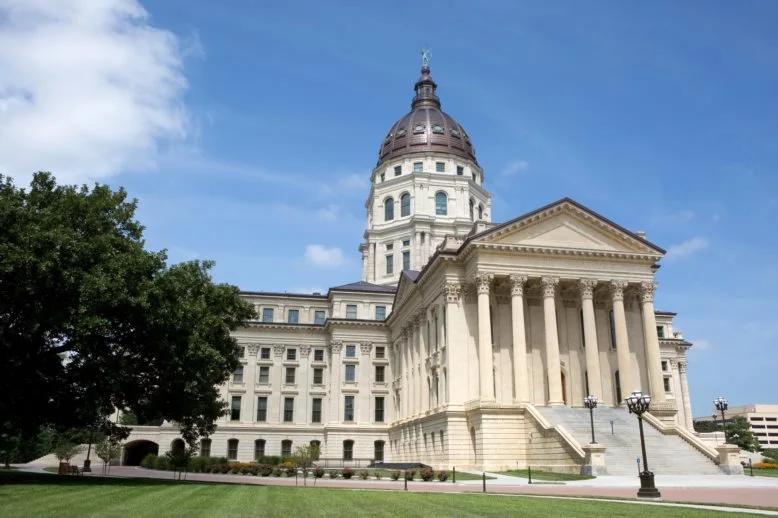
Photo Credit: Alamy Stock Photo
Composite index: 77.50
Retail & recreation change from baseline: -1.0%
Transit stations change from baseline: 9.7%
Workplaces change from baseline: -17.7%
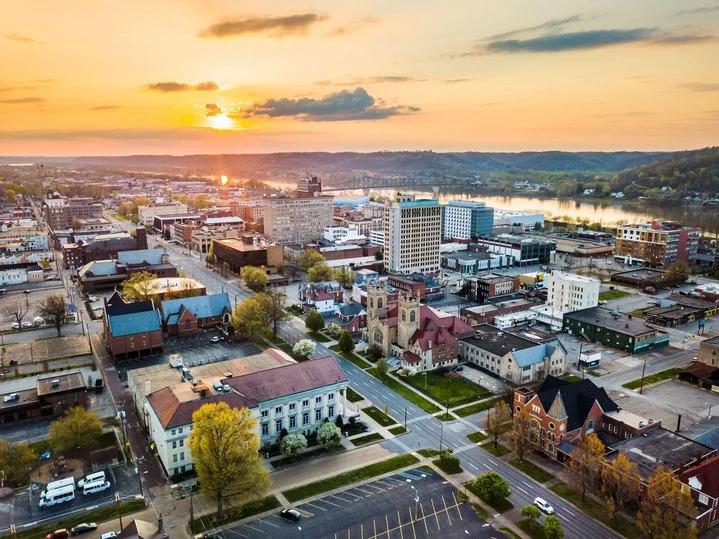
Photo Credit: Alamy Stock Photo
Composite index: 77.50
Retail & recreation change from baseline: 1.7%
Transit stations change from baseline: 6.1%
Workplaces change from baseline: -18.1%
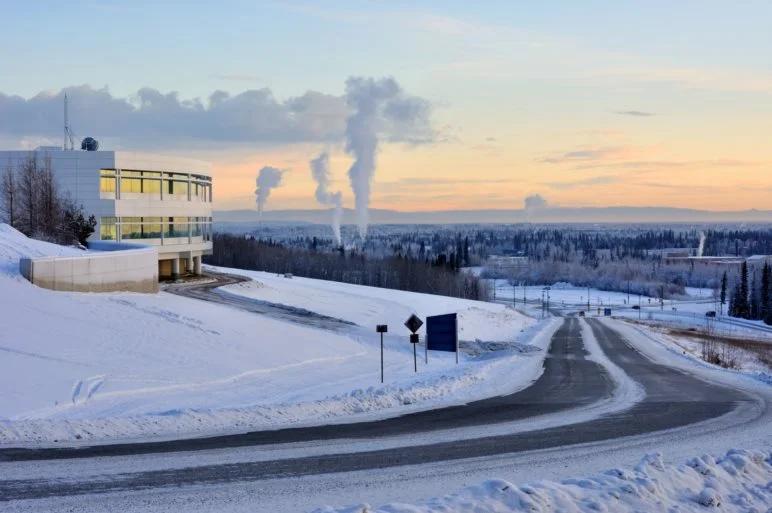
Photo Credit: Alamy Stock Photo
Composite index: 77.50
Retail & recreation change from baseline: 2.8%
Transit stations change from baseline: -8.5%
Workplaces change from baseline: -16.7%
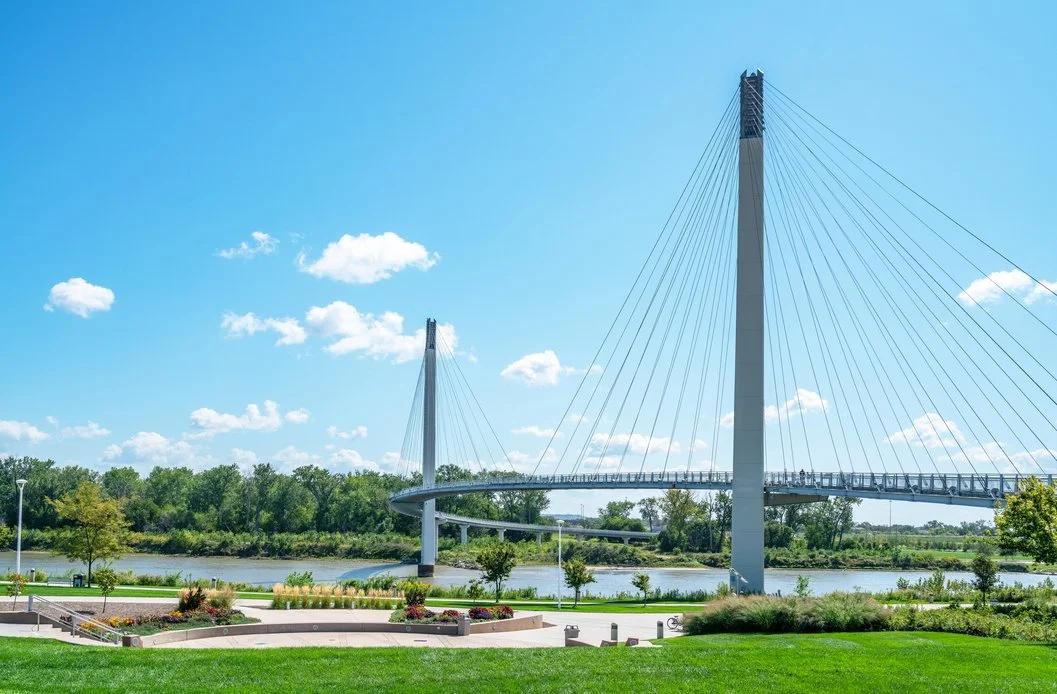
Photo Credit: Alamy Stock Photo
Composite index: 78.17
Retail & recreation change from baseline: 1.9%
Transit stations change from baseline: 4.7%
Workplaces change from baseline: -18.1%
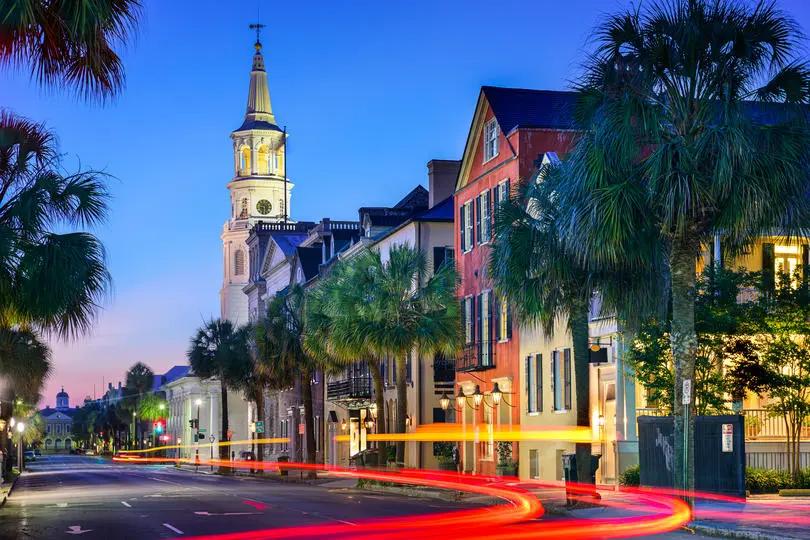
Photo Credit: Alamy Stock Photo
Composite index: 81.60
Retail & recreation change from baseline: 5.1%
Transit stations change from baseline: 13.8%
Workplaces change from baseline: -20.6%
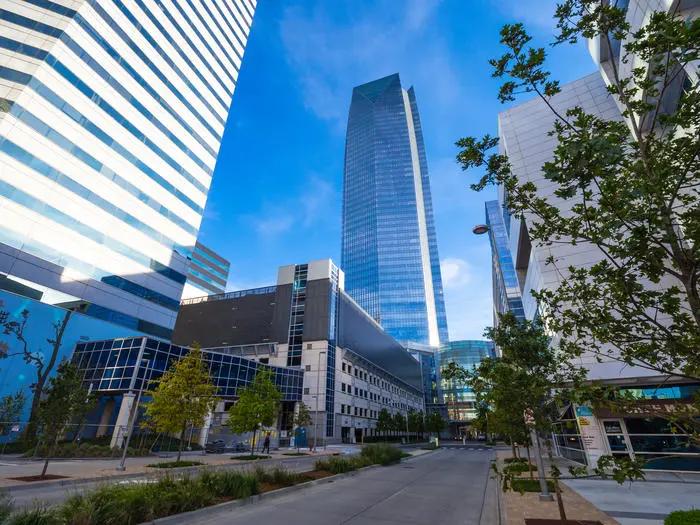
Photo Credit: Alamy Stock Photo
Composite index: 83.63
Retail & recreation change from baseline: 2.5%
Transit stations change from baseline: 11.1%
Workplaces change from baseline: -17.3%
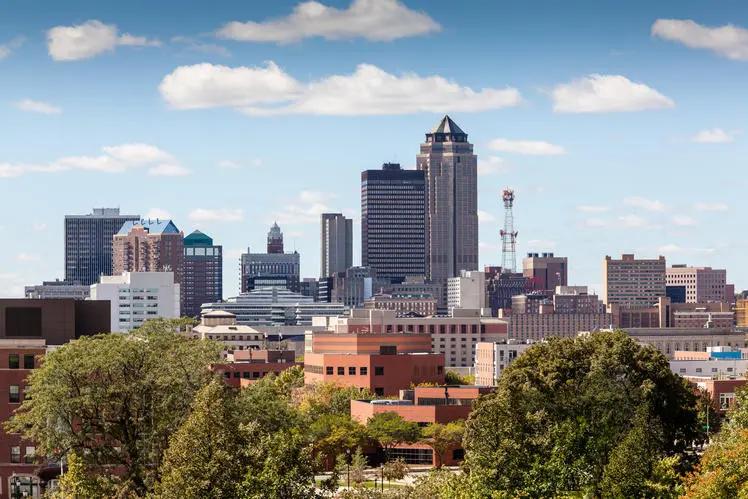
Photo Credit: Alamy Stock Photo
Composite index: 85.00
Retail & recreation change from baseline: 5.4%
Transit stations change from baseline: -3.9%
Workplaces change from baseline: -15.8%
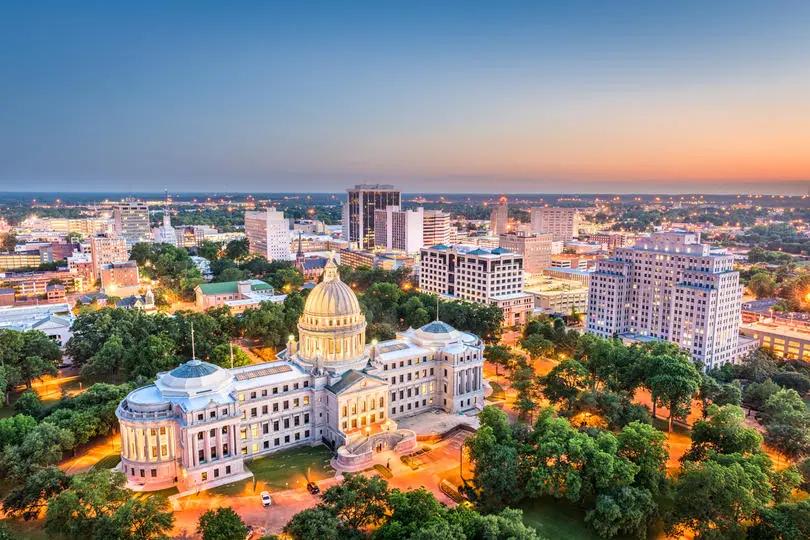
Photo Credit: Alamy Stock Photo
Composite index: 87.03
Retail & recreation change from baseline: 5.3%
Transit stations change from baseline: 21.9%
Workplaces change from baseline: -19.0%
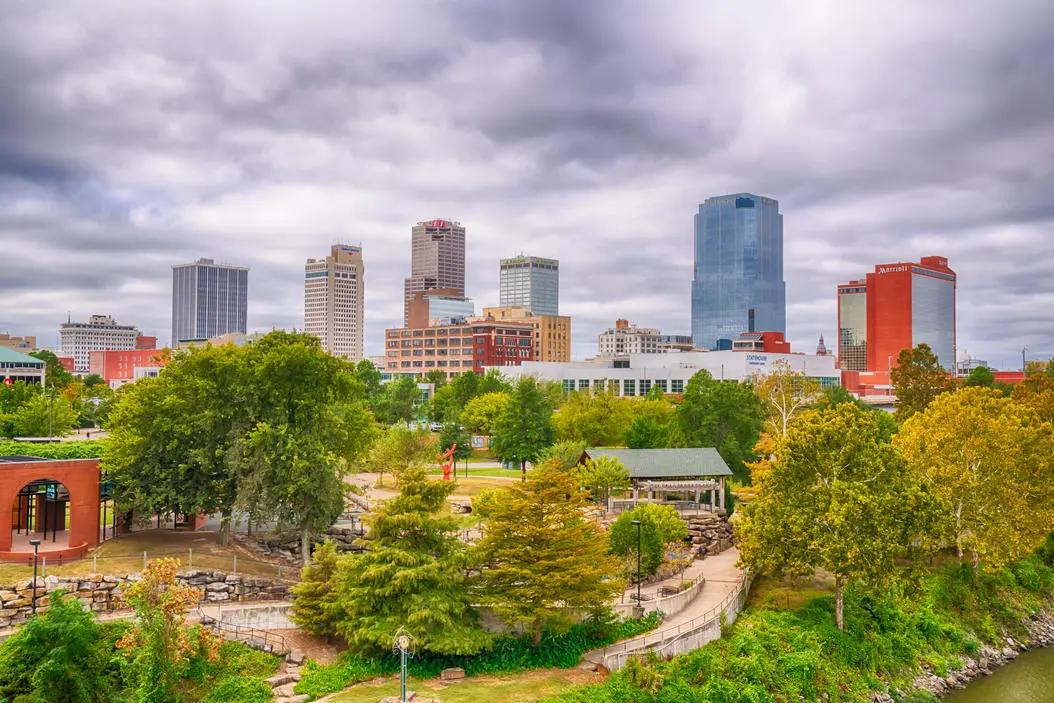
Photo Credit: Alamy Stock Photo
Composite index: 91.10
Retail & recreation change from baseline: 5.8%
Transit stations change from baseline: 13.2%
Workplaces change from baseline: -16.9%
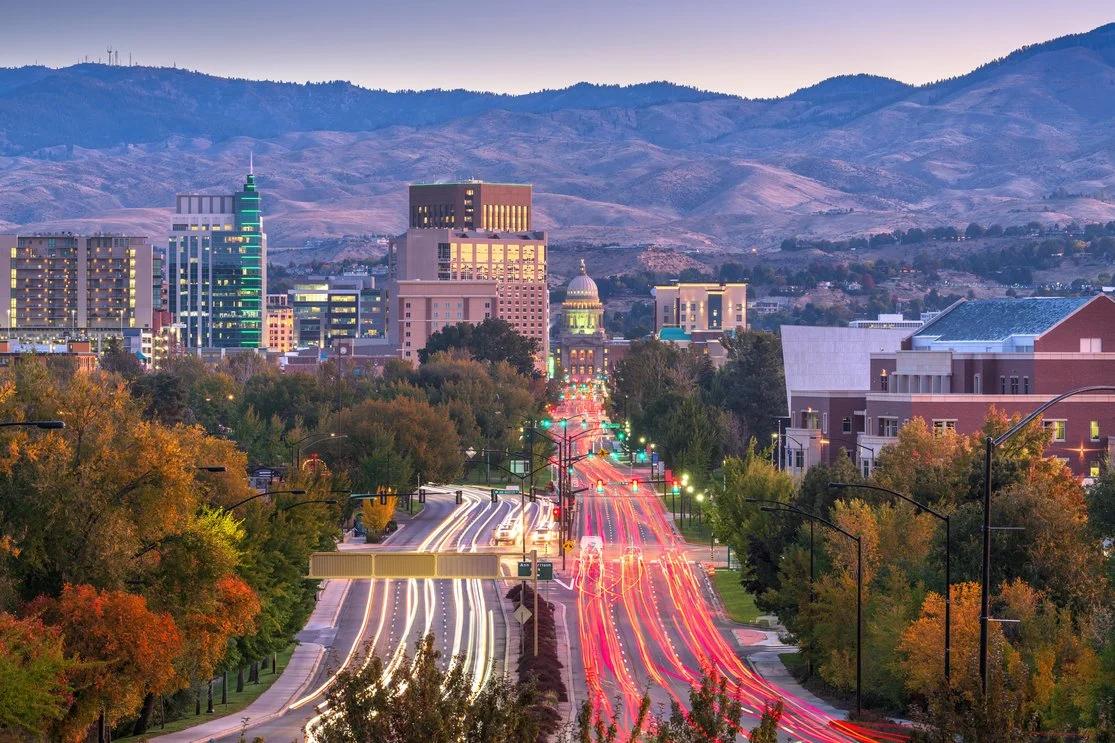
Photo Credit: Alamy Stock Photo
Composite index: 92.47
Retail & recreation change from baseline: 6.0%
Transit stations change from baseline: 14.2%
Workplaces change from baseline: -16.9%
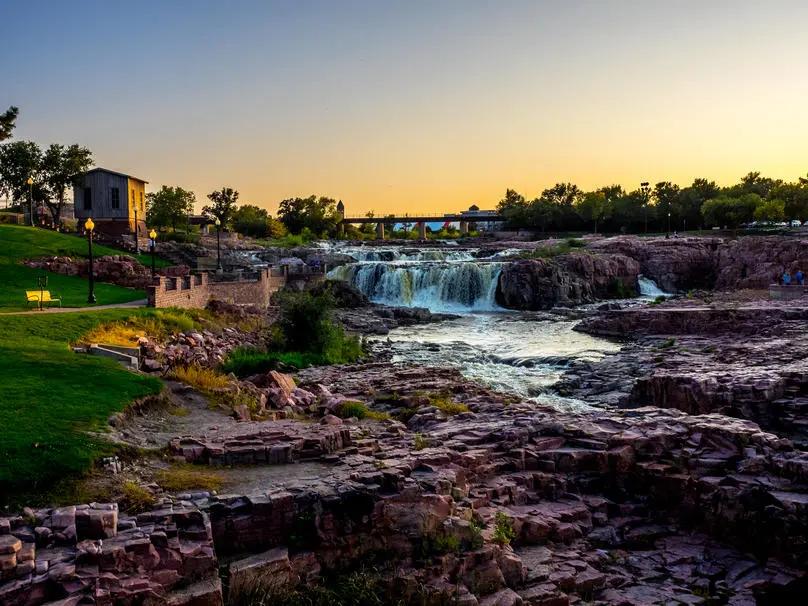
Photo Credit: Alamy Stock Photo
Composite index: 97.23
Retail & recreation change from baseline: 5.6%
Transit stations change from baseline: 15.4%
Workplaces change from baseline: -13.6%
Photo Credit: Alamy Stock Photo
Composite index: 97.93
Retail & recreation change from baseline: 6.1%
Transit stations change from baseline: 14.6%
Workplaces change from baseline: -14.6%
The data used in this analysis is derived from the Google COVID-19 Community Mobility Reports dataset, accessed: May 3, 2021. To identify which states have started reopening for business, researchers at Filterbuy created a composite index based on April 2021 visits to retail and recreation, transit, and workplace establishments. Data for each variable is expressed as a percentage change in visits compared to the baseline period of January 3–February 6, 2020.