May 5, 2026

By David Heacock
One of the most significant trends over the last decade for the economy, society, geopolitics, and the environment has been the rise of renewable energy. Fossil fuels have been the basis of the industrial economy for generations, powering tremendous economic growth but with dangerous consequences for the environment and public health. With the dramatic expansion of renewable energy technologies over the last decade, power sources like wind, solar, and geothermal have offered a more sustainable—and increasingly more affordable—path forward.
Several factors contribute to the expansion of clean energy. For one, technological advancement in renewables has made energy production and storage more efficient than ever before. The renewables industry has also received a boost from public policies and investments enacted by governments worldwide seeking to decarbonize in response to the threat of climate change. These developments have helped bring down renewable energy production costs over time, allowing market forces to spur continued growth in the sector. In all, electric power generated from renewables in the U.S. has grown by more than 70 percent since 2010.
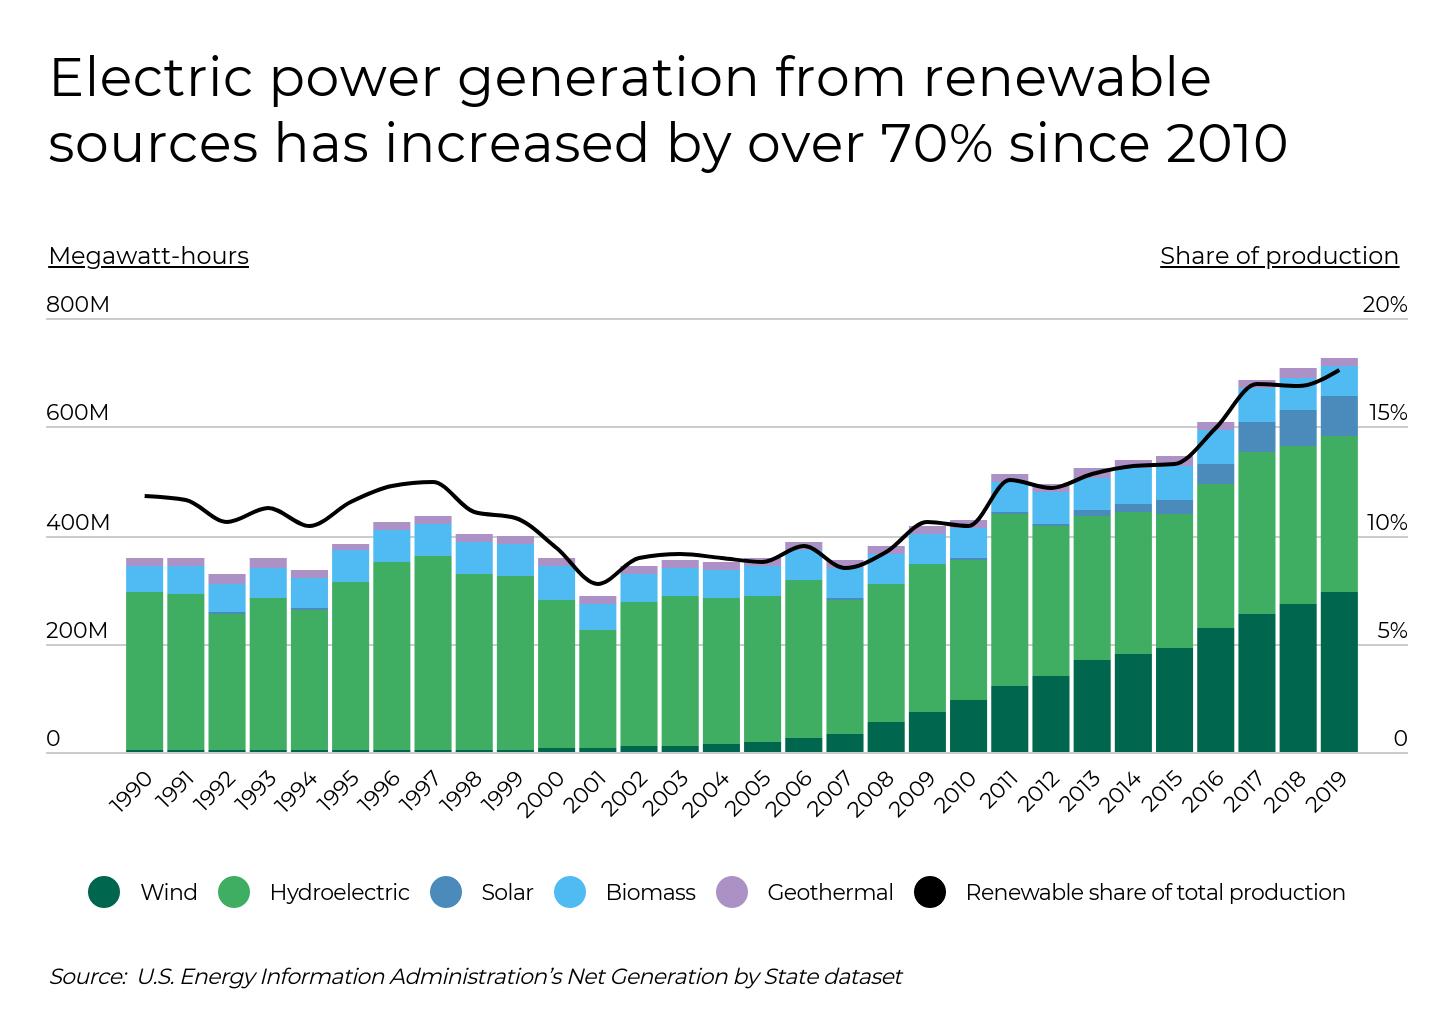
And although growth is occurring across many renewable sources, wind and solar have been the most prominent success stories of recent years. In 2007, wind accounted for about 35 million Megawatt-hours (MWh) of electricity produced in the U.S.; since then, wind production has increased by an average of around 20 million MWh per year, rising to nearly 295 million in 2019. Meanwhile, solar is the fastest-growing of all renewables. Solar production constituted less than 1 percent of renewable energy until around 2010, but experts now project that by 2050, solar and photovoltaic energy will account for nearly half of all renewable electricity production.
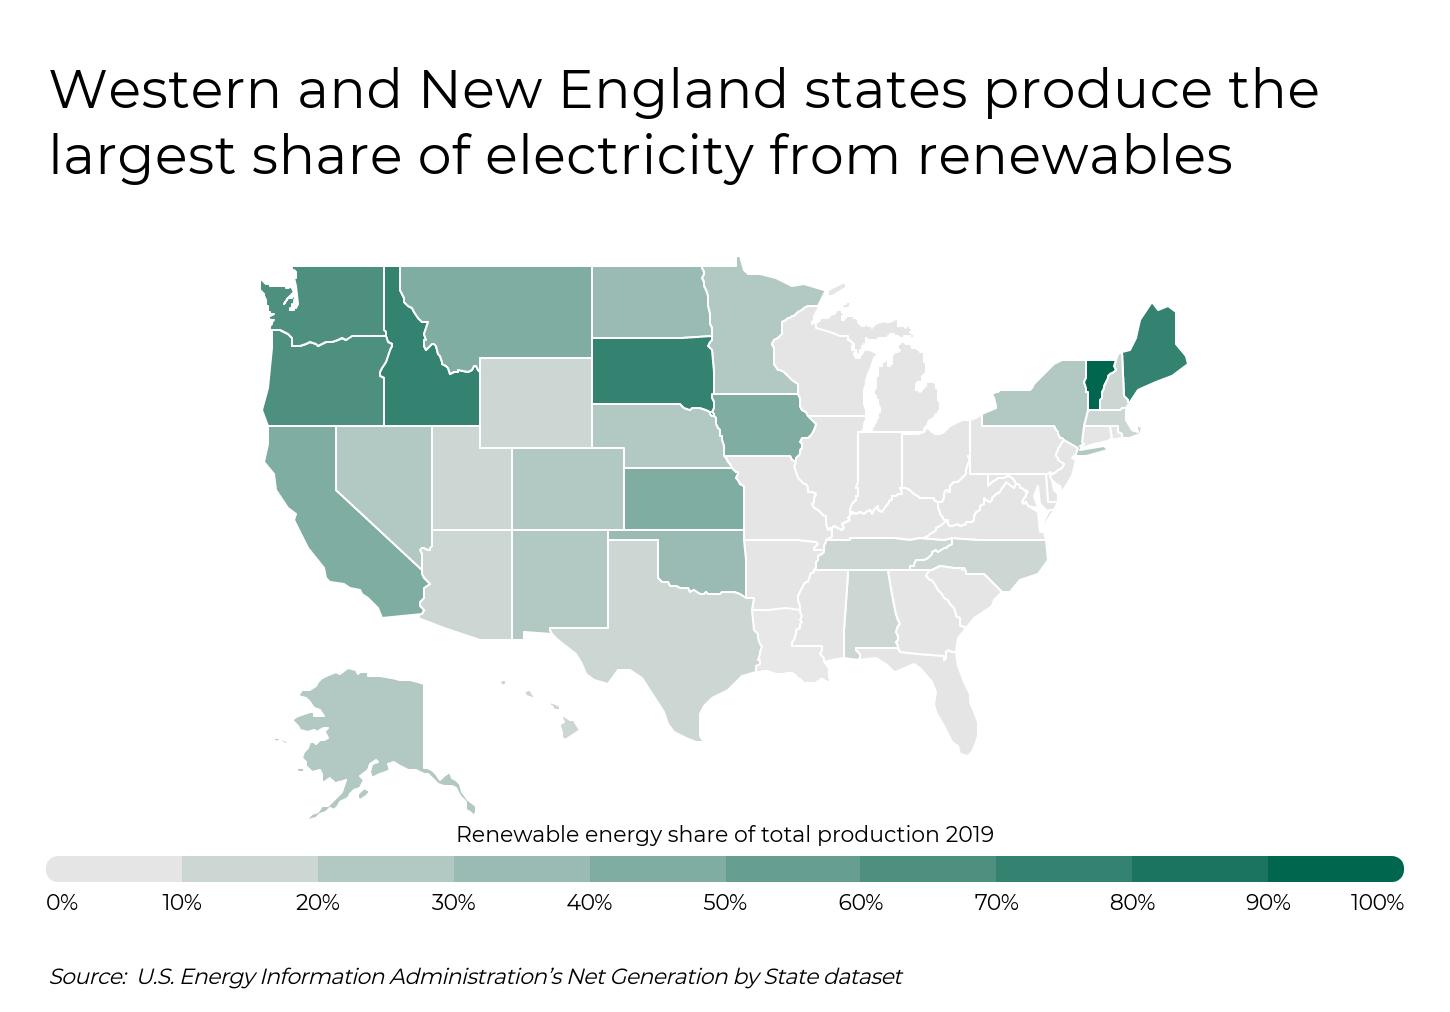
Growth in renewable energy production in the U.S. is widespread, but unique features of each region mean that the transition to renewables looks different from state to state. Measured by the proportion of total electricity generated from renewable sources, states in New England and the Western U.S. surpass the rest of the country, largely as a result of renewable-friendly state policies. Vermont generates a remarkable 99.9 percent of its electricity from renewables.
DID YOU KNOW? You should replace your home air filters every three months. If you’re looking for the best protection, Filterbuy’s MERV 13 air filters trap 98% of airborne particles, including potential allergens like mold, bacteria, and even those that carry viruses.
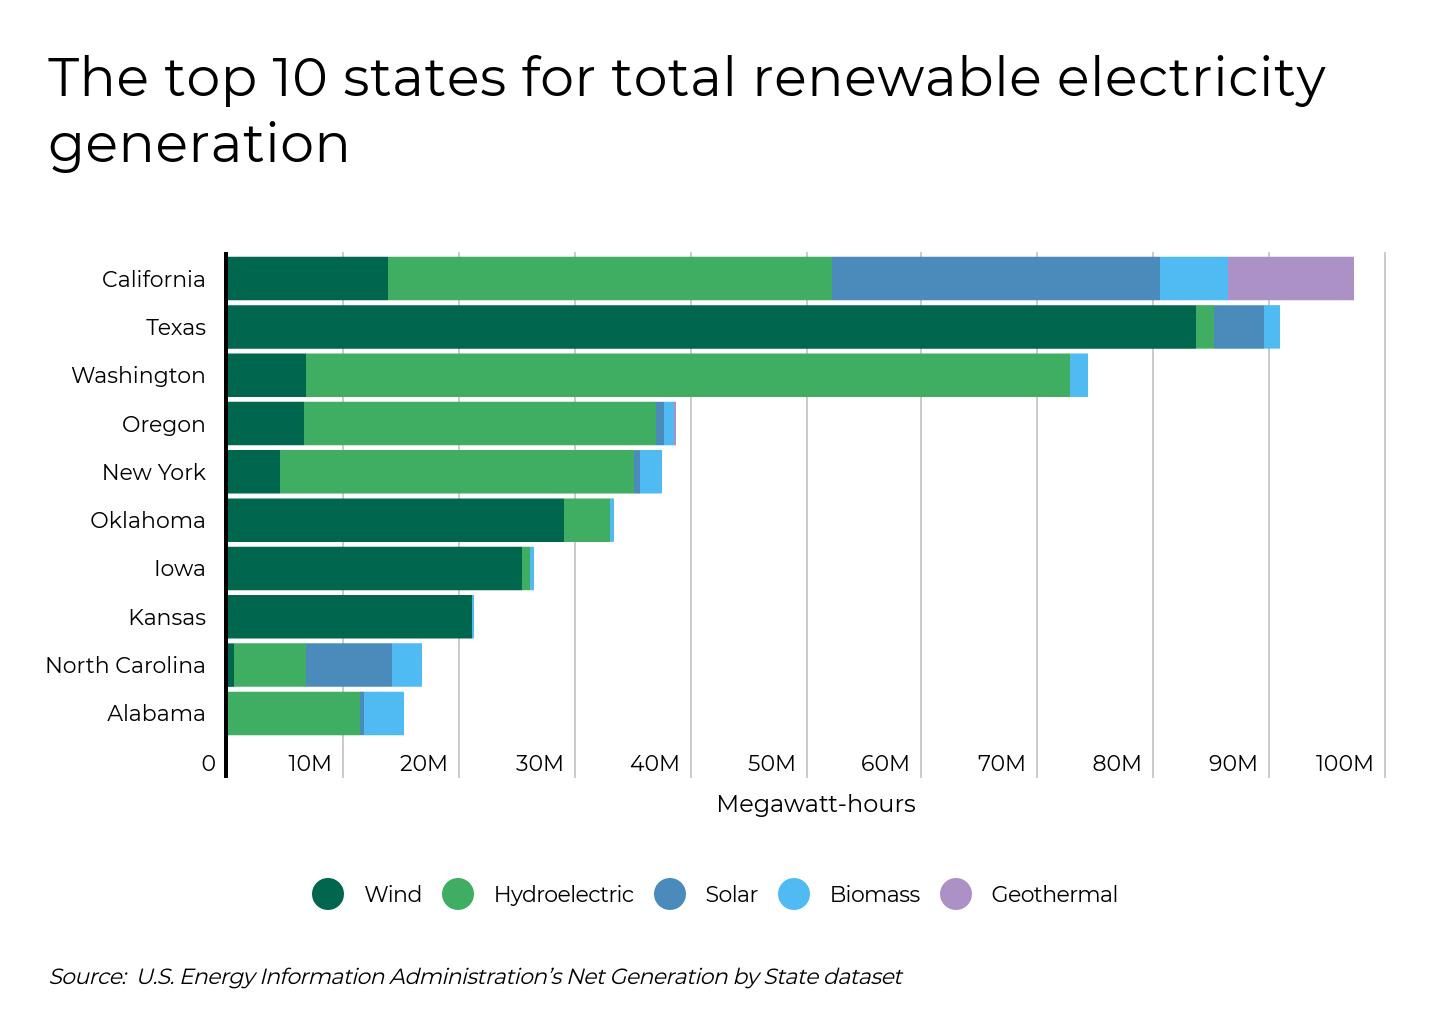
In terms of total electricity produced from renewables, California (97 million MWh), Texas (91 million MWh), and Washington (74 million MWh) are the national leaders. Physical geography explains much of these three states’ strength in renewables. California is the largest producer of geothermal (with the world’s largest geothermal field) and solar (due in part to large installations in the Mojave Desert). With plenty of cheap land and strong wind in many of its regions, Texas dominates the U.S. in wind production. And in Washington, major water features like the Columbia and Snake Rivers provide the basis for the nation’s strongest hydropower sector.
To identify the states with the fastest-growing renewable energy sector, researchers at FilterBuy used data from the U.S. Energy Information Administration to calculate the percentage change in renewable electricity production between 2010 and 2019. The researchers also calculated what percentage of total electricity production is accounted for by renewables, as well as the largest renewable energy source currently.
Here are the states with the largest increase in renewable energy production.

Photo Credit: Alamy Stock Photo
Percentage change in renewable energy production (2010-2019): 134.0%
Total renewable energy production 2019 (MWh): 14,392,502
Total renewable energy production 2010 (MWh): 6,150,146
Renewable energy share of total production 2019: 35.0%
Renewable energy share of total production 2010: 17.7%
Largest renewable energy source: Wind

Photo Credit: Alamy Stock Photo
Percentage change in renewable energy production (2010-2019): 143.3%
Total renewable energy production 2019 (MWh): 9,932,713
Total renewable energy production 2010 (MWh): 4,083,005
Renewable energy share of total production 2019: 8.5%
Renewable energy share of total production 2010: 3.7%
Largest renewable energy source: Wind

Photo Credit: Alamy Stock Photo
Percentage change in renewable energy production (2010-2019): 144.3%
Total renewable energy production 2019 (MWh): 16,709,383
Total renewable energy production 2010 (MWh): 6,839,691
Renewable energy share of total production 2019: 12.7%
Renewable energy share of total production 2010: 5.3%
Largest renewable energy source: Solar

Photo Credit: Alamy Stock Photo
Percentage change in renewable energy production (2010-2019): 155.3%
Total renewable energy production 2019 (MWh): 11,345,373
Total renewable energy production 2010 (MWh): 4,443,943
Renewable energy share of total production 2019: 28.4%
Renewable energy share of total production 2010: 12.6%
Largest renewable energy source: Solar

Photo Credit: Alamy Stock Photo
Percentage change in renewable energy production (2010-2019): 155.7%
Total renewable energy production 2019 (MWh): 26,356,275
Total renewable energy production 2010 (MWh): 10,308,651
Renewable energy share of total production 2019: 42.7%
Renewable energy share of total production 2010: 17.9%
Largest renewable energy source: Wind

Photo Credit: Alamy Stock Photo
Percentage change in renewable energy production (2010-2019): 173.6%
Total renewable energy production 2019 (MWh): 14,043,640
Total renewable energy production 2010 (MWh): 5,132,797
Renewable energy share of total production 2019: 24.9%
Renewable energy share of total production 2010: 10.1%
Largest renewable energy source: Wind

Photo Credit: Alamy Stock Photo
Percentage change in renewable energy production (2010-2019): 186.4%
Total renewable energy production 2019 (MWh): 15,057,518
Total renewable energy production 2010 (MWh): 5,256,702
Renewable energy share of total production 2019: 8.2%
Renewable energy share of total production 2010: 2.6%
Largest renewable energy source: Wind

Photo Credit: Alamy Stock Photo
Percentage change in renewable energy production (2010-2019): 188.6%
Total renewable energy production 2019 (MWh): 4,261,269
Total renewable energy production 2010 (MWh): 1,476,479
Renewable energy share of total production 2019: 10.9%
Renewable energy share of total production 2010: 3.5%
Largest renewable energy source: Solar

Photo Credit: Alamy Stock Photo
Percentage change in renewable energy production (2010-2019): 189.8%
Total renewable energy production 2019 (MWh): 3,272,411
Total renewable energy production 2010 (MWh): 1,129,113
Renewable energy share of total production 2019: 2.7%
Renewable energy share of total production 2010: 0.8%
Largest renewable energy source: Wind
Photo Credit: Alamy Stock Photo
Percentage change in renewable energy production (2010-2019): 213.9%
Total renewable energy production 2019 (MWh): 90,922,198
Total renewable energy production 2010 (MWh): 28,966,660
Renewable energy share of total production 2019: 18.8%
Renewable energy share of total production 2010: 7.0%
Largest renewable energy source: Wind

Photo Credit: Alamy Stock Photo
Percentage change in renewable energy production (2010-2019): 228.5%
Total renewable energy production 2019 (MWh): 472,344
Total renewable energy production 2010 (MWh): 143,779
Renewable energy share of total production 2019: 6.2%
Renewable energy share of total production 2010: 1.9%
Largest renewable energy source: Biomass

Photo Credit: Alamy Stock Photo
Percentage change in renewable energy production (2010-2019): 310.1%
Total renewable energy production 2019 (MWh): 8,496,851
Total renewable energy production 2010 (MWh): 2,071,802
Renewable energy share of total production 2019: 24.2%
Renewable energy share of total production 2010: 5.7%
Largest renewable energy source: Wind

Photo Credit: Alamy Stock Photo
Percentage change in renewable energy production (2010-2019): 377.6%
Total renewable energy production 2019 (MWh): 33,281,621
Total renewable energy production 2010 (MWh): 6,968,743
Renewable energy share of total production 2019: 39.1%
Renewable energy share of total production 2010: 9.6%
Largest renewable energy source: Wind

Photo Credit: Alamy Stock Photo
Percentage change in renewable energy production (2010-2019): 379.7%
Total renewable energy production 2019 (MWh): 8,667,568
Total renewable energy production 2010 (MWh): 1,807,009
Renewable energy share of total production 2019: 23.2%
Renewable energy share of total production 2010: 4.9%
Largest renewable energy source: Wind

Photo Credit: Alamy Stock Photo
Percentage change in renewable energy production (2010-2019): 511.0%
Total renewable energy production 2019 (MWh): 21,218,058
Total renewable energy production 2010 (MWh): 3,472,565
Renewable energy share of total production 2019: 41.7%
Renewable energy share of total production 2010: 7.2%
Largest renewable energy source: Wind
The data used in this analysis is from the U.S. Energy Information Administration’s Net Generation by State dataset. Researchers ranked states based on the percentage change in renewable electricity production between 2010 and 2019. For the purpose of this analysis, renewable energy sources include wind, solar thermal and photovoltaic, geothermal, biomass, and hydroelectric. Researchers also calculated the proportion of total electricity generation accounted for by renewable sources in both 2010 and 2019, as well as the largest renewable energy source in 2019 for each state.